

Introduction
Metabolic syndrome (MetS) is characterized by conditions of hyperglycemia, decreased serum high-density lipoprotein, increased serum triglycerides, abdominal obesity, and high blood pressure. When three out of the five criteria are met, then the condition is categorized as MetS 1. The prevalence of MetS increases every year, with approximately 20%–25% of adults worldwide experiencing MetS 2 and cases in Indonesia exceeded 13.3% 3. People with MetS have a higher risk of suffering degenerative disease such as diabetes mellitus type 2 (DM-2) and cardiovascular diseases because of oxidative stress conditions 4.
In general, MetS are affected by internal and external factors whereby internal factor (genetic) is caused by a genetic mutation that affects leptin (hormone) and its receptor5. One of the external factors is a lifestyle including the consumption of high-fat and simple-sugar-containing foods and a lack of physical activity 6. A high fat diets that contains high calorie triggers the accumulation of visceral fat and lipotoxicity that can lead to insulin resistance, increase oxidative stress, and systemic inflammation7. Excessive fructose consumption increase glucose metabolism in the liver that can accumulate triglyceride and cholesterol and induce insulin resistance8.
Consumption of vegetables with a high content of antioxidants are highly recommended in the management of MetS 9.10 as it can improve the oxidative status and MetS components such as lipid profile 11-14. The consumption of green vegetables with their active components such as carotenoid and flavonoid can play roles in glucose metabolism and prevention of risk of type-2 diabetes mellitus (DM)15,16.
Mangkokan leaf is an Indonesian term for Nothopanax scutellarius, and the Javanese people of Indonesia have a long history of consuming the leaves as part of their daily diets. The leaves are commonly consumed fresh, called “lalapan” or a salad, or cooked. It has potential as an antioxidant source due to its various phytonutrient content such as flavonoid, phenolic, and pigments (chlorophyll, carotene) 17. On the other hand, antioxidant content in green leaves is significantly affected by the cooking method. Brief boiling (30-60 seconds) has been shown to increase the antioxidant content of green leafy vegetables (Murwani et al., unpublished). In this study, we aimed to reduce MetS biomarkers by studying the effect of incorporation of Nothopanax scutellarius (Burm. f.) Merr, fresh or boiled, as part of a normal diet of Wistar rats.
Research Design and Method
Research Method
Ethical clearance with No.139/EC/H/KEPK/FK-UNDIP/XI/2019 for this study had been granted from our institution the Health Research Ethics Commission of the Faculty of Medicine, Diponegoro University-RSUP.Dr. Kariadi Semarang.
Plant Materials and Standard Diet Containing N. Scutellarius
Nothopanax scutellarius leaves were purchased from local breeders in Banjarnegara, Central Java, Indonesia. Two forms of Mangkokan leaves (fresh and boiled, Fig. 1a and 1b) were prepared. Fresh N. scutellarius were washed with tap water and drained. Boiled N. scutellarius were prepared by immersion in 100 °C boiling water for 1 minute and cooled directly by immersion in iced water and then drained18. The fresh and boiled leaves were finely cut up and homogenized separately using a blender for 3 minutes.
A standard diet containing fresh N. scutellarius leaves were prepared by mixing the homogenized leaves into a standard “semi-purified rodent diet” (69.03% carbohydrate, 13.65% protein, 2.01% fat, and 317.59 kcal energy per 100 g) with a composition of 33.3% (1/3) and 66.7% (2/3), respectively. The mixture was then formed into pellets (Fig.1c). The preparation of a standard diet containing boiled N. scutellarius follows the same procedure (Fig.1d). The percentage of N. scutellarius, i.e., one-third of daily diet intake, was compose based on the My Plate (Piringku) guide from the Indonesian Ministry of Health for a healthy diet.
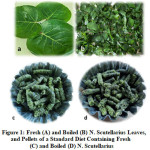 |
Figure 1: Fresh (A) and Boiled (B) N. Scutellarius Leaves, and Pellets of a Standard Diet Containing Fresh (C) and Boiled (D) N. Scutellarius |
Determination of Antioxidant Activity (DPPH) of N. scutellarius Leaves
The fresh and boiled N. scutellarius leaves antioxidant activity was determined using the DPPH (2,2-diphenyl-1-picrylhydrazyl) method (Hatano et al.,1998)19. A 0.1 g sample was transferred to a test tube that contained 5 mL of 60 μM DPPH in an ethanol solution, homogenized, and incubated at room temperature under low light conditions for 1 hour. The absorbance of the sample was measured using a UV-Vis spectrophotometer at a wavelength of 517 nm. The percent antioxidant activity was expressed as percent inhibition according to the equation below:
Inhibition (%) = [(A0 − A1) ∕ A0] × 100
where A0 is the absorbance of the control reaction (DPPH∙ and ethanol), and A1 is the absorbance in the presence of substances.
Total Phenolic Determination in N. scutellarius Leaves
Total Phenolic Content (TPC) was determined using the Folin-Ciocalteau assay (Senter et.al.,1989 from Suradi, 1998)20. Dried leaves powder (20 g) of N. scutellarius was packed into a Soxhlet apparatus and extracted with 300 mL methanol at 60–65 0C for 3–4 h. The extract was filtered and the filtrate was concentrated under reduced pressure at 40 0C and dried.
One g of methanol extract was diluted until 100 mL with distilled water. One mL of diluted sample was transferred to a new tube, added with 5 mL of 2% Na2CO3, and incubated at room temperature for 10 minutes. Folin Ciocalteau reagent of 0.5 mL was added and then homogenized and stored at room temperature with low light for 30 minutes. The absorbance of the sample was measured at a wavelength of 750 nm using a UV-VIS spectrophotometer (UV-1800 Shimadzu).
Total Flavonoid Determination of N. scutellarius Leaves
Total flavonoid was determined using the spectrophotometer method (IKU/5.4/TF-UV-03). Mangkokan leaves were cut into small pieces, dried in an oven at 450C for 48 hours and processed into a simplicial powder. One hundred mg of sample was put in 10 mL test tube, added with 0.3 mL of 5% NaNO2. After 5 minutes, 0.6 mL of 10% AlCl3 was added, stood for 5 minutes, then 2 mL of 1 M NaOH and distilled water were added until reaching 10 mL volume. The mixture was diluted 5 times and transferred into a cuvette. Absorbance was determined using UV-Vis spectrophotometer (UV-1800 Shimadzu) at a maximum wavelength of 510 nm.
Phytochemical (Chlorophyll and Carotenoid) Determination
For chlorophyll and carotenoid determination, 1 g of N. scutellarius leaves were weighed and mashed in a mortar, then extracted using 100 mL of 80% acetone and stirred until the chlorophyll and carotenoids dissolved (Kurniawan et al., 2010) 21. The extract was filtered, and the filtrate was measured using a spectrophotometer at wavelengths of 480, 646, and 663 nm. Total chlorophyll and carotenoid were calculated using the following formula :
Total Chlorophyll (mg/L) = (17,3 x A646) + (7,18 x A663)
![]()
A480 : Absorbance in wavelength 480 nm
A646 : Absorbance in wavelength 646 nm
A663 : Absorbance in wavelength 663 nm
V : volume extract (mL)
W : sample weight (g)
High-Fat-High-Fructose (HFHFr) Diet
Our own HFHFr diet was formulated by mixing a standard “semi-purified diet” (69.03% carbohydrate, 13.65% protein, 2.01% fat, and 317.59 kcal energy per 100 g; code S00202001078) with beef tallow, egg yolk powder, high-fructose corn syrup, and water to obtain a homogeneous mixture. The mixture was formed into pellets and the pellets air-dried at 25 °C. The HFHFr diet pellets contain 31.46% fat, 41.95% carbohydrate, 11.93% protein, and 473.96 kcal energy/100 g diet. In addition to the HFHFr diet, during the induction of MetS, rats were also given 20% fructose (corn syrup) in drinking water (100 ml/day). This method was commonly used in previous studies to induce MetS in rats 8,22.
In Vivo Experimental Design
Twenty-four 12 week-old male Wistar rats with a mean weight of 150 ± 16 g were obtained from Animal House in Semarang, Indonesia and housed in individual cages with a standard 12 hour light/dark photoperiod at an environmental temperature of 24–25 °C. Rats were given 15 g/day standard diet (standard normal diet for a maintenance period of rats that contains 69.03% carbohydrate, 13.65% protein, and 2.01% fat, and 317.59 kcal energy per 100 g, modified from Reeves, 1997) and 100 ml/day water for seven days acclimatization period. After acclimatization, rats were divided randomly into four groups: i) control diet group (C), ii) high-fat high-fructose diet (HFFD), iii) fresh N. scutellarius (FNs), and iv) boiled N. scutellarius (BNs) with the same average body weight in each group. The HFHFr diet was given 15 g/day accompanied by 20% fructose in drinking water (100 ml/day) to the HFFD, FNs, and BNs groups for 29 days. After 29 days of administration of HFHFr feeding, 3 mL of blood sampling via the retro-orbital plexus was carried out following an overnight fast to obtain pre-test data. The HFFD, FNs, and BNs groups were given standard, fresh, and boiled feed containing N. scutellarius for 29 days after blood sampling. At the end of N. scutellarius diet, blood was resampled to obtain post-test data. Serum was obtained by centrifuging the blood at 4000 rpm for 15 minutes to separate the serum and it was stored at < (- 150C) until analysis. Feed and fluid intake were recorded every day during the study. The animal experimental design is summarized in Figure 2.
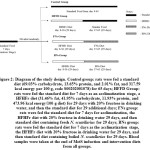 |
Figure 2: Diagram of the study design. |
Measures of Food and Fluid Intake in Rats
Intake of food and drink of experimental rats was recorded daily by weighing feed (g) and drink (mL) residue daily, and the intake was calculated by subtracting a fixed amount of given feed and drink with the residue. The daily intake during 29 days of MetS induction or after 29 days of diet intervention was calculated by averaging the daily data.
Measures of Metabolic Syndrome Components
Obesity
Obesity in rats was determined based on the Lee Index score; when the result is >300 the rat is categorized as obese 23.
Lee Index = {Body weight (g)1/3 / Naso-anal length (cm)} × 103
Fasting Blood Glucose Assay
Fasting glucose from blood serum was measured by the GOD-PAP method (DiaSys). After 12 hours of fasting, whole blood was drawn from the ophthalmic venous plexus. First, 10 µL of blood serum was mixed with 1000 µL glucose reagent and incubated at 20–25 °C for 10 min. Absorbance against a blank was read within 60 min at a wavelength of 500 nm.
Triglyceride (TG) Assay
After 12 hours of fasting, rat blood samples were drawn from the venous retro orbitalis. Blood was centrifuged to separate the serum. Triglycerides were determined using the GPO-PAP method (DiaSys)13
Total Cholesterol (TC) Assay
Whole blood was obtained after 12 hours of fasting from the venous plexus retro orbitalis of rats and then centrifugated to separate the serum. TC was determined by the CHOD-PAP method (DiaSys) 13
High density lipoprotein cholesterol (HDL-C) Assay
Serum (0.02 mL) was added to 0.5 mL of sediment solution, then the mixture was centrifuged for about 20 minutes at 4500 rpm. The supernatant (0.01 ml) was mixed with 1 mL cholesterol reagent. HDL cholesterol was assayed using the CHOD-PAP (DiaSys) method by the same procedure as for TC13.
Low density lipoprotein cholesterol (LDL-C) Assay
LDL was determined directly using the CHOD-PAP method and precipitant LDL. Serum of 100 µL was mixed with 1000 µL precipitating reagent and incubated for 15 min at room temperature, then centrifuged for 20 min at 2500 g. Within one hour after centrifugation, 100 µL of the clear supernatant was transferred to the reaction solution for determination of cholesterol13.
Malondealdehyde (MDA) Assay
Serum MDA was determined using the TBARS (2-thiobarbituric acid reactive substance) method 24. A standard or serum sample of 50 µL was mixed with 750 µL phosphate acid and 250 µL TBA (thiobarbituric acid) and homogenized using a vortex. Distilled water (450 µL) was added and the sample heated for 60 minutes, after which it was cooled in an ice bath. The sample absorbance was read by spectrophotometry at 534 nm.
Statistical Analysis
Statistical analysis was performed using IBM SPSS Statistic version 16 (IBM Corp., Armonk, NY, USA), and differences were considered significant at p < 0.05. To analyze differences between mean values pre- and post-intervention, we used a paired Student’s t-test for normally distributed data and a Wilcoxon Test for non-normally distributed data. To assess differences between means among groups, we used a one-way ANOVA for normally distributed data and a Kruskal–Wallis test for data that were not normally distributed.
Results
Proximate Analysis of N. Scutellarius
The proximate composition of N. scutellarius is presented in Table 1. Moisture is the largest component of fresh N. scutellarius leaves, comprising 81.895 ± 0.075% per 100 g fresh weight. Crude fiber is the smallest component of fresh N. scutellarius, i.e., 1.05%.
Table 1: Proximate Analysis of Fresh N. Scutellarius Leaves (100 g)
| Parameter | Result * |
| Protein (%) | 3.07 ± 0.02 |
| Fat (%) | 1.83 ± 0.01 |
| Crude Fiber (%) | 1.05 ± 0.02 |
| Moisture (%) | 81.90 ± 0.08 |
| Ash (%) | 2.77 ± 0.02 |
| Carbohydrate (%) | 10.435 ± 0.065 |
| Energy (Kcal/100 g) | 70.49 ± 0.27 |
*average value of the two measurements
Moisture content using the oven method (SNI 01-2891-1992, point 5.1), Ash content according to method (SNI 01-2891-1992, 6.1), protein content using the Kjeldahl method (18-8-31/MU/SMM SIG), Fat content using the Soxhlet method (18-8-5/MU/SMM SIG, Weibull). Carbohydrate content by difference (18-8-9 /MU/SMM SIG). Crude fiber by the gravimetry method (18-11-111/MU/SMM SIG). Total calories were obtained by calculation. SNI, Standard National Indonesia for proximate determination method on the basis of AOAC
Antioxidant Properties and Phytochemical Content of N. Scutellarius
Table 2 shows the bioactive content of fresh and boiled leaves of N. scutellarius. Boiled leaves contain higher moisture, antioxidant activity, and total phenolic than fresh leaves. However, they were lower in total flavonoids, carotene, and chlorophyll than boiled leaves.
Table 2: Antioxidant Properties of Fresh and Boiled N.Scutellarius Leaves
| Fresh | Boiled | |
| Moisture (%) | 81.90 ± 0.08 | 86.81±0.63 |
| Antioxidant activity, DPPH (%) | 55.52 ± 0.3* | 61.64 ± 0.45* |
| Total Phenolic Content (mg GAE /100gr) | 111.32 ± 0.43* | 112.815 ± 0.045* |
| Total Flavonoid(Quercetin Equivalent /%w/w) | 0.44 | 0.41 |
| Total Chlorophyll (mg/100gr) | 120.905 ± 0.345* | 96.485 ± 0.565* |
| Total Caroten (ppm) | 817.69 ± 1.78* | 787.67 ± 1.83* |
Food, Fluid, and Energy Intake
During the induction of MetS, food intake in the control group was significantly higher than in the HFFD, FNs, or BNs groups (p < 0.05). Meanwhile, fluid intake in the control group was significantly lower than that in the HFFD, FNs, and BNs groups (Table 3). During the 29 days of N. scutellarius-containing normal diet feeding (with the HFFD group receiving the normal diet), food and fluid intake did not differ among groups (p > 0.05).
Table 3: Food, Fluid, and Energy Intake of Rats after 29 Days Induction of Metabolic Syndrome and After 29-Days Intervention with N. Scutellarius Diet
| Control | HFFD | FNs | BNs | p | ||
| Induction Metabolic Syndrome | Food Intake (g) | 10.04 ± 0.55a | 6.2 ± 3.84b | 4.6 ± 0.90b | 4.25 ± 0.50b | 0.009 * |
| Fluid Intake (mL) | 29.00 ± 8.63a | 59.00 ± 6.00b | 56.40 ± 1.95b | 60.75 ± 4.11b | 0.026* | |
| Total Energy (kkal) | 33.03 ± 1.74a | 54.89 ± 1.74b | 54.12 ± 5.45b | 55,52 ± 4.03b | 0.012* | |
| Nothopanax s. diet | Food Intake (g) | 11.4 ± 0.90 | 11.4 ± 1.67 | 10.4 ± 0.55 | 10.75.± 1.71 | 0.629 |
| Fluid Intake (mL) | 26.8 ± 8.82 | 30.4 ± 7.13 | 25.0 ± 3.04 | 23.00 ± 0.82 | 0.534 | |
| Total Energy (kkal) | 36.20 ± 2.84a | 36.20 ± 5.31a | 24.79 ± 1.36b | 26.44 ± 4.22b | 0.002* | |
Notes: values are average of five replicates ± SD. * : Significant at P < 0.05.P : One-way ANOVA, LSD if data were normally distributed, Kruskal–Wallis and Mann–Whitney if not.
HFHFr diet: High-Fat High-Fructose diet accompanied by 20% fructose drinking water for 29 days induction of metabolic syndrome.
Intervention diet: Standard normal diet in C and HFFD, N. scutellarius-containing standard diet in FNs and BNs (29 days).
Energy intake of HFFD, FNs, BNs during MetS is significantly higher (p<0.05) than the control group that receives only standard diet during the whole experiment. After 29 days of diet intervention, energy intake FNs, BNs dropped significantly (p<0.05) and they were significantly different than control and HFFD groups.
Effect of an N. scutellarius-Containing Diet on Body Weight and Lee Index Scores
After 29 days of induction of MetS with an HFHFr diet in the HFFD, FN, and BN groups, their body weights were not significantly increased nor different (p = 0.364) to those of the normal control diet group (Table 4). After 29 days of intervention with a normal diet in the HFFD group and with N. scutellarius-containing diet administration in the FNs and BNs groups, body weight of the FNs BNs groups declined significantly (p < 0.05) compared with the control or HFFD groups. Meanwhile, body weight of the control and HFFD groups increased significantly (p>0.05). The Lee Index score showed a similar pattern to body weight, with the HFFD group showing a significant increase (p = 0.010) post-intervention.
Effect of an N. scutellarius-Containing Diet on Fasting Blood Glucose (FBG)
After induction of MetS, the FBG level in HFFD, FNs, and BNs increased significantly compared with the normal control group (p = 0.009). After 29 days of intervention, the FBG level in the HFFD, FNs, and BNs groups decreased significantly, while a significant reduction occurred in the FNs and HFFD groups (p < 0.05) (Table 4).
Effect of an N. scutellarius–Containing Diet on Malondialdehyde (MDA)
Malondialdehyde (MDA) is one of the lipid peroxidation products commonly used as a biomarker of oxidative stress. After induction of MetS with the HFHFr diet, the MDA level in the three groups increased significantly compared with the normal control diet. After 29 days of intervention, the MDA content of the FNs and BNs groups decreased significantly (p 0.000). Meanwhile, that of the HFFD group increased slightly (p=0.10) to levels similar to those of the normal control group. When the post-intervention values of MDA were compared, those of the HFFD group remained high, while those of the FNs and BNs groups had decreased significantly (p=0.000) (Table 4).
Effect of an N. scutellarius–Containing Diet on Lipid Profiles
After 29 days of induction of MetS with an HFHFr diet, TG, LDL-C, and TC had increased, but HDL-C had decreased in all groups. After 29 days of intervention, the TG level in the FNs and BNs groups decreased significantly (p > 0.05) but there was a slight increase in the control and HFFD group. Total cholesterol (TC) in the FNs and BNs groups decreased significantly after the intervention (p = 0.000); meanwhile, the levels of TC in the control and HFFD groups increased slightly but significantly (p < 0.05). The LDL-C levels in all groups decreased significantly; this decrease was greater in the FNs and BNs groups (p < 0.05).
Table 4: Body Weight, Lee Index Score, and Serum Profile of Rats Before and After 29-Day N. scutellarius Diet Intervention
| Groups | P | |||||
| Control | HFFD | FNs | BNs | |||
| Body Weight(g) | Pre | 188.20±18.83 | 178.20±9.09 | 194.80±7.46 | 197.60±24.95 | 0.364 |
| Post | 210.40±10.79 | 199.20±9.89 | 193.80±7.19 | 187.60±29.49 | 0.299 | |
| Δ | 22.20±9.63a | 21.00±6.44a | – 1.00±0.70b | -10.00±21.44b | 0.001* | |
| p | 0.007* | 0.002* | 0.034* | 0.356 | ||
| Lee Index Scores | Pre | 307.60±15.99 | 318.40±8.20 | 320.00±5.70 | 316.40±3.36 | 0.413 |
| Post | 317.60±11.89 | 328.60±10.11 | 319.40±5.69 | 313.60±8,08 | 0.110 | |
| Δ | 10.00±17.27a | 10.20±5.02a | – 0.60±0.55b | – 2.8±5.72b | 0.026* | |
| p | 0.265 | 0.010* | 0.070 | 0.335 | ||
| Fasting Glucose (mg/dL) | Pre | 113.50±14.78a | 160.46±15.00b | 151.02±22.38b | 132.32±16.39c | 0.009* |
| Post | 127.44±37.50 | 122.80±14.72 | 123.30±10.74 | 118.76±16.45 | 0.944 | |
| Δ | 13.94±39.56a | -37.66±10.99b | 27.72±11.72b | -13.56±21.64c | 0.010* | |
| p | 0.475 | 0.002* | 0.006* | 0.234 | ||
| TG(mg/dL) | Pre | 69.67±2.22a | 183.05±2.90b | 180.79±1.69b | 185.56±2.01c | 0.000* |
| Post | 73.50±13.89a | 185.42±4.38b | 120.15±2.91c | 130.25±3.17d | 0.000* | |
| Δ | 38.32±0.90a | 2.37±2.77a | 60.65±4.44b | 55.03±4.36b | 0.002* | |
| P | 0.001* | 0.128 | 0.000* | 0.000* | ||
| TotalCholesterol (mg/dL) | Pre | 78.03±1.38a | 118.87±2.42b | 122.40±1.36b | 120.99±3.18b | 0.000* |
| Post | 79.22±1.99a | 123.45±2.26b | 96.16±2.86c | 98.36±2.52c | 0.000* | |
| Δ | 1.19±0.79a | 4.59±2.88a | – 26.25±4.11b | – 22.64±3.19b | 0.000* | |
| 0.011* | 0.024* | 0.000* | 0.000* | |||
| HDL-Chol(mg/dL) | Pre | 82.31±1.08a | 31.02±1.77b | 31.84±1.01c | 32.24±2.29b | 0.000* |
| Post | 80.61±2.07a | 28.24±1.71b | 69.47±1.21c | 55.12±1.98d | 0.000* | |
| Δ | -1.69±1.23a | -2.78±1.06a | 37.63±1.09b | 22.28±2.31c | 0.000* | |
| p | 0.037* | 0.004* | 0.000* | 0.000* | ||
| LDL-Chol(mg/dL) | Pre | 22.42±1.26a | 68.93±1.99b | 67.96±1.79b | 67.68±1.79b | 0.000* |
| Post | 24.29±2.75a | 70.29±2.94b | 34.33±3.12c | 48.90±1.68d | 0.000* | |
| Δ | 1.87±2.15a | 1.36±1.12a | -33.63±3.06b | -18.78±3.14c | 0.000* | |
| p | 0.125* | 0.053* | 0.000* | 0.000* | ||
| MDA(nmol/dL) | Pre | 1.13±0.28a | 9.12±0.24b | 9.10±0.32b | 9.12±0.29b | 0.000* |
| Post | 1.34±0.22a | 9.42±0.24b | 3.04±0.28c | 3.62±0.38d | 0.000* | |
| Δ | 0.22±0.72a | 0.29±0.15a | – 6.07±0.49b | – 5.50±0.32c | 0.001* | |
| p | 0.003* | 0.010* | 0.000* | 0.000* | ||
P: One-way ANOVA if data were normally distributed and Kruskal–Wallis test if not normally distributed
p: Paired t-test if data were normally distributed and Wilcoxon if not normally distributed
*: significant
Pre = before intervention diet, when rats were fed high-fat, high-fructose (HFHFr) diet accompanied by 20% fructose drink for 29 days to induce MetS
Post = after intervention diet, rats were fed standard normal diet in C and HFFD, fresh or boiled N. scutellarius-containing standard diet in FNs and BNs respectively for 29 days
Serum HDL-C in the control and HFFD groups decreased significantly, but that in the FNs and BNs groups increased significantly (p = 0.000). Overall, the FNs and BNs groups showed significant changes in the serum lipid profile by a decrease in TG, TC, and LDL-C, but an increase in HDL-C, whereas the FNs group showed a higher effect than the BNs group.
Discussions
Our results in Table 2 showed that boiling has slightly increased total antioxidant values of N. scutellarius with no changes in the content of total phenolic and flavonoid, and a decrease in the total chlorophyll and carotenes. Boiling is a common cooking method used to prepare ready to eat vegetables, and it can affect their chemical composition. It can either decrease or increase the bioactive content and hence the total antioxidant properties, depending on the method and duration of cooking 25-30.
Induction of metabolic syndrome (MetS) by feeding a high-fat high fructose diet accompanied by fructose drinking water (HFHFr diet) in rats for 29 days can fulfill three out of the five criteria of MetS (hyperglycemia, hypertriglyceridemia, decreased HDL-C, hypertension, and obesity). Obesity in rats measured by Lee Index is the criterion that was not met due to insignificant body weight gain after feeding HFHFr diet for 29 days, while hypertension is not measured. Body weight and Lee Index Scores from groups that were fed with HFHFr diet were not significantly different from control groups. Therefore, although the average values of Lee Index are slightly higher than 300 it cannot be classified as obese. During 29 days of MetS induction, rats from the HFFD, FNs, and BNs groups tended to drink more (20% fructose water), so their food intake decreased. As food intake decreased so does total energy intake and hence no body weight gain. Similar studies found that 20% fructose in drinking water was associated with lower food intake compared with rats that consumed plain water (Khalid et al. 2019) 31. Many other studies employing high fructose or sucrose enriched diet in rats requires 8-16 weeks to produce obese rats 8,32-34. As the duration of our MetS induction is 29 days (approximately 4 weeks), it requires longer duration to induce obesity in rats. However, such shorter period of MetS induction has produced other metabolic syndrome components (fasting glucose-FG, low HDL-C, high TG) being met (Table 4) as an early signs of the syndrome.
After 29 days of intervention with a normal diet in the HFFD group and an N. scutellarius-containing normal standard diet in the FNs and BNs, the body weight of all groups was not significantly different (p<0.05) (Table 4). Lee Index Scores (as a representation of obesity in rats) are similar to body weight trend, they are not significantly different among groups. This is as consequence of Lee Index determination that depends on body weight which is not different for all groups after diet intervention.
Induction of metabolic syndrome (MetS) by feeding HFHFr diet in rats for 29 days increased significantly (p>0.05) fasting blood glucose (FBG) level in the HFFD, FNs, and BNs groups compared to control group (Table 4). After 29 days of intervention diet, the FBG level decreased reaching the same values as the control group (p>0.05), and the difference (D) between before and after the intervention was significant in the HFFD and FNs groups (p<0.05). Our results were similar to Lopez et al. (2019), who found that FBG from the group receiving Moringa oleifera leaf powder (orally by gavage) for 3 weeks decreased but was not significantly different from that of the MetS control group 35. The study also showed that oral glucose tolerance test of the intervention diet with M. olifiera is significantly higher than MetS control, indicating that in spite of no difference in FBG there is an improvement in glucose tolerance 35. Our study indicates the role of N. scutellarius in the normal diet in normalizing FBG level, as 29 days of FNs diet intervention is able to improve FBG level reaching the same values as the control group with standard diet.
Phytochemical compounds that have hypoglycemia effects most probably play a role in this result. N. scutellarius was given as part of a daily normal standard diet that went through the digestive system with various digestive enzyme activities and microbiota can affect their bioactive compounds 36. This possibility warrants further studies. An important note that can be underlined in this study is that intervention with a normal diet or lower energy intake in the HFFD group could reduce the FBG level. Other previous studies showed that reduction in energy intake can reduce FBG in healthy and Type-2 DM. The reduction in FBG by energy intake a reduction is mediated by an improvement of pancreatic beta cells that improving insulin sensitivity, reduction of glucose metabolism hormone i.e. adiponectin and leptin level 37-39.
The decrease in FBG level in the HFFD group also indicated that in addition to reducing calorie intake, the nutritional composition of the food that was ingested could also be influential. During the induction of MetS, the energy source is mostly derived from simple carbohydrates (fructose from drinking water and in the diet) and also comes from fat. After the HFFD group was given a standard normal diet with balanced nutrients composition and no fructose solution, the FBG levels decreased. Therefore, the reduction of calorie intake with a proper macronutrient composition has been proven to be able to control FBG levels.
Induction of MetS by HFHFr diet in this study increased serum TG significantly (Table 4), and diet intervention reduced significantly serum TG in FNs and BNs (p<0.05). In HFFD group, normal diet intervention without N. scutellarius could not decrease serum TG level (p>0.05), suggesting the importance of N. scutellarius component in the diet intervention.
MetS induction for 29 days did not reach the hypercholesterolemic state (Total cholesterol >129,52 mg/dL)40 although LDL-C and TC levels in HFFD, FNs, and BNs groups are significantly higher than the control group (Table 3). A possible factor could be due to the absence of pure cholesterol and cholic acid in HFHFr diet. A study by our group (Sukowati et al., 2018) and many other groups using high-fat high cholesterol diet with cholic acid in the diet for 7 weeks can increase TC and LDL-C up to 219,8 mg/dL and 165.1 mg/d respectively. Many other studies using high-fat high sugar diet in rats require 8-16 weeks to produce dyslipidemia (Wong et al, 2016) 8. These results together indicated that dyslipidemia requires long exposure of high-fat high sugar diet with the presence of exogenous pure cholesterol and the aid of cholic acid in the diet. Results from this study confirmed that 29 days of intake of an N. scutellarius-containing diet can ameliorate the serum lipid profile whereby total energy reduction and antioxidants from N. scutellarius in the intervention diet may play a major role in the lipid profile improvement.
The antioxidant activity of chlorophyll and carotenoids as natural pigments and other phytonutrients in the leaves of N. scutellarius could assist in reducing serum cholesterol levels through pathways such as preventing the absorption of cholesterol in the presence of saponins, improving liver function to reduce blood cholesterol through bile acid formation, binding of fat and cholesterol by phytonutrients such as phytol and eliminating them from the digestive tract via the excretory system 41 and inhibition of the activity of key enzymes of cholesterol synthesis, i.e., the enzyme HMG-CoA reductase 42.
Flavonoid in N. scutellarius improved the lipid profile, possibly by modulating the activity of different enzymes that are involved in lipid metabolism and the expression of transcription factors involved in TG and cholesterol synthesis, such as the sterol regulatory element-binding proteins i.e. SREBP-1 and SREBP-2 43. Flavonoids also inhibit the expression of the fatty acid synthase (FAS) enzymes which is associated with hepatic TG secretion, by stimulating AMPK activity in hepatocyte cells 44. Increased HDL levels could be due flavonoid that induced increased activity of LCAT (lecithin-cholesterol acyl transferase). Increased activity of the LCAT enzyme can lead to an increase in HDL cholesterol 45. Flavonoids also play a role in increasing the production of Apo A1, which acts as an enzyme cofactor for LCAT as well as a ligand for interaction with lipoprotein receptors in HDL tissue. An increase in Apo A1 can lead to elevation of serum HDL-C levels 46.
Inclusion of N. scutellarius in a normal diet can successfully prevent oxidative stress indicated by a significant decrease of serum MDA level (p<0.05) (Table 4). Fresh N. scutellarius inclusion had a greater effect on reducing MDA production than boiled N. scutellarius, as evidenced by the MDA reduction in FNs group was greater than that in the BNs group (p<0.05). This was possibly due to a higher total antioxidant property in fresh than boiled N. scutellarius as shown in Table 2. It is interesting to note that after diet intervention the MDA level of rats in HFFD group is significantly higher than before intervention (p=0.010), and significantly the highest among groups. This suggests the importance of N. scutellarius as a component in the normal diet to reduce serum MDA levels. Dyslipidemia as part of MetS component can trigger a series of a chain reactions from endothelial dysfunction, LDL-C oxidation, vascular inflammation indicated by increase circulating TNFalpha, and foam cell formation that increase reactive oxygen species (ROS) production and lead to cellular oxidative stress 47-51.
A diet containing fresh N. scutellarius is more effective at decreasing body weight, TG, LDL-C, FBG, and MDA levels and increasing HDL-C levels than one containing boiled N. scutellarius. Fresh N. scutellarius gave a greater effect than that prepared by boiling. The reason why a diet containing fresh leaves was more effective was probably due to higher total antioxidative properties from its flavonoid, chlorophyll, and carotene contents that counter oxidative stress. Furthermore, the moisture content (86,81%) of boiled N. scutellarius is higher than that of fresh N. scutellarius; therefore, with the same amount of leaves in the diet (1/3 of the daily normal diet), fresh N. scutellarius leaves contain more antioxidant compounds than boiled N. scutellarius.
Conclusion
N. scutellarius has antioxidant properties due to its phenolic, flavonoid, chlorophyll, and carotenoid contents. Intake of N. scutellarius leaves as part of normal diet (at 33.3% of the daily diet) for 29 days in MetS rats can significantly correct the level of fasting FBG, decrease serum TG, TC, LDL-C, and MDA levels, and increase serum HDL-C. Intake of fresh N. scutellarius leaves as part of the diet was more effective than that of boiled N. scutellarius leaves at improving the serum lipid profile and MDA levels.
Acknowledgements
The author thanks the laboratory assistant at the Animal Laboratory, Faculty of Medicine at Diponegoro University (Semarang, Indonesia) for assisting in blood sampling. We thank you to LPPM (Institute of Research and Community Service) Diponegoro University for Proof Reading Funding of this article.
Conflict of Interest
The authors confirm that there is no conflict of interest.
Consent for Publication
Not applicable.
References
- Expert Panel on Detection, Evaluation, and Treatment of High Blood Cholesterol in Adults: Executive Summary of the Third Report of the National Cholesterol Education Program (NCEP) Expert Panel on Detection, Evaluation, and Treatment of High Blood Cholesterol in Adults (Adult Treatment Panel III). JAMA. 2001;285:2486–2497.
CrossRef - O’Neill S, O’Driscoll L. Metabolic Syndrome: A Closer Look at The Growingepidemic and Its Associated Pathologies. Obesity reviews. 2015;(16):1–12. doi: 10.1111/obr.12229.
CrossRef - Ministry of Health Republic Indonesia. 2013 Basic health research (Riskesdas). [cited 2020 Apr 30]. Available from: http://kesga.kemkes.go.id/images/pedoman/Data%20Riskesdas%202013.pdf.
- Dragsbæk K, Neergaard JS, Laursen JM, Hansen HB, Christiansen C, Nielsen HB, Karsdal MA, Brix S, Henriksen K. Metabolic Syndrome and Subsequent Risk of Type 2 Diabetes and Cardiovascular Disease in Elderly Women Challenging The Current Definition. Medicine. 2016;95:36. doi:10.1097/MD.0000000000004806.
CrossRef - Ziki, MDA, Mani A. Metabolic syndrome : genetic insights into disease pathogenesis. Curr Opin Lipidol. 2016; 27(2): 162–171. doi: https://doi.org/10.1097/MOL.0000000000000276
CrossRef - Alarcon G, Roco J, Medina M, Medina A, Peral M, Jerez S. High fat diet-induced metabolically obese and normal weight rabbit model shows early vascular dysfunction : mechanisms involved. International Journal of Obesity. 2018;42(9):1535-1543. doi: https://doi.org/10.1038/s41366-018-0020-6.
CrossRef - Hidayanti L, Widodo ADW, Hidayat B. Animal Models with Metabolic Syndrome Markers Induced by High Fat Diet and Fructose, Medical Laboratory Technology Journal. 2020;6(1):13-20. DOI: 10.31964/mltj.v1i1.266
CrossRef - Wong SK, Chin KY, Suhaimi FH, Fairus A, Ima-Nirwana S. Animal Models of Metabolic Syndrome: A Review. Nutr Metab (Lond).2016;13:65. doi:10.1186/s12986-016-0123-9.
CrossRef - Shin JY, Kim JY, Kang HT, Han KH, Shim JY. Effect of Fruits and Vegetables on Metabolic Syndrome: A Systematic Review and Meta-Analysis of Randomized Controlled Trials. International Journal of Food Sciences and Nutrition. 2015;66(4): 416–425. doi:10.3109/09637486.2015.1025716.
CrossRef - Tian, Y, Su L, Wang J, Duan X, Jiang X. Fruit and Vegetable Consumption and Risk of The Metabolic Syndrome: A Meta-Analysis. Public Health Nutrition.2017;21(04):756–765. doi:10.1017/s136898001700310x.
CrossRef - Suwimol S, Pimpanit L, Aporn M, Pichita S, Ratiyaporn S, Wiroj J. Impact of Fruit and Vegetables on Oxidative Status and Lipid Profiles in Healthy Individuals. Food and Public Health. 2012; 2(4): 113-118. doi: 10.5923/j.fph.20120204.06.
CrossRef - Nweje-Anyalowu PC, Agatemor Uzuazokaro MM, Adejoh IP, Iserhienrhien Protective Effects Methanolic Extract of Cassia Sieberiana Leaves Against High-Fat Diet-Induced Metabolic Syndrome in Rats. World J. Pharm. Life Sci. 2018;Vol(4):41– 47.
- Sukowati YA, Johan A, Murwani R. Ethanol Extracts of Ficus Carica Fruit and Leaf Normalize High Serum Lipid Profile, TNF-α, and MDA due to High Fat Diet in Sprague Dawley Rat. Curr. Res. Nutr Food Sci Jour. 2019;Vol.7(3):772-782.DOI: 10.12944/CRNFSJ.7.3.16.
CrossRef - López M, Ríos-Silva M., Huerta M., Cárdenas Y, Bricio-Barrios JA, Díaz-Reval MI, Trujillo X. Effects of Moringa Oleifera Leaf Powder on Metabolic Syndrome Induced in Male Wistar Rats: A Preliminary Study. Journal of International Medical Research. 2019; 46(8):3327–3336. doi:10.1177/0300060518781726.
CrossRef - Dias, J C, Imai S. Vegetables Consumption and its Benefits on Diabetes. Journal of Nutritional Therapeutics.2017;6:1-10. doi: 10.6000/1929-5634.2017.06.01.1.
CrossRef - Villegas R, Shu X O, Gao Y T, Yang G, Elasy T, Li H, Zheng W. Vegetable But Not Fruit Consumption Reduces The Risk Of Type 2 Diabetes In Chinese Women. J Nutr. 2008 March ;138(3): 574–580.
CrossRef - Arifin H, Nesia RY, Elisma. Effect of ethanol extract of mangkokan leaves (Nothopanax Scutellarium. Merr) on liver function and urine creatinine levels in male white mice. Jurnal Farmasi Higea. 2011;3(2):74-83.
- Tsiompah G. The effect of cooking vegetables of pecel with addition of peanut sauce to in vitro antioxidant activity and inhibition of lipid peroxidation. Master’s Thesis. Diponegoro University. Semarang. Indonesia. 2019.
- Hatano T, Kagawa H, Yasuhara T, Okuda T. Two new flavonoid and other constituent in licore roots: their relative astringency and radical scaveging effect. Chem Pharm Bull.1998. 36:2090-2097.
CrossRef - Antioxidant activity of extract (Eugena aquae born), (Psidium guajava linn), (Anacardium accidentale linn), and (Lansium domesticum corr). Thesis. Gadjah Mada University. Yogyakarta. Indonesia. 1998.
- Kurniawan M, Izzati M, Nurchayati Y. Chlorophyll, carotenoid, and vitamin c contents in some aquatic plant species. Buletin Anatomi dan Fisiologi Vol. XVIII. March 2010;1:28-40.
- Fernández SM, Rimón MG, Vera G, Astier J, Landrier JF, Miguel M.High Fat/High Glucose Diet Induces Metabolic Syndrome in an Experimental Rat Model, Nutrients .2018; 10:1502. doi:10.3390/nu1010150
CrossRef - Lee S. Kim JW, Lee YK, Yang SH, Lee I, Suh JW, Kim SD. Anti-obesity Effect of Monascus pilosus Mycelial Extract in High Fat Diet Induced Obese Rat. Journal Applied Biomolecular Chemistry.2011; 54:197-205.
CrossRef - Young IS, Trimble ER. Measurement of malondialdehyde in plasma by high performance
- liquid chromatography with fluorimetric detection. Ann CIin Biochem. 1991; 28: 504-508.
CrossRef - Turkmen M, Sari F, Velioglu YS. The effect of cooking methods on total phenolics and antioxidant activity of selected green vegetables. Food Chemistry.2005;93:713-718.
CrossRef - Ferreira O, Pinho SP. Solubility of flavonoids in pure solvents. Ind Eng Chem 2012; 51(18):6586–6590.
CrossRef - Mitic V, Jovanovic VS, Dimitrijevic M, Cvetkovic J, Petrovic G, Stojanovic G. Chemometric analysis of chlorophyll a, and carotenoid content in green leafy vegetables. Biologica Nyssana. 2013;4:49–55.
- Hosain A, Khatun MA, Islam R, Huque R. Enhancement of antioxidant quality of green leafy vegetables upon different cooking method. Prev Nutr Food Sci. 2017;22(3):216-222.
- Paciulli M, Dall’Asta C, Rinaldi M, Pellegrini N, Pugliese A, Chiavaro E. Application and optimisation of air-steam cooking on selected vegetables: impact on physical and antioxidant properties. J Sci Food Agr. 2017;98(6), 2267–2276.
CrossRef
- Gunathilake K, Ranaweera K, Rupasinghe H. Effect of different cooking methods on polyphenols, carotenoids and antioxidant activities of selected edible leaves. Antioxidants. 2018;7(9):117.
CrossRef - Mahmood K, Haleem D, Cheema MAR. Fructose consumption decreases bodyweight gain, reduces anxiety, modulates spatial memory and increases dopamine but not serotonin metabolism. EC Neurology.2019;11(7):551.
- Mamikutty N, Thent ZC, Sapri SR, Sahruddin NN, Mohd Yusof MR, Suhaimi FH. The establishment of metabolic syndrome model by induction of fructose drinking water in male wistar rats. Biomed Res Int. 2014;2014:263897.
CrossRef - Sandeva RV, Mihaylova SM, Sandeva GN, Trifonova KY, Popova-Katsarova RD. Effect of high-fructose solution on body weight, body fat, blood glucose and triglyceride levels in rats. J Biomed Clin Res. 2015; 8(1):5-8.
CrossRef - Ramos VW, Batista LO, Alburqueque KT. Effects of chronic fructose consumption on body weight and adipose tissue. Rev Port Cardiol. 2017;36(12):937-941.
CrossRef - López M, Ríos-Silva M., Huerta M., Cárdenas Y, Bricio-Barrios JA, Díaz-Reval MI, Trujillo X. Effects of Moringa oleifera leaf powder on metabolic syndrome induced in male wistar rats: a preliminary study. J Int Med Res. 2019;46(8): 3327-3336.
CrossRef - Manach C, Scalbert A, Morand C, Rémésy C, Jiménez L. Polyphenols: food sources and bioavailability. Am J Clin Nutr. 2004;79(5):727-747.
CrossRef - Wei S, Zhao J, Bai M, Li C, Zhang L, Chen Y. Comparison of glycemic improvement between intermittent calorie restriction and continuous calorie restriction in diabetic mice. Nutrition & Metabolism. 2019;16:60. Doi: https://doi.org/10.1186/s12986-019-0388-x.
CrossRef - Cho Y, Hong N, Kim KW, Cho SJ, Lee M, Lee YH, Lee YH , Kang ES, Cha BS, Lee BW, The Effectiveness of Intermittent Fasting to Reduce Body Mass Index and Glucose Metabolism: A Systematic Review and Meta-Analysis. J. Clin. Med. 2019;8:1645. doi:10.3390/jcm8101645.
CrossRef - Xu S, Chen G, Chunrui L, Liu C. The Preventive and Therapeutic Effect of Caloric Restriction Therapy on Type 2 Diabetes Mellitus. Intech Open. 2015;(7):185-194. Doi: http://dx.doi.org/10.5772/59281.
CrossRef - Ihedioha J.I., Noel-Uneke O.A. and Ihedioha T.E. Reference values for the serum lipid profile of albino rats (Rattus norvegicus) of varied ages and sexes. Comparative Clinical Pathology.2013; 22 (1): 93 – 99.
CrossRef - Novelina, Anggraini T. The effect of administration green grass jelly cholorophyll (Premna Oblongifolia Merr.) on lipid profile of rats (Rattus norvegicus). Res J Pharm Biol Chem Sci. 2016;7(5):2301-2307.
CrossRef - Alsuhaibani AM, Alkehayez NM, Alshawi AH, Al-Faris NA. Effects of chlorophyll on body functioning and blood glucose levels. Asian J Clin Nutr. 2017;9(2):64-70.
CrossRef - Galleano M, Calabro V, Prince PD, Litterio MC, Piotrkowski B, Vazquez-Prieto MA et al. Flavonoids and metabolic syndrome. Ann NY Acad Sci. 2012;1259:87–94.
CrossRef - Bao L, Hu L, Zhang Y, Wang Y. Hypolipidemic effects of flavonoids extracted from Lomatogonium rotatum. Exp Ther Med. 2016;11:1417-1424.
CrossRef - Fajrin FA. Black glutinous ethanol extract activity to lower cholesterol levels. Jurnal Farmasi Indonesia. 2010;5(2):63-69.
- Murray R, Daryl KG. Biokimia Harper. 25th ed. EGC. Jakarta. 2003: p 239-249.
- Maiolino G, Rossitto G, Caielli P, Bisogni V, Rossi GP, Calò LA. The Role of Oxidized Low-Density Lipoproteins in Atherosclerosis: The Myths and The Facts. Mediators Inflamm. 2013;2013. doi:10.1155/2013/714653.
CrossRef - Bobryshev Y V., Ivanova EA, Chistiakov DA, Nikiforov NG, Orekhov AN. Macrophages and Their Role in Atherosclerosis: Pathophysiology and Transcriptome Analysis. Biomed Res Int. 2016;2016. doi:10.1155/2016/9582430.
CrossRef - Yu XH, Fu YC, Zhang DW, Yin K, Tang CK. Foam cells in atherosclerosis. Clin Chim Acta. 2013;424:245-252. doi:10.1016/j.cca.2013.06.006.
CrossRef - Dushkin MI. Macrophage/Foam Cell Is An Attribute of Inflammation: Mechanisms of Formation and Functional Role. Biochem. 2012;77(4):327-338. doi:10.1134/S0006297912040025.
CrossRef - Dessì M, Noce A, Bertucci P, et al. Atherosclerosis, Dyslipidemia, And Inflammation: The Significant Role Of Polyunsaturated Fatty Acids. ISRN Inflamm. 2013;2013. doi:10.1155/2013/191823.
CrossRef

This work is licensed under a Creative Commons Attribution 4.0 International License.


