Proportion and Associated Factors of Vitamin B12 Deficiency – A Retrospective Laboratory-Based Study
Sowndarya K1
, Ramya Shenoy3, Anupama Hegde1* 1Department of Biochemistry, Kasturba Medical College, Mangalore, Manipal Academy of Higher Education, Manipal, Karnataka, India.
2Department of Pathology, Kasturba Medical College, Mangalore, Manipal Academy of Higher Education, Manipal, Karnataka, India.
3Department of Public Health Dentistry, Manipal College of Dental Sciences, Mangalore, Manipal Academy of Higher Education, Manipal, Karnataka, India.
Corresponding Author Email: anupama.hegde@manipal.edu
DOI : http://dx.doi.org/10.12944/CRNFSJ.7.3.07
Download this article as:
![]()
Vitamin B12 is a vital micronutrient involved in the hemopoetic, neurologic and cardio-metabolic function. Various factors are responsible for B12 deficiency, which can lead to anemia and irreversible neurological manifestations. The proportion of deficiency is not well known and hence studied in the hospital setup. The associated factors of B12 deficiency were also deduced in different age groups. Laboratory data of the past two years on vitamin B12 (B12), folate and red blood cell (RBC) indices were compiled. Based on B12 values, subjects were grouped as deficient, subclinical deficiency and normal. RBC indices especially, Mean corpuscular volume (MCV) was compared among all three groups. The deficient group was further categorized based on age to know the associated factors as per the diagnosis or medical impression recorded. The frequency of B12 and folic acid deficiency was found to be 28% and 18.8% respectively. The deficiency was more frequently detected in the younger age group (18-30years) with inadequate nutrition, pregnancy and vegetarian diet being the most frequently associated factors. Hyperthyroidism was an add-on in the mid-age group. In subjects aged 51-70 years, disorders of intestine, gastric surgery, cancer and pernicious anemia were the attributing factors. MCV > 100fL was found only in 4.8% of the B12 deficient population. Only 28% of B12 deficiency could be conclusively detected. Pregnancy and nutritional status were the most commonly associated factors of B12 deficiency. The use of MCV for the detection of B12 deficiency did not seem reliable.
KEYWORDS:Folic Acid; MCV; Proportion; Vitamin B12
Introduction
Vitamin B12 (B12) is a water-soluble vitamin that belongs to the set of “corrinoids” which contains a corrin macrocycle in the structure.1,2 B12 acts as a cofactor in one-carbon metabolism through methylation and molecular rearrangement.3 It is a vital micronutrient essential for the optimum hemopoetic, neurologic and cardio-metabolic function.4, 5 Deficiency of B12 and folic acid lead to anemia.6 It is recognized as the only vitamin that is absent in the food sources derived from plants. 7 B12 is produced by specific type of bacteria, and it is predominantly concentrated in the bodies of predators located in the higher level of food chain.8 The availability of B12 in healthy humans from fish, sheep meat and chicken meat are averaged 42%, 56%–89%, and 61%–66%, respectively.8
The deficiency of B12 is common and the frequency increases with age. The vegetarian diet, blood diseases, food-bound cobalamin malabsorption, poor nutrition and usage of some drugs are the other contributing factors for the deficiency of B12. 9, 10 The B12 deficiency can cause the elevation in the homocysteine level in plasma. Increased levels of homocysteine can render humans susceptible to cardiovascular disease.11
Folic acid is the synthetic form of folate. It is essential for the synthesis, methylation and repair of DNA.12 Folate plays a considerable role in the development of foetus, and supplementation of folic acid in pregnancy is extensively known to reduce the risk of neural tube defects, other neurological disorders, preterm delivery and low birth weight.13
Megaloblastic anemia/macrocytic anemia, is regarded as a reduced number of RBCs and presence of remarkably large, poorly developed and abnormal erythrocytes (megaloblasts), which fail to enter blood circulation due to their larger size. Deficiency of B12 and/or folate with higher levels of homocysteine is the main factor responsible for megaloblastic anemia.14 Elevated levels of MCV is considered as a very sensitive hematological indicator of B12 and folate deficiency and also used in the evaluation of subclinical B12 deficiency.15
Our population comprises of strictly vegetarian and mixed diet followers. The laboratory-based study was conducted to know the proportion of B12 deficiency based on lab parameters and understand the age-wise distribution of the deficiency with factors associated.
Materials and Methods
The present retrospective cross-sectional laboratory-based data collection study was conducted in the Department of Biochemistry and Pathology and the affiliated teaching hospitals of a tertiary care hospital of South-West Coastal India. The study was approved by the institutional ethics committee (IEC KMC MLR 07-18/149). Laboratory data of B12 was collected retrospectively from April 2016-April 2018. Men and women belonging to the age group of 18-70 years with the laboratory tests for serum B12 and/or folic acid levels along with complete blood count (CBC) were included in this study. Criteria for exclusion were inadequate hematological investigations, diabetics on metformin, those patients on oral contraceptive pills and anticonvulsant therapy based on their medical records.
B12 and folic acid levels were estimated by Electro chemiluminescence assay (ECLIA) (Cobas e 601, Roche diagnostics).Hematology parameters such as Hemoglobin, White blood cells (WBC), Platelet count (Plt), mean corpuscular volume(MCV), mean corpuscular hemoglobin (MCH), mean corpuscular hemoglobin concentration (MCHC) were done on the hematology analyzer (DXH 800;Beckman Coulter).
A total of 2661 subjects were tested for serum B12 during the said period. Based on the age and B12 cut off values, 1638 samples selected were further grouped as deficient (n=455) and as normal (n=1183). Due to the absence of required laboratory data, 269 subjects had to be excluded from the former, hence only 186 subjects constituted the B12 deficient group (≤ 200 pg/ml; Group I). Similarly, 711 subjects had to be excluded due to the absence the required laboratory data from the latter, leaving us with 473 subjects who were further grouped as the subclinical deficiency group (201-250 pg/ml; Group II)(n=88) and normal group (251-600 pg/ml; Group III)(n=385) (Fig 1).
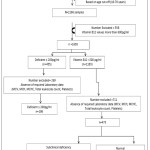 |
Figure 1: Flow chart representing the division of the groups based on the vitamin B12 values Click here to View figure |
Statistical analysis was carried out using SPSS 11.5 version (SPSS Inc, Chicago IL). Descriptive statistics of different parameters according to age were tabulated. Statistical significance was measured by repeated measures of ANOVA and Tukey HSD and Linear regression. Variables were selected from those which showed a significant difference at 95% level (p<0.05).
The proportion of B12 deficiency detected was 28% (Fig 1) out of which 18.8% (n=35) had co-existing folic acid deficiency. Folic acid and red blood cell indices were compared between the three groups. (Table 1)
Results
Table 1: Comparison of various parameters among Vitamin B12 groups
| Parameters | Group I(n=186) | Group II(n=88) | Group III(n=385) |
| Folic acid(ng/ml) | 3.7 (3.07, 5.08)*(n = 52) | 13 (6.2, 14.87)(n =19) | 10.8 (3.97, 18)(n =62) |
| Hemoglobin(g/dl) | 12.8±2.294 | 12.8±2.288 | 13.40±2.44 |
| MCV(fl) | 85.54±10.01 | 81.50±11.92* | 83.83±10.28 |
| MCH(pg) | 28.24±3.57 | 27.01±3.66 | 28.30±3.73 |
| MCHC(g/dl) | 32.84±1.05 | 32.703±1.451 | 32.85±1.83 |
| WBC(Cells/Cumm) | 7177.41±2142.9 | 7485.2±2396.33 | 7373.50±1977.97 |
| Plt(Cells/Cumm) | 275646.23±87734.95 | 284193.18±98698.75 | 258510.90±157217.27 |
*p< 0.05 statistically significant on comparison vs Group III;
n= number of subjects; B12 values in Group I = Upto 200pg/ml; Group II = 201-250pg/ml; Group III = 251- 600pg/ml; MCV- Mean corpuscular volume; MCH – Mean corpuscular hemoglobin; MCHC – Mean corpuscular hemoglobin concentration; WBC- white blood cells; Plt- Platelets; fL- femtoliter; pg- picograms;
Data on folic acid was meager as it was not estimated parallel to B12. On comparison of the available values, a significant decrease in folic acid was found in Group I. Group II and Group III values ranged from deficient to sufficient levels, but the median folic acid values were within the normal range. Mean MCV values were found to be significantly decreased in Group II. All other blood indices were compared between the three groups.
Group I subjects with B12 deficiency (n=186) were categorized into different age groups and factors found associated were noted based on the data available in the medical records.
Table 2: Group I subjects segregated as per age range (n=186)
| Age range (years) | Associated factors |
| 18-30(n=87) | Inadequate diet (n=18), Pregnancy(n=15), Vegetarian diet(n=22), Fish tapeworm infestation(n=3)cause not known as the data was unavailable(n=29) |
| 31-50(n=64) | Pregnancy(n=9), Vegetarian diet(n=11), Hyperthyroidism(n=8)cause not known as the data was unavailable(n=36) |
| 51-70(n=35) | Gastro-intestinal diseases(n=5), Gastrectomy (n=2), Pernicious anemia (n=7), Disseminated cancer(n=6), Ileitis(n=1), Vegetarian diet(n=6), Long term intake of antacid(n=2)Cause not known as the data was unavailable (n=6) |
n= number of subjects;
MCV>100 fL is used in the detection of vitamin B12 deficiency state. In the deficient Group I (n=186) only 4.8% (n=9) had MCV >100 fL which was indicative of megaloblastic anemia with macrocytosis. (Table 3). In Group I subjects with normal MCV of 80-100 fL(n=148) folic acid levels were estimated only in 19 subjects and were found to be deficient. Peripheral smear reports were available only in 88 subjects detecting microcytic hypochromic blood picture. Furthermore, with MCV <80 fL (n=29), few had associated folic acid deficiency (n=12) and some had peripheral smear reports of dimorphic blood picture (n=8).
In subclinical B12 deficiency (Group II), 22.72% individuals had MCV less than 80 fL, 76.13% had normal MCV and 1.13% had increased MCV which was due to hemolytic anemia as per the medical records. Among group III subjects, 79.22% had normal MCV, 18.44% had MCV <80 fL, and 2.33% had MCV more than 100fL for which the associated factor was not ascertained.
Table 3: MCV variations within the groups
| MCV (fL) | Group I(n=186) | Group II(n=88) | Group III(n=385) |
| <80 | 75.4±10.55(n=29) | 69.74±8.24(n=20) | 70.57±12.61(n=71) |
| 80-100 | 83.1±4.30(n=148) | 85.6±3.29(n=67) | 86.47±3.62(n=305) |
| >100 | 111.5±7.24(n=9) | 114.9(n=1) | 106.83±6.64(n=9) |
n= number of subjects; B12 values in Group I = Upto 200pg/ml; Group II = 201-250pg/ml; Group III = 251- 600pg/ml; fL = femtolitre; MCV normal reference range 80-100fL.
Table 4: Linear logistic regression analysis with Vitamin B12 as dependant factor to other associated factors
|
Items |
Unstandardized Coefficients | Standardized Coefficients | t | Sig. | ||
| B | Std. Error | Beta | ||||
| (Constant) | 5.268 | 3.872 | 1.360 | .176 | ||
| Gender | -.094 | .173 | -.051 | -.543 | .588 | |
| Age | -.001 | .006 | -.009 | -.096 | .924 | |
| Folic acid | .060 | .012 | .440 | 5.083 | .000* | |
| Hb | -.050 | .033 | -.156 | -1.490 | .139 | |
| MCV | -.046 | .056 | -.490 | -.814 | .417 | |
| MCH | .136 | .170 | .588 | .799 | .426 | |
| MCHC | -.087 | .130 | -.150 | -.670 | .504 | |
| WBC | –006 | .000 | -.012 | -.127 | .899 | |
| Platelets | -008 | .000 | .004 | .043 | .966 | |
*p< 0.05 depicting an association between B12 and Folic acid; Hb- Hemoglobin; MCV- Mean corpuscular volume; MCH – Mean corpuscular hemoglobin; MCHC – Mean corpuscular hemoglobin concentration; WBC- white blood cells;
Linear logistic regression analysis with B12 as the dependent factor and all other parameters as independent factors was done. B12 showed a statistically significant association with folic acid in the presence of all the above independent factors.
Discussion
Current laboratory data analysis studied the occurrence of B12 deficiency and the age-wise distribution of the same. The reasons for B12 deficiency were multi-factorial, differing in different age groups. Taking into consideration the inclusion and exclusion criteria, the proportion of B12 deficiency detected was 28% out of which 18.8% (n=35) had co-existing folic acid deficiency. In the deficient group, 46% belonged to 18-30 years, 34% belonged to 31-50 years and 18.8% were older adults.
A study conducted in South India stated that the overall frequency of B12 deficiency (36%) was higher when compared to that of folate deficiency (8.2%) in the elderly population.16In the current study, 35 subjects (18.8%) were older adults (51-70 years) in the deficient group. This data is not generalizable as the true prevalence of the disease in elderly, as it is a laboratory-based study. As per earlier studies, B12 deficiency in the elderly is triggered by the loss of parietal cells, disorders of intestine, gastric surgery and excessive use of medications all of which can autonomously disrupt the B12 absorption mediated by the intrinsic factor.17 Presently, the associated factors established were similar to the ones mentioned above (Table 2).
Metabolic deficiency of vitamin B12 is most common in vegetarians and mainly, in vegans since they consume only vegetables, fruits, nuts and grains18 Demand for B12 also increases during the pregnancy and lactation.19, 20 Pregnancy, vegetarian diet, fish tape worm infestation and hyperthyroidism were found to be the recorded causes of deficiency in the younger age group of the current study (Table 2).
Stored B12 in the liver is assumed to compensate for deficiency lasting up to a few years.21 Hence the deficiency signs and symptoms may manifest a decade later.22,23 Neurological manifestations like demyelination followed by axonal degeneration and ultimately irreparable damage due to the axonal death are observed only when the B12 stored in the liver gets depleted completely.22 Studies state that, MCV more than 99 fL is evidence of B12 deficiency which precedes the development of anemia and neurological manifestations.24 It is the first parameter to alter in B12 deficiency25 and high MCV is employed as a cue for the detection of the same.
Further evaluation of this index was done in all the three groups (Table 3). Only 4.8% of the deficient subjects presented with MCV >100fL. Despite having low B12, less than normal MCV with a microcytic hypochromic blood picture was found. Co-existing folic acid deficiency was found in 18.8% (n=35) of the B12 deficient group. Some of the subjects had MCV values less than 100fL with both B12 and folate deficiency. Misleading RBC indices in these patients may be due to the presence of co-existing iron-deficiency anemia. The findings of the peripheral smear (available in few of the subjects) are proof enough for this.
Thus, in our population, isolated B12 and folic acid deficiency may be a rarity. Overall nutritional status of the population in general and repeated pregnancies can lead to iron-deficiency anemia that can mask the co-existing B12 deficiency status. Further, methylmalonic acid and homocysteine levels in the serum have been implicated as the early markers of vitamin B12 deficiency. 26 Though these markers could be useful when there is overt deficiency with co-existing iron deficiency or in subclinical B12 deficiency, their estimation is a laborious process, expensive and not a routine.27/ Biochemical and haematological tests including iron profile are mandatory to detect & differentiate isolated B12 deficiency.
Lack of laboratory data led to the exclusion of a considerable number of samples (n=269) with low vitamin B12 values, which may have resulted in different prevalence rates altogether.
Conclusion
Investigations for B12 levels were mainly targeted towards the younger population. Inadequate nutrition, pregnancy and vegetarian diet were the main associated factors recorded. Also, superimposed iron deficiency masked B12 and folic acid deficiency status. Relying on MCV index solely, may lead to failure in detection and diagnosis of these vitamin deficiency disorders.
Acknowledgements
We express our gratitude to the patients and authorities of the Institution and the associated hospitals for permitting us to undertake this research project.
Funding
Self-funded
Conflict of Interest
None declared
References
- Thomas-Valdés S, Tostes MDGV, Anunciação PC, da Silva BP, Sant’ Ana HMP. Association between vitamin deficiency and metabolic disorders related to obesity. Crit Rev Food Sci Nutr. 2017;57(15):3332-43.
- Bito T, Watanabe F, Miyamoto E. Vitamin B12-containing plant food sources for vegetarians.Nutrients. 2014;6(5):1861–73.
- Rizzo G, Laganà A S, Rapisarda A M, La Ferrera G M, Buscema M, Rossetti P. Vitamin B12 among Vegetarians: Status, Assessment and Supplementation. Nutrients. 2016 Nov 29;8(12). pii: E767.
- Carmel R. Biomarkers of cobalamin (vitamin B-12) status in the epidemiologic setting: A critical overview of context, applications, and performance characteristics of cobalamin, methylmalonic acid, and holotranscobalamin II. Am J Clin Nutr. 201;94(1):348S–58S.
- Elmadfa, S. Vitamin B-12 and homocysteine status among vegetarians: A global perspective. Am J Clin Nutr. 2009;89(5):1693S–98S.
- Mehta BC, Kabeer RM, Patel Y. Prevalence of hematinics deficiency amongst female students and its correction. Indian J Hematol Blood Transfus. 2007;23(3-4):88–91.
- Verma D, Chandra J, Kumar P, Shukla S, Sengupta S. Efficacy of oral methylcobalamin in treatment of vitamin B12 deficiency anemia in children. Pediatr Blood Cancer. 2017;64 (12):e26698.
- Watanabe F. Vitamin B12 sources and bioavailability. Exp Biol Med. 2007; 232(10):1266-74.
- Wang H, Li L, Qin L L, Song Y, Vidal-Alaball J, Liu TH.Oral vitamin B12 versus intramuscular vitamin B12 for vitamin B12 deficiency. Cochrane Database Syst Rev. 2018; 15;3:CD004655.
- Shipton M J, Thachil J.Vitamin B12 deficiency – A 21st century perspective. Clin Med (Lond). 2015 Apr;15 (2):145-50.
- Obersby D, Chappell D, Dunnett A, Tsiami A. Efficacy of Methycobalamin to Normalise Elevated Homocysteine of Vitamin B12 Deficient Vegetarians: A Double Blind Placebo Control Study. Curr Res Nutr Food Sci.2015:3(3).
- Wagner C. Biochemical role of folate in cellular metabolism. Clin Res Regul Aff. 2001;18(3):161–80.
- Mortensen JH, Øyen N, Nilsen RM, Fomina T, Tretli S, Bjørge T. Paternal characteristics associated with maternal periconceptional use of folic acid supplementation. BMC Pregnancy and Childbirth.2018;18:188.
- Manish KY, Nandini MM, SubbaRao VM. Comparative assessment of vitamin-B12, folic acid and homocysteine levels in relation to p53 expression in megaloblastic anemia. PLoS One. 2016;11(10): e0164559
- Rajalakshmi BR, Patel S, Kulkarni P. Discriminant functions in the diagnosis of vitamin B12 deficiency anemia, the value of RDW-SD: An analytical study. NJLM. 2017;6(1):1-6.
- Vadakattu SS, Ponday LR, Nimmathota A, Nagalla B, Kondru DS, Undrajavarapu P et al. Prevalence of Nutritional Anemia and Hyperhomocysteinemia in Urban Elderly. Ind J Clin Biochem. 2018;33(1):1-6.
- Stover PJ. Vitamin B12 and older adults. Curr Opin Clin Nutr Metab Care. 2010;13(1):24–27.
- Woo KS, Kwok TCY, Celermajer DS. Vegan diet, subnormal vitamin B-12 status and cardiovascular health. Nutrients. 2014;6(8):3259-73.
- Lachner C, Steinle NI, Regenold WT. The neuropsychiatry of vitamin B12 deficiency in elderly patients. J Neuropsychiatry Clin Neurosci. 2012;24(1):5-15.
- Singal N, Setia G, Taneja B, Singal K. Factors associated with maternal anaemia among pregnant women in rural India.Bangladesh Journal of Medical Science. 2018;17(4):583-92.
- Corbetta F, Tremolizzo L, Conti E, Ferrarese C, Neri F, Bomba M et al. Paradoxical increase of plasma vitamin B12 and folates with disease severity in anorexia nervosa. Int J Eat Disord. 2015;48(3):317-22.
- Wang YH, Yan F, Zhang WB, Gang YE, Zheng YY, Zhang XH et al An investigation of vitamin B12 deficiency in elderly inpatients in neurology department. Neurosci Bull. 2009;25(4):209-15.
- Langan RC, Goodbred AJ. Vitamin B12 Deficiency: Recognition and Management. Am Fam Physician. 2017;96(6):384-89.
- Berg RL, Shaw GR. Laboratory evaluation for Vitamin B12 deficiency: The case for cascade testing. Clinical Medicine & Research.2013;11(1):7-15.
- Veda P. Evaluation of macrocytosis in routine hemograms. Indian J Hematol Blood Transfus.2013;29(1):26–30.
- Vashi P, Edwin P, Popiel B, Lammersfeld C, Gupta D. Methylmalonic acid and homocysteine as indicators of Vitamin B-12 deficiency in cancer. PLoS One. 2016;11(1):1-13.
- Mc Mullin MF, Young PB, Bailie KE, Savage GA, Lappin TR, White R. Homocysteine and methylmalonic acid as indicators of folate and vitamin B12 deficiency in pregnancy. Clin Lab Haematol. 2001;23(3):161-65.
Accepted on: 05/12/2019
Second Review by: Dr. Periyasamy, Palsamy United States
Final Approval by: Prof. Jiwan S. Sidhu


Web of Science Coverage
Emerging Sources Citation Index (ESCI)
2024 Journal Impact Factor: 1.1
Scopus Journal Metrics
CiteScore 2025: 2.6
CiteScore Details
Sustainable Nutrition: Food Systems, Nutrient Retention, and Public Health Impact
![]()
This journal is a member of, and subscribes to the principles of, the Committee on Publication Ethics (COPE)


