Stability of Fried Fish Crackers as Influenced by Packaging material and Storage Temperatures
Wan Zunairah Wan Ibadullah2*
, Nor Afizah Mustapha1, Nazamid Saari2, Nur Hanani Zainal Abedin1 1Department of Food Technology, Faculty of Food Science and Technology, University Putra Malaysia, UPM Serdang Selangor, Malaysia.
2Department of Food Science, Faculty of Food Science and Technology, University Putra Malaysia, UPM Serdang Selangor, Malaysia.
Corresponding Author Email: wanzunairah@upm.edu.my
DOI : http://dx.doi.org/10.12944/CRNFSJ.7.2.07
Download this article as:
![]()
The objective of the study was to determine the stability of fried fish crackers during storage at different temperatures. The physicochemical properties and lipid stability were examined at 25, 40 and 60°C for three months. Fried fish crackers were packed into two types of packaging with four different layers; (i) polyethylene terephthalate-polyethylene-aluminium-linear low density polyethylene (PET-PE-ALU-LLDPE), and (ii) oriented polypropylene-polyethylene-metallized polyethylene terephthalate-linear low density polyethylene (OPP-PE-MPET-LLDPE). The linear expansion and oil absorption in control fried fish cracker was 75.67 ± 5.86% and 27.86 ± 0.79%, respectively. The initial moisture of cracker ranged from 4.41 to 5.40% and decreased to 2.76 to 3.75%. There were also reductions in water activity of crackers from 0.503 to 0.243. For color, the loss occurred gradually within the storage time from 64 to 47% (L*), from 27 to 19% (b*), and increased from 4 to 9% (a*) due to lipid degradation. For both packaging, the hardness of crackers decreased significantly at 25°C and 40°C, but increased at 60°C. Regardless of temperatures and types of packaging, crispiness increased significantly throughout the storage. This textural changes were possible cause by a decrease in moisture content. The lipid yield of the cracker was not stable within the storage time and the concentration of conjugated dienes and thiobarbituric acid reactive substances (TBARS) showed a gradual increase. These results showed that fried fish crackers in the storage study had undergone lipid oxidation where changes in physical and chemical properties were observed.
KEYWORDS:Conjugated Diene; Fried Fish Crackers; Lipid Degradation; Physico-Chemical Analyses; Thiobarbituric Acid Reactive Substances
Introduction
Many manufactured snacks are low in protein, vitamins and other nutrients but high in calories and fat.1,2 Snack products that usually consist of most carbohydrate and fat can be formulated with higher protein content and nutritional value by incorporating high-quality protein sources such as fish, pork, beef and chicken as well as legumes (peanut and soybean).2 Fish has been known to serve as an excellent alternative to meat due to its low cholesterol, high protein, high digestibility, and high polyunsaturated fatty acids such as omega-33 as well as essential amino acids.4 To increase the uptake of fish, fish crackers are a suitable alternative to other snacks.5 Therefore, development of fish crackers with high nutritional value of sensory-satisfactory are a suitable strategy to replace less nutritious ready-to-eat foods.6
Usually, marine fish is used rather than freshwater fish in producing fish crackers.7 Both the pelagic and demersal fish can be utilized to manufacture fish crackers. However, the nutritional composition on these fish categories varies in term of protein and lipid contents that will influence the quality of the crackers.8 The round scad fish (Decapterus ruselli) in the Carangidae family is categorized as marine pelagic finfishes, comprises approximately 46% of edible portion; and contains 74.7% moisture, 22.3% crude protein, 2.4% fat and 1.5% ash.9 Fried fish crackers are produced by mixing fish, starch, salt, sugar, monosodium glutamate, monosodium bicarbonate and water to form dough, which is then molded into required shape, boiled, thinly sliced and dried. During deep-frying, fish crackers are enlarged into a low-density and porous product.10 Normally, fish crackers made with more flour than fish meat, but fish meat can be incorporated from 30 to 50% of the total ingredients weight. The options for fish meat in fish crackers depend on the fish type, quality, and quantity.11
Quality of fried food, particularly odor and taste, are negatively affected by many oxidized compounds formed in the process of frying.12 During frying, moisture migrates from the internal cells of food and oil will slightly substitute the evaporated water.13 Furthermore, the thermal and oxidative reactions take place in oil will cause oxidative stability that affects the deterioration of deep fried food during storage.14,15 During processing and storage of fried foods, lipid oxidation is one of the major deteriorating reactions, which is further enhanced by low water activity. This consequently leads to the development of various off flavors which causes the food to be less acceptable.16 It can also be recognized by oily ‘rancid’ off-flavors and odors or painty characteristic. It also alters the physical properties, degrades the molecular functionality and potentially forms toxic compounds.17
Among important characteristics of food food packaging are flexibility/rigidity factor and barrier against gas, water vapor, light or flovor.18 In most fried snacks, it is important to supply a light barrier than either oxygen or moisture barrier because the UV radiation will cause rancidity faster than the dark exposure of the snacks to oxygen.19 The food packaging industry will formulate multilayer films by lamination or co-extrusion of different polymers. The combination of different polymers will produce a film with a unique chemical, physical and mechanical characteristic.20, 21 Minimizing sunlight and UV radiations effects, aluminum was suggested to be a good option as food packaging.22
Nowadays, usage of plastics as packaging material amounts to 30% from other materials. For example, polypropylene (PP) film has been used to replace glassine paper for potato crisps. Exposures of fatty foods to light is critical because it will accelerate the oxidation process and the rate of rancidity. The shelf life of potato crisps will become longer if a metallized film is incorporated with a light barrier packaging.23 PP film is usually biaxially oriented (BOPP) and this has become the material of choice for snacks, biscuits, cakes, and confectionery products, due to its high strength and adequate barrier properties, even at very low gauges.24
Previous study by Neiva et al.,6 showed that the physicochemical and mirobiological characteristics of dried, non-expanded fish crackers were not affected after 180 days of storage. Sensory wise, microwaved fish crackers with lower fat and contained long- chain omega-3 fatty acids, were preferred over fried fish crackers. Therefore, the present work was aimed to determine fried fish crackers’ shelf life stability during the storage period of 90 days at 25, 40 and 60°C by analyzing their physico-chemical properties. Besides, the effect of packaging materials on lipid oxidation was also examined.
Materials
Fresh round scad fish (Decapterus ruselli) was purchased from Pasar Borong Selangor, Malaysia. Tapioca starch, sago starch, salt, sugar, monosodium glutamate, sodium bicarbonate and palm oil were obtained from a local shop. The analytical-grade chloroform and isooctane were purchased from Fisher (USA). The analytical-grade methanol was purchased from Merck (Germany) and TBARS kits were purchased from Cell Biolabs (USA).
Methods
Preparation of crackers
The preparation of fried fish crackers was performed following the recipes of Department of Fisheries, Malaysia, with a slight modification. First, fish meat, tapioca and sago flour, salt, sugar, monosodium glutamate, sodium bicarbonate and iced water were mixed thoroughly using a mixer until a dough was formed. Next, the dough was molded into cuboid portions »2.5 cm and boiled for 30 min at 100°C. Then, the boiled dough was drained and chilled overnight (4°C), thinly sliced (»2 mm) and dried in a cabinet dryer at 40°C for 2 h (Richentek, China). Next, the dried slices were deep fried in palm cooking oil at 180-200°C for 30 sec using an electric fryer (Cornell Deep Fryer, Malaysia).
Determination of linear expansion
The linear expansion of fried fish crackers was obtained following deep frying.25
Determination of oil absorption
The oil absorption of fried fish crackers was measured according to the method proposed by Mohamed et al.,26
The effect of storage temperatures and periods
Fried fish crackers were packed into the commercially obtained PET(Polyester film)-PE(Polyethylene)-ALU(Aluminium foil)-LLDPE(Linear low density polyethylene) and OPP(Orientated polypropylene)-PE(Polyethylene)-MPET(Metallisation polyethylene)-LLDPE(Linear low density polyethylene) packaging each weighing »18 g. Samples were then separately incubated at 25, 40 and 60°C (Shel Lab, USA). Samples were removed for analyses at 1, 2, 3, 4, 6, 8, 10 and 12 weeks intervals.
Determination of moisture content
The moisture content of fried fish crackers was determined using oven-drying method AOAC.27
Determination of water activity
The water activity of fried fish crackers was determined using the Water Activity Analyzer (AquaLab, USA).
Determination of color
The color (lightness, redness and yellowness; L*, a*, and b*) of fried fish crackers was measured using Ultra Scan PRO (Hunter Lab, Japan).
Determination of hardness and crispiness
Using the penetration test, the hardness (kg) and crispness (kg.sec) of fried fish crackers were measured by Texture Analyzer (TA-XT2 Stable Micro System, UK) . The conditions of the texture analyzer were as follows: pre-test speed = 1.0 mm/sec; post-test speed = 5.0 mm/sec; test speed = 2.0 mm/sec; distance = strain, 100%; time = 5.0 sec; trigger type = auto; trigger force = 10 g. For each sample, the measurements were repeated nine times and their average was taken. The fish crackers were put above a support rig and penetrated using P/5S stainless steel ball probe (5 mm diameter). This rig was used to measure the fracturability by means of a penetration test.
Extraction of lipids
The extraction of lipid in fried fish crackers was performed using method described by Wan Ibadullah28 with slight modifications. Fried fish crackers were mixed with chloroform-methanol (2:1) in 1:5 (w/v) ratio, flushed with argon, left for 30 min, then centrifuged at 10,000 rpm for 15 min at 4°C. The supernatant was collected, the extraction was repeated, and the two extracts were pooled. The meal of fried fish crackers was dried for 2-3 h at room temperature and used for protein analyses. Following extraction, the supernatant was evaporated at 40°C using a rotary evaporator, and the extracted lipid of fried fish crackers was weighed to determine the lipid recovery based on initial sample weight. Dried lipid extracts were flushed with argon, sealed, and stored at -18°C for further analyses.
Determination of conjugated dienes
The conjugated dienes in the lipid extracts of fried fish crackers were determined by a modified AOCS standard method Th 1a-64. Firstly, 30 μl oil was diluted in 10 mL iso-octane. Absorbance at 234 nm was measured against iso-octane blank using quartz cells. Concentrations of conjugated dienes (mM) were calculated using the Beer‘s Law as follows with a molar extinction coefficient of 29500 for iso-octane:
A = εbc, (Equation 3)
Where, A is the absorbance value; b is the thickness of cuvette (1 cm); ε is 2950 M-1cm-1; and c is concentration (mM).
Determination of thiobarbituric acid reactive substances
OxiSelect™ TBARS Assay Kit (MDA Quantitation) was used for the determination of TBARS and prepared according to manufacturer’s instruction. Firstly, 100 μL unknown samples or MDA standards was placed into separate microcentrifuge tubes prior to addition of SDS Lysis Solution (100 μL). The solutions were mixed thoroughly; then incubated for 5 min at room temperature. Next, samples and standard were mixed with TBA Reagent (250 μL), incubated at 95°C for 45-60 min and cooled at room temperature in an ice bath for 5 min. Then, the tubes were centrifuged at 3000 rpm for 15 min. The supernatant was removed for further analysis. An amount of 200 μL of the MDA standards and samples were transferred to a 96 well microplate compatible with a spectrophotometric plate reader. The absorbance was measured at 532 nm.
Statistical analysis
Statistical analyses were performed using Minitab statistical software (Minitab 16, Minitab Inc, Pennsylvania, USA). The analysis of variance (ANOVA) was performed to compare the means of data. All determinations were done in duplicate and presented as average. Tukey Test was applied to compare the average mean values. The confidence limits used in the present study were based on a level of 95% (p < 0.05).
Results
Table 1: Moisture content (%) between packaging A (PET-PE-ALU-LLDPE) and packaging B (OPP-PE-MPET-LLDPE) over 12 weeks of storage at three different temperatures 25, 40 and 60°C
| Weeks | 1 | 2 | 3 | 4 | 6 | 8 | 10 | 12 |
| Packaging A | ||||||||
| 25°C | 4.66 ± 0.12Aa | 4.43 ± 0.15ABa | 4.35 ± 0.09ABCab | 4.19 ± 0.07BCDb | 3.95 ± 0.02CDb | 3.97 ± 0.03CDa | 3.84 ± 0.11Da | 3.38 ± 0.05Eb |
| 40°C | 4.84 ± 0.09Aa | 4.73 ± 0.08ABa | 4.77 ± 0.11ABa | 4.39 ± 0.03BCa | 4.11 ± 0.01CDa | 4.02 ± 0.03CDa | 3.77 ± 0.18Da | 3.75 ± 0.08Da |
| 60°C | 4.41 ± 0.12Aa | 4.38 ± 0.11Aa | 4.11 ± 0.09ABb | 4.07 ± 0.01ABb | 3.96 ± 0.05BCb | 3.63 ± 0.12CDb | 3.30 ± 0.06Da | 2.76 ± 0.04Ec |
| Packaging B | ||||||||
| 25°C | 5.40 ± 0.11Aa | 4.93 ± 0.09Ba | 4.89 ± 0.02Ba | 4.47 ± 0.01Ca | 4.13 ± 0.02CDa | 4.12 ± 0.07CDa | 3.85 ± 0.17Da | 3.75 ± 0.04Da |
| 40°C | 5.19 ± 0.05Aab | 4.78 ± 0.06Ba | 4.35 ± 0.04Cb | 4.14 ± 0.05Cb | 4.28 ± 0.08Ca | 3.78 ± 0.02Db | 3.62 ± 0.06Da | 3.54 ± 0.09Da |
| 60°C | 4.97 ± 0.08Ab | 4.33 ± 0.02Bb | 4.11 ± 0.11Bb | 3.68 ± 0.06CDc | 3.71 ± 0.01Cb | 3.42 ± 0.01Dc | 3.14 ± 0.04Eb | 2.94 ± 0.04Eb |
* The data represented as mean ± S.D. of triplicate analysis with different uppercase letter (a-c) within same column and different lowercase letter (A-E) within same row are significantly different at confidence level of 95% (P<0.05).
Table 2: Water activity (aw) between packaging A (PET-PE-ALU-LLDPE) and packaging B (OPP-PE-MPET-LLDPE) over 12 weeks of storage at three different temperatures 25, 40 and 60°C
| Weeks | 1 | 2 | 3 | 4 | 6 | 8 | 10 | 12 |
| Packaging A | ||||||||
| 25°C | 0.500 ± 0.004Aa | 0.438 ± 0.005Ba | 0.397 ± 0.003Ca | 0.396 ± 0.003Ca | 0.393 ± 0.007Ca | 0.383 ± 0.003CDa | 0.378 ± 0.001CD | 0.370 ± 0.001Da |
| 40°C | 0.406 ± 0.005Ab | 0.404 ± 0.002Ab | 0.399 ± 0.006Aa | 0.401 ± 0.008Aa | 0.376 ± 0.006Ba | 0.373 ± 0.003BCa | 0.365 ± 0.002BCa | 0.350 ± 0.001Cb |
| 60°C | 0.357 ± 0.005Ac | 0.344 ± 0.004ABc | 0.330 ± 0.006BCb | 0.314 ± 0.002CDb | 0.300 ± 0.001DEb | 0.289 ± 0.008EFb | 0.268 ± 0.008FGb | 0.262 ± 0.002Gc |
| Packaging B | ||||||||
| 25°C | 0.492 ± 0.005Aa | 0.460 ± 0.004Ba | 0.428 ± 0.003Ca | 0.432 ± 0.002Ca | 0.414 ± 0.007CDa | 0.401 ± 0.004Da | 0.379 ± 0.001Ea | 0.375 ± 0.001Ea |
| 40°C | 0.454 ± 0.008Ab | 0.401 ± 0.007Bb | 0.381 ± 0.004BCb | 0.377 ± 0.005BCb | 0.361 ± 0.004CDb | 0.353 ± 0.006CDb | 0.343 ± 0.008Db | 0.338 ± 0.003Db |
| 60°C | 0.371 ± 0.003Ac | 0.299 ± 0.005Bc | 0.290 ± 0.010Bc | 0.289 ± 0.008Bc | 0.283 ± 0.002Bc | 0.279 ± 0.007BCc | 0.245 ± 0.011CDc | 0.243 ± 0.006Dc |
* The data represented as mean ± S.D. of triplicate analysis with different uppercase letter (a-c) within same column and different lowercase letter (A-G) within same row are significantly different at confidence level of 95% (P<0.05).
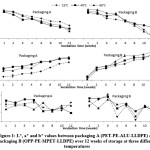 |
Figure 1: L*, a* and b* values between packaging A (PET-PE-ALU-LLDPE) and packaging B (OPP-PE-MPET-LLDPE) over 12 weeks of storage at three different temperatures Click here to View figure |
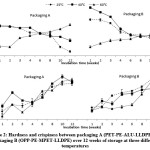 |
Figure 2: Hardness and crispiness between packaging A (PET-PE-ALU-LLDPE) and packaging B (OPP-PE-MPET-LLDPE) over 12 weeks of storage at three different temperatures Click here to View figure |
Table 3: Oil extraction (%) between packaging A (PET-PE-ALU-LLDPE) and packaging B (OPP-PE-MPET-LLDPE) over 12 weeks of storage at three different temperatures 25, 40 and 60°C
| Weeks | 2 | 4 | 6 | 8 | 10 | 12 |
| Packaging A | ||||||
| 25°C | 17.10 ± 0.20Da | 14.96 ± 0.39Eb | 20.15 ± 0.09Ca | 17.25 ± 0.32Dc | 20.30 ± 0.20Ca | 20.86 ± 0.16BCa |
| 40°C | 14.65 ± 0.17Cb | 17.76 ± 0.23Ba | 20.80 ± 0.09Aa | 22.02 ± 0.07Aa | 20.93 ± 0.32Aa | 21.22 ± 0.22Aa |
| 60°C | 17.95 ± 0.06Da | 18.00 ± 0.00Da | 18.45 ± 0.18Db | 20.20 ± 0.12Cb | 20.13 ± 0.14Ca | 21.15 ± 0.11Ba |
| Packaging B | ||||||
| 25°C | 14.90 ± 0.04Db | 8.82 ± 0.09Ec | 19.34 ± 0.34BCa | 19.41 ± 0.32BCb | 18.93 ± 0.06Ca | 22.08 ± 0.24Aa |
| 40°C | 12.95 ± 0.25Fc | 16.80 ± 0.15Ea | 19.03 ± 0.19BCa | 21.96 ± 0.04Aa | 19.38 ± 0.31Ba | 22.02 ± 0.19Aa |
| 60°C | 17.15 ± 0.17Da | 13.17 ± 0.03Eb | 18.55 ± 0.20Ca | 18.26 ± 0.32Cb | 19.64 ± 0.10ABa | 20.12 ± 0.16Ab |
* The data represented as mean ± S.D. of triplicate analysis with different uppercase letter (a-c) within same column and different lowercase letter (A-F) within same row are significantly different at confidence level of 95% (P<0.05).
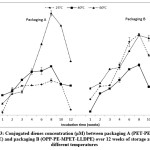 |
Figure 3: Conjugated dienes concentration (μM) between packaging A (PET-PE-ALU-LLDPE) and packaging B (OPP-PE-MPET-LLDPE) over 12 weeks of storage at three different temperatures Click here to View figure |
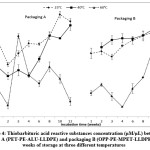 |
Figure 4: Thiobarbituric acid reactive substances concentration (μM/μL) between packaging A (PET-PE-ALU-LLDPE) and packaging B (OPP-PE-MPET-LLDPE) over 12 weeks of storage at three different temperatures Click here to View figure |
Discussion
Linear expansion and oil absorption
The linear expansion for control fried fish cracker was 75.67% ± 5.86 while the oil absorption of fried fish cracker was 27.86 ± 0.80. Yu 29 proposed that linear expansion of fried fish crackers should be greater than 77% for crispiness. The amount and type of fish and flour used contribute to the linear expansion of fried fish crackers. 26,29,30,31
Fried fish crackers with higher linear expansion had higher oil absorption. Similar observation was reported by Huda et al. 32,33 and King 30. They postulated that fried fish crackers with higher degree of expansion formed more air cells that were able to trap more oil. In addition, the main reason of oil absorption during cooling was due to development of pore size distribution (observed under scanning electron microscope) in the frying process. 13 During frying, smaller pores trapped more air that caused higher capillary pressure when product was cooled. In turn, product absorbed more oil.
Moisture content of fried fish crackers
Moisture contents of fried fish crackers stored at 25, 40 and 60ºC for 12 weeks of storage were shown in Table 1 below. Moisture content of the fried fish cracker stored in packaging A were found to be low; ranged from 2.76 – 4.84%, than the moisture of fried fish cracker that was stored in packaging B; ranged from 2.94 – 5.40%. The moisture content at 60ºC in both packaging showed the lowest moisture and progressively decreased starting at week 6 of storage period. There were significantly small changes (p < 0.05) in loss of moisture content during the 12 weeks of storage.
The moisture contents of the fried fish crackers were lower as expected as they were dry product. 34 The moisture contents in the current study were lower as compared to those reported by Yu, 29 King, 30 and Huda et al. 35 with 9%, 12% and 9-13%, respectively. There were significantly small changes in loss of moisture content during the 12 weeks of storage. The fried fish crackers sealed with OPP-PE-MPET-LLDPE packaging film showed better barrier due to low WVTR and OTR. Sensory shelf life can deteriorate because of packaging materials that undergo physical changes with occasional subsequent chemical reactions. For example, microbiological activity and chemical reactions may increase when permeability of packaging material changes with time that causes change in the in-pack equilibrium atmosphere. 23 If foods are dried to a much lower moisture content (less than about 2-3%), they may instead become susceptible to oxidation. 36
Water activity of fried fish crackers
From the results shown in Table 2, the water activity of fried fish crackers decreased during the three months storage. Overall, crackers that were stored at 25, 40 and 60°C had gradual decrease in water activity until week 12. At 60°C, a significant decrease in water activity was noted during three months of storage in both packaging A and packaging B. The decrease of water activity could be directly related to the loss of moisture content in crackers due to higher storage temperature at 60°C. The sample at 25ºC had the highest water activity in packaging A and packaging B with a value of 0.500 ± 0.004 and 0.492 ± 0.005 respectively, followed by crackers at 40ºC with a value of 0.406 ± 0.005 and 0.454 ± 0.008 aw, and crackers at 60ºC with a value of 0.357 ± 0.005 and 0.371 ± 0.003 aw.
Water activity control is among the most used method to optimize food quality. The safety and shelf life of food products can be estimated by observing and controlling the water activity. The result showed that Packaging A had better capability than Packaging B in retaining water activity of fried fish crackers stored at 60°C. Packaging A showed that water activity of crackers reached 0.3 at week 6, whereas water activity of crackers in Packaging B had significantly reduced to 0.3 as early as week 2. The other two storage temperatures (25 and 40°C) for both packaging showed a gradual reduction in water activity, but did not go lower than 0.3 by the end of week 12.
Water activity control has become the traditional approach for optimizing food quality and the chief means of predicting and controlling the shelf life and safety of food products. Lipid oxidation rates were also found to increase with increasing water activity, after going through a minimum, owing to the increasing diffusion rates of reactants and exposure of catalytic sites as the product swelled during hydration. 37 These findings imply that there is an optimum water activity range for maximum product shelf life. 38
The range of water activity stated by Esse and Saari 39 for crackers were 0.30 – 0.40 aw. The rate of free radical oxidation of unsaturated lipids decreased from 0.0 to about 0.35 aw upon which the rate gradually increased with water activity. The observation in most dry cereal products with 0.35 aw corresponds to a moisture level of 8 ± 10% which is the amount of water necessary to form a protective monolayer over the surfaces of polysaccharides and proteins that are associated with unsaturated lipids. This monolayer acts as a barrier to free radical oxygen attack on the carbon-to-carbon double bond system.
From the results, the water activity decreased from 0.503 to 0.243 aw. Food stability maps 37 indicate qualitatively that, for a given product, at very low water activity (< 0.3 aw) and moisture contents, lipid oxidation and other free radical reactions occur more rapidly than at higher water activity (water has been shown to shorten the lifetime of free radicals), 38 whereas, at high relative humidity and moisture contents, biological reactions (enzyme activity, microbial growth) occur with increasing rates.
Color of fried fish crackers
The lightness (L*) of fried fish crackers incubated for 12 weeks (Figure 3) started at 64 and decreased significantly (p < 0.05) to 47 – 55 as the storage time increased at all temperatures in both packaging A and B. The redness (a*) values of fried fish crackers ranged from 0.71 to 5.78. The values increased significantly (p < 0.05) throughout the 12 weeks of storage. The redness value for sample stored at 60°C was highest from 2.27 to 4.81 in packaging A and from 0.71 to 5.78 in packaging B. The yellowness (b*) values of fried fish crackers also increased significantly (p<0.05) and ranged from 15 – 29 in both packaging A and packaging B.
The lightness (L*) of fried fish crackers decreased as time and storage temperature increased in relation to the darkening of the characteristic whitish/greyish color due to oxidative spoilage.40,41 The frying process may cause lighter color of the fried product because high temperature denatures and oxidizes fish protein. The denatured and oxidized amino acid and Maillard browning forms colored compounds.42, 43 Chemical environment of fried food (i.e. water activity, reaction temperature, pH, food composition) will influence the rate of Maillard reaction.34
For both types of packaging, the a* (redness) values of fried fish cracker showed a small but significant increase starting from week 6 onwards. At 25°C, Packaging A had significantly lower a* value than other storage temperatures, but Packaging B showed almost consistent a* value at all storage temperatures. On the other hand, b* (yellowness) value in both packaging and all storage temperatures fluctuated throughout the storage time. However, the fluctuation was more prominent in Packaging B after week 3. Non-enzymatic browning reactions involving lipid oxidation products and amino acids in protein is suggested to be the cause of yellow pigment formation in muscle foods.44
Hardness and crispness of fried fish crackers
Based on Figure 4, the hardness of the fried fish crackers decreased significantly (p < 0.05) as storage time increased from 1.380 to 0.793 kg (at 25°C) and 1.360 to 1.040 kg (at 40°C) in packaging A. Samples in packaging B also showed a significant decrease from 1.503 to 1.000 kg (at 25°C) and 1.773 to 0.993 kg (at 40°C). For example, specific lipid oxidation products will affect the protein properties such as loss of texture, fragmentation and solubility changes in food products.45 However, at 60°C, the hardness increased significantly (p < 0.05) for both packaging A (0.907 to 1.390 kg) and B (0.893 to 1.320 kg). Hardness is described as the compactness of structural organization of starch and protein complexes. So when fat migrates, the hardness value decreases. The increasing hardness of the crackers at 60°C could be due to the higher loss of moisture content in the crackers. When water loss is higher in food, the texture becomes harder and drier.
The crispiness of fried fish crackers in both packaging A and B ranged from 6.94 to 12.45 kg.sec, increased significantly (p < 0.05) with the storage time but storage temperatures showed a non-significant (p > 0.05) increase. The reduction in moisture content, due to migration or being taken up for other reaction, gave firmer texture on the surface and consequently increased the crispiness. The major cause of reduced physical quality in food is moisture migration. This results in reduced crispness in fresh produce and dry products. 23
Lipid extractability of fried fish crackers
Table 5 shows lipid yield obtained from fried fish crackers stored at 25, 40, and 60°C in packaging A and B, which were less than 25%. The pattern of the lipid yield obtained was however not uniform. However, the lipid extracted showed an increase from week 6. The lipid extractabilities did not significantly change over the incubation time. The colors of lipid extracted changed from lighter to darker and became more viscous towards the end of storage. Oxidation product which was soluble lipid contributed to the increment of lipid extractability and color of the oil.45
Conjugated dienes of fried fish crackers
Figure 6 shows the conjugated dienes of fried fish crackers in packaging A and B over 12 weeks of storage at three different temperatures. Conjugated dienes showed a significant increase (p < 0.05) in concentration from week one to week eight then decreased until week 12. This is probably that conjugated dienes (primary products) are broken down into secondary products (which do not absorb UV-visible light strongly) which lead to a decrease in absorbance. The concentration of conjugated dienes was highest at 60°C during week eight with 1146.22 ± 32.69 in packaging A. Conjugated dienes can be the marker for the onset of lipid oxidation. Conjugated dienes, the initial products in autoxidation, are formed during the oxidation of unsaturated fatty acids with two or more double bonds to achieve a stable resonance structure.
The stability of fried foods is affected by lipid oxidation, which yields both primary and secondary oxidation compounds. Primary oxidation compounds, such as lipid hydroperoxides, are formed in an initial stage of lipid oxidation, increasing in level as oxidation advances, until reaching a plateau, and later decreasing because of degradation into secondary oxidation compounds such as aldehydes, ketones and hydrocarbons or interaction with other food components. 46
Almost immediately after peroxides are formed, the non-conjugated double bonds that are present in natural unsaturated lipids are converted to conjugated double bonds. The interaction of lipid oxidation products with proteins is also significant and there are several ways in which they react. 47,48 Hydrophobic and hydrogen bonds between lipid peroxides or other products of lipid oxidation and protein are very extensive. Lipid free radicals can interact with several amino acids in protein molecules to induce protein free radicals. The end products of such reactions may be polymers formed by protein-protein cross-linking and complexes involving lipid-protein cross-links. 48
Thiobarbituric acid reactive substances of fried fish crackers
From Figure 7, the secondary products of lipid oxidation showed an increase in concentrations of thiobarbituric acid reactive substances during the three months storage, except for samples in packaging A at 60°C. The later showed a decreasing pattern in week 2, but increased significantly in the third week. The lipid oxidation was found to accelerate with increasing temperature, which was unexpected for active lipid oxidation. A possible reason for this phenomenon is, instead of accumulating, the oxidation products were rapidly decomposing or transforming to other products. Significant different was observed only in the packaging A at three different temperatures for first week of storage until week eight, but was not observed in later storage period. Meanwhile, in packaging B, the TBARS value for samples stored in 25°C and 40°C increased non-significantly.
After ten weeks, there were noticeable reductions of secondary products. These products serve as a marker for assessing the extent of lipid oxidation. The major degradation product of lipid hydroperoxides in oxidized food is malondialdehyde. Lower TBARS indicates loss of mostly lower molecular weights volatile lipid oxidation products. Initiation and acceleration of lipid oxidation are affected by various mechanisms including the production of singlet oxygen, enzymatic and non-enzymatic generation of free radicals and active oxygen. 49 Furthermore, volatile oxidation products with low molecular weight could be lost during storage. As aforementioned, the increased in TBARS can be explained by the further reaction of primary oxidation products.
Conclusion
The physicochemical analyses performed in the present work demonstrated decreasing patterns in moisture content, water activity, lightness (L*), and hardness while increasing patterns in redness (a*), yellowness (b*), crispness and oil extraction of fried fish crackers during storage. Lipid oxidation as measured by conjugated dienes and thiobarbituric acid reactive substances initially increased, then alternately increased and decreased in cycles with a consistent downward trend with low levels of oxidation throughout incubation The development of notable off-odors and flavors during incubation demonstrated that low oxidation values occurred in the fried fish cracker. Packaging B with 0.8 moisture vapor transmission rate (MVTR) and 0.8 oxygen transmission rate (OTR), higher than packaging A with 0.05 MVTR and 0.05 OTR showed higher resistance of fried fish crackers towards lipid oxidation. The effects of storage condition and packaging materials demonstrated in the present work would give insights on prolonging shelf life of fried fish crackers.
Acknowledgments
The authors gratefully acknowledge the financial support received from Universiti Putra Malaysia through the grant scheme GP-IPM/2014/9434700
References
- Ranhotra, G. S. and Vetter, J. L. Foods considered for nutrient addition: snacks and confectioneries. Ch. 11. In Bauernfeind, J. C. and Lachance, P. A. (Ed.) Nutrient Addition to Food, Food & Nutrition Press, Inc., Trumbull, CT., 1991 pp. 319 – 345.
- Suknark, K., Phillips, R. D. and Huang, Y. -W. Tapioca-fish and tapioca-peanut snacks by twin-screw extrusion and deep-fat frying. Food Sci. Eng/Process. 1999; 64(2): 303–308.
CrossRef - Boran, M. and Kose S. Storage properties of three types of fried whiting balls at refrigerated temperatures. J. Fish. Aquat. Sci. 2007; 7: 65–70.
- Shaviklo, G. R., Olafsdottir, A., Sveinsdottir, K., Thorkelsson, G. and Rafipour, F. Studies on processing, consumer survey and storage stability of a ready-to-reconstitute fish cutlet mix. Food Sci. Technol. 2013; 50: 900–908.
CrossRef - Kamari, S. and Shabanpour, B. Development and sensory evaluation of silver carp (Hypophthalmichthys molitrix) fish based snack food. World J. Fish Marine Sci. 2013; 5(6): 670–673.
- Neiva, C. R. P., Machado, T. M., Tomita, R. Y., Furlan, É. F., Lemos Neto, M. J. and Bastos, D. H. M. Fish crackers development from minced fish and starch: an innovative approach to a traditional product. Ciênc. Technol. Aliment. 2011; 31(4): 973–979.
CrossRef - Huda, N., Leng, A. L., Yee, C. X. and Herpandi, N. Chemical composition, color and linear expansion properties of Malaysian commercial fish cracker (keropok). As. J. Food Ag-Ind. 2010; 3: 473–482.
- Kaewmanee, T., Karrila, T. T. and Benjakul, S. Effects of fish species on the characteristics of fish cracker. Food Res. J. 2015; 22(5): 2078–2087.
- Tee, E. S., Noor, M. I., Azudin, M. N. and Idris, K. Nutrient composition of Malaysian foods: 4th Edition. Malaysian Food Composition Database Programme. 1997. Institute for Medical Research, Kuala Lumpur.
- Kyaw, Z. Y., Yu, S. Y., Cheow, C. S. and Dzulkifly, M. H. Effect of steaming time on the linear expansion of fish crackers (keropok). Sci. Food Agric. 1999; 79(11): 1340–1344.
CrossRef - Taewee, T. K. Cracker “Keropok”: A review on factors influencing expansion. Food. Res. J. 2011; 18(3): 825–836.
- Jamilah, B., Yaakob B. C. M. and Thean L. C. Antioxidant activity of Citrus hystrix peel extract in rbd palm olein during frying of fish crackers. Food Lipids. 1998; 5: 149–157.
CrossRef - Moreira, R. G., Sun, X. and Chen, Y. Factors affecting oil uptake in tortilla chips in deep-fat frying. Food Eng. 1997; 31(4): 485–498.
CrossRef - Dobarganes, C., Marquez-Ruiz, G. and Velasco, J. Interactions between fat and food during deep-frying. J. Lipid Sci. Technol. 2000; 102: 521–528.
CrossRef - Chotimarkorn, C. and Silalai, N. Oxidative stability of fried dough from rice flour containing rice bran flour during storage. LWT- J. Food Sci. Technol. 2008; 41(4): 561–568.
CrossRef - Tabee, E., Azadmard-Damirchi, S., Jagerstad, M. and Dutta, P. C. Lipids and phytosterol oxidation in commercial French fries commonly consumed in Sweden. Food Compost. Anal. 2008; 21(2): 169–177.
CrossRef - Gordon, M. H. The development of oxidative rancidity. In Antioxidants in Food – Practical Applications (eds. J. Pokorny, N. Yanishlieva, M. Gordon). CRC Press, Washington, 2001, pp. 7–22.
CrossRef - Fávaro, S. L., Freitas, A. R., Ganzerli, T. A., Pereira, A. G. B., Cardozo, A. L., Baron, O., Muniz, E. C., Girotto, E. M. and Radovanovic, E. PET and aluminum recycling from multilayer food packaging using supercritical ethanol. Supercrit. Fluids. 2013; 75: 138–143.
CrossRef - Gavitt, I. F. ‘Vacuum coating applications for snack food packaging’, Proceedings of the 36th Annual Technical Conference of the Society of Vacuum Coaters. 1993; 254–258.
- Badeka, A., Goulas, A. E., Adamantiadi, A., and Kontominas, M. G. Physicochemical and mechanical properties of experimental coextruded food-packaging films containing a buried layer of recycled low-density polyethylene. Agric. Food Chem. 2003; 51: 2426–2431.
CrossRef - Chytiri, S., Goulas, A. E., Riganakos, K. A., Badeka, A. and Kontominas, M. G. Volatile and non-volatile radiolysis products in irradiated multilayer coextruded food packaging films containing a buried layer of recycled low density polyethylene. Food Addit. Contam. 2005; 22: 1264–1273.
CrossRef - Kulkarni, A. K., Daneshvarhosseini, S. and Yoshida, H. Effective recovery of pure aluminum from waste composite laminates by sub- and supercritical water, Supercrit. Fluids. 2011; 55: 992–997.
CrossRef - Kilcast, D. and Subramaniam, P. Introduction. In: Kilcast, D., Subramaniam, P. (Eds.), The Stability and Shelf life of Food. Woodhead Publishing Limited, Cambridge, England. 2000; pp. 1–22.
CrossRef - Emblem, A. Plastics properties for packaging materials. In: Packaging Technology: Fundamentals, Materials and Processes. Emblem, A. and Emblem, H. (Eds.). Woodhead Publishing Limited, Cambridge, England. 2012; pp 287–309.
CrossRef - Yu, S. Y., Mitchell, J. R. and Abdullah, A. Production and acceptability testing of fish crackers (keropok) prepared by the extrusion method. Food Sci. Technol. 1981; 16: 51–58.
CrossRef - Mohamed, S., Abdullah, N. and Muthu, M. K. (1988). Expansion, oil adsorption, elasticity and crunchiness of keropok (fried crisps) in relation to the physico-chemical nature starch flours. In Maneepun, S., Varangoon, P. and Phithakpol, B. (eds). Food Science and Technology in Industrial Development. Proceedings of the Food Conference ’88. Bangkok, IFRPD-Kasetsart University, Thailand. 1988; pp. 108–113
- AOAC International in Official methods of analysis, 18th edn, 2005; Current through revision 2, 2007 (On-line). AOAC International, Gaithersburg, MD
- Wan Ibadullah, W. Z. Lipid-Protein Interactions in Peanut Butter. Ph.D. Food Science, Rutgers University, New Brunswick, NJ. 2013
- Yu, S. Y. Acceptability of fish crackers (keropok) made from different types of flour. ASEAN Food J. 1991; 6: 114–116.
- King, M. A. Development and sensory acceptability of crackers made from the big-eye fish (Branchydeuterus auritus). Food Nutr. Bull. 2002; 23(2): 317–340.
CrossRef - Peranginangin, R., Fawzia, Y. N., Sugiyono and Mulyanah, I. (1997). Food additives and effect of thickeness on fish crackers quality. In Kuang H. K., Kim, L. L. and Yong, L. P. (Eds). Proceeding of the seminar on the advances in fish processing technology in Southeast Asia in relation to quality management (MFRD-SEAFDEC, Singapore, 1997), pp 106–114
- Huda, N., Aminah, A. and Babji, A. S. Physicochemical and sensory characteristic of cracker formulated with surimi powder. International Symposium on the Role of Chemistry in Industry and Environment. Padang. 30–31 August 2000
- Huda, N., Aminah, A. and Babji, A. S. Substitution of tapioca flour with surimi powder in traditional crackers (keropok palembang). 16th Scientific Conference Nutrition Society of Malaysia, Kuala Lumpur. 24–25 March 2001
- Huda, N., Boni, I. and Noryati, I. The effect of different ratios of Dory fish to tapioca flour on the linear expansion, oil absorption, color, and hardness of fish crackers. Food Res. J. 2009; 16: 159–165.
- Huda, N., Ismail, N., Leng, A. L. and Yee, C. X. Chemical composition, colour and linear expansion properties of commercial fish cracker. 12th Asian Chemical Congress, Kuala Lumpur 23–25 August 2007.
- Labuza, T. P. and Dugan, Jr., L. R. (1971). Kinetics of lipid oxidation in foods. Rev. Food Sci. Nutri. 1971; 2: 355–405.
CrossRef - Labuza, T. P., Mcnally, L., Gallagher, D., Hawkes, J. and Hurtado, F. Stability of intermediate moisture foods. 1. Lipid oxidation. Food Sci. 1972; 37: 154–159.
CrossRef - Kalichevsky-Dong, M. T. The glass transition and microbial stability. In: Kilcast, D., Subramaniam, P. (Eds.), The Stability and Shelf life of Food. Woodhead Publishing Limited, Cambridge, England. 2000 pp. 25–54.
CrossRef - Esse, R. and Saari, A. Shelf-life and moisture management. In: Steele, R. (ed.) Understanding and measuring the shelf-life of food. Woodhead Publishing Limited. Cambridge, England. 2004 pp. 24–41.
CrossRef - Yeannes, M. I. and Casales, M. R. Estudio de las variables de proceso de marinados de anchoíta (E. anchoita). 1995; 87–91.
- Yeannes, M. I., Sanchez Pascua, G. L. and Casales, M. R. Determinación de aspectos del deterioro en marinados de anchoita que afectan su vida útil. Libro de Actas del XI Congreso Argentino CYTAL. 2007
- Sikorski, Z. E. and Pan, B. S. The effect of heat-induced changes in nitrogenous constituents on the properties of seafoods. In Sikorski, Z. E., Pan, B. S. and Shahidi, F. (Eds.). Seafood Proteins, Chapman & Hall, New York. 1994; pp. 84–98
CrossRef - Ngadi, M., Li, Y. and Oluka, S. Quality changes in chicken nuggets fried in oils with different degrees of hydrogenation. LWT- Food Sci. Technol. 2007; 40: 1784–1971.
CrossRef - Thanonkaew, A., Benjakul, Z., Visessanguan, W. and Decker, E. A. Development of yellow pigmentation in squid (Loligo peali) as a result of lipid oxidation. Agric. Food Chem. 2006; 54: 956–962.
CrossRef - Dong, Y. Protein modification in baked versus fried tortilla chips. Food Science, Rutgers University, New Brunswick, NJ. 2011. M.Sc. thesis
- José, A. N., Alba, T., Rafael, C., Josep, B., Ricard, B. and Francesc, G. Modified ferrous oxidationxylenol orange method to determine lipid hydroperoxides in fried snacks. J. Lipid Sci. Technol. 2004; 106: 688–696.
CrossRef - Wasowicz, E., Gramza, A., Hes, M., Jelen, H. H., Korczak, J., Malecka, M., Mildner-Szkudlarz, S., Rudzinska, M., Samotyja, U. and Zawirska-Wojtasiak, R. Oxidation of lipids in food. Food Nutr. Sci. 2004; 13(54): 87–100.
- Kubow, S. Routes of formation and toxic consequences of lipid oxidation products in foods. Free Radic. Biol. Med. 1992; 12: 63–81.
CrossRef - Karen, M.S., Fereidoon, S., Ying, Z., and Michael Eskin N. A., (2013). (Lipid oxidation). In Michael Eskin N., A., and Fereidoon S. (Eds.), Biochemsitry of Foods (pp. 419-498). New York, NY: Elsevier
Accepted on: 20/06/2019
Second Review by: Dr. Sanju Bala Dhull India
Final Approval by: Prof. Min-Hsiung Pan


Web of Science Coverage
Emerging Sources Citation Index (ESCI)
2024 Journal Impact Factor: 1.1
Scopus Journal Metrics
CiteScore 2025: 2.6
CiteScore Details
Sustainable Nutrition: Food Systems, Nutrient Retention, and Public Health Impact
![]()
This journal is a member of, and subscribes to the principles of, the Committee on Publication Ethics (COPE)


