Trends of Food Supply and Nutrient Intake in South Korea over the Past 30 Years
Jong-Gyu Kim1
, Jeong-Gyoo Kim3 1Faculty of Food and Health Sciences, Daegu, Keimyung University, Republic of Korea
2Department of Industrial and Management Engineering, Daegu, Keimyung University, Republic of Korea
3School of Games (Software), Sejong, Hongik University, Republic of Korea
Corresponding Author Email: jskim@kmu.ac.kr
DOI : http://dx.doi.org/10.12944/CRNFSJ.7.1.09
Download this article as:
![]()
Purpose: This study was conducted to investigate food supply and consumption trends in South Korea over the past 30 years (1980 to 2010). Methods: We used time series data on Food Balance Sheets of Korea and the National Health and Nutrition Survey from Korea Statistics. Regression analysis was performed for trends of food supply and demand, and t-test for the gender difference in nutrient intake. Results: The annual supply of cereals, rice and starch roots per person has decreased, while that of meat, fish and shellfish, eggs, milk, and fats and oils has increased
(p < 0.05), respectively. These changes effect on nutrient intake: rice consumption has declined to one-third of total energy intake, however, the energy intake from lipid sources has increased up to 20% in the 2000s.The nutrient intake levels are mostly sufficient to meet the recommended intake, but calcium intake is below the recommended level and sodium is three times above the recommended level. These problems are found in both genders, and males take in more calories and sodium than females (p < 0.05). Conclusion: These changes in food consumption and supply resulted in lowering both quantities based food self-sufficiency rate and self-sufficiency of nutrition supply. It is therefore suggested that the supply of agricultural products should be stable and quality competitiveness in supply should be improved. Also, measures and strategies in promoting rice consumption are required, such as promoting healthy diet via nutrition education and disseminating healthy traditional Korean food.
Food Supply and Demand; Nutrient Intake; Self-Sufficiency Rate; South Korea
Introduction
In the past when food was very scarce, securing sufficient food was a major issue not only for individuals but also for nations. However, these days we have both nutritional deficiencies and over nutritional problems. The balance of nutrition is emphasized to maintain good health and prevent disease. We should consider the intake of a nutrient is adequate or excessive as well as the required amount of food to get the adequate nutrition.1
With economic growth and changes in lifestyle in South Korea over the past decades, eating habits of people have changed rapidly, and the risk of chronic diseases is increasing, although life expectancy has increased and exceeded the OECD average2, 3.Dietary factors are important for maintaining optimal weight and good health, and poor dietary habits lead to the emergence of chronic diseases such as cancer, coronary heart disease, stroke, hypertension, diabetes mellitus, dyslipidemia, dementia, obesity and oxidative stress.4 In literature, it is indicated that major chronic diseases are closely related to dietary factors, and it is the case in South Korea. According to the records in 2016, more than one in three adults are obese.5 Moreover, the first cause of death in South Korea is cancer and is followed by cardio-cerebrovascular disease.6 The main cause of these diseases has been indicated due to food and nutrient intake. The International Association of Research on Cancer indicated that diet and food consumption is one of the contributing causes of cancer.7 It has been indicated that the most important risk factors of heart disease and stroke are an unhealthy diet, physical inactivity, tobacco use and harmful use of alcohol. These risk factors are responsible for about 80% of coronary heart disease and cerebrovascular disease.8, 9
Since 1969, South Korea has been conducting nationwide nutrition surveys, named as Korea National Nutrition Survey, and has regularly reported the food and nutrient intakes of Koreans.10 It was expanded to the Korea National Health and Nutrition Examination Survey, calculated the actual nutritional status and health level data from 1998 onwards, and is actively utilizing for evaluation of overall peoples’ health.11 The National Nutrition Survey was conducted to investigate the intake of households and limited to investigate gender-, age-specific data, and contents that were consumed outside the home. It was then improved and revised in 1998, via food intake surveys adopting a 24-hour recall method, therefore we are able to obtain more precise data on individuals.12
From the surveys in 2010, it is found that the consumption of beverages, alcoholic beverages, and snacks has greatly increased due to the growing trend of eating out. In fact, this increase can be viewed at the point of the total intake of food. The total food intake was 1,101g in 1995, but it has increased by about 300g to 1,277g in 1998. The energy intake in 1969 was 2,105 kcal, but in 2008 1,828 kcal, and, it ranged from 1,770 kcal to 2,150 kcal for the 40 years. Though these numbers are variable and show neither remarkable increase nor decrease the obesity population has already exceeded 30% in the 2006 survey.10-12
A number of research papers have been published on the relationship between major chronic diseases and dietary factors using the National Health and Nutrition Examination Survey. The main themes of the papers were as follows: Nutrient intake status, associations of specific nutrient intake and diseases or risk of diseases such as obesity, periodontal disease, cardiovascular diseases, metabolic syndrome, food contaminant and risk of diseases, and establishment of portion size of dishes frequently consumed by Koreans.13-20
However, there have been very few reports on linking to food supply to nutrient intake for a long time including surveyed years. This study investigates trends in food supply and consumption in South Korea over the past three decades (1980 ~ 2010) using nationwide data provided by the Korean Government. We carry out statistical analyses, regression analysis and t-test. We will also derive implications based on our analyses and suggest future challenges, measures and potential strategies.
Materials and Methods
Data Source
Food supply and consumption data. In order to obtain the data, we used annual Food Balance Sheet from the Korea Rural Economic Institute (KREI) and Korea Statistics, both of which are under the umbrella of Korean Government, over the past 30 years (1981~2010).21-23
Nutrient intake data. The data were collected from the data resource profile: The Korea National Nutrition Survey and The Korea National Health and Nutrition Examination Survey (KNHANES).10-12 The KNHANES has been expanded and revised since 1998 in the National Nutrition Survey, which initially has been conducted since the 1960s. The NHANES collects information for non-communicable diseases and dietary intakes and is composed of three categorized surveys: health interview, health examination and nutrition survey. It includes approximately 10,000 individuals each year as a survey population and checks dietary intakes using a 24-hour recall method. It started in 1998 and took place at intervals of 3 years each from 1998 to 2005 (conducted for 2-3 months in the years). Since 2007, headquarters of the Korea Center for Disease Control has been conducting a year-round survey. Therefore, it should be noted that there were differences in the target age and contents of the survey by year due to unequal time spans.24 Also, some of the nutrient intake trends analyzed in this study are based on the 1998 data. In addition, the Recommended Dietary Allowances for Koreans (KRDA) were used since the 1960s as reference standards for nutrient intake. In 2005, it was revised and transformed into new standards, the Dietary Reference Intakes for Koreans (KDRIs). So, such revision might have partly affected the calculation and evaluation of nutrient intake in analyzing the long-term data.25
Statistical Analysis
For data analysis and statistical processing, Excel and SPSS for Windows 22.0 (IBM Corp., Chicago, IL, U.S.A.) were used. The numerical values of food supply and demand are given as frequency and percentage (%). Regression analysis was carried out to find trends in the food supply over time. Students’- t-test was used to compare the gender difference in nutrient intake. The statistical significance was considered at the p-value where it is less than 0.05.
Results
Food Supply and Self-Sufficiency Rate
The trend of food supply: The food supply of South Korea over the past 30 years is shown in Figure 1. During the 30 years (1980 ~ 2010), the annual supply of food per person showed a decrease in cereals (0.8%), rice (15.4%), and starch roots (1.5%). While those of vegetables (0.3%), oil crops (6.5%), fruits (3.5%), meat (4.0%), fish and shellfish (19.6%), eggs (18.7%), seaweeds (6.7%), and fats and oils (3.0%) were increasing (Figure 1).
Among the food groups, cereals supply during these 30 years decreased from 185.0 kg per capita per year in 1980 to 145.1 kg in 2010 (decrease by 39.9 kg) (p < 0.001). During these years, the supply of rice, which is the main staple of Koreans, decreased to 81.5 kg from 132.9 kg per capita per year (decrease by 51.4 kg, by 38.6%) (p < 0.001).
On the other hand, meat supply showed continued growth and more than doubled from 13.9 kg per capita per year in 1980 to 43.5 kg in 2010 (p < 0.001), the supply of fish and shellfish increased from 22.5 kg to 36.6 kg (p = 0.014), eggs from 5.9 kg to 9.9 kg (p < 0.001), milk from 10.8 kg to 57.0 kg (p < 0.001). The supply of fruits also increased from 16.2 kg per capita per year to 44.2 kg (p < 0.05), and seaweeds from 4.5 kg to 14.7 kg (p = 0.04). The supply of fats and oils rose almost tripled from 5.0 kg per capita per year in 1980 to 13.9 kg in 2010 (p = 0.031).
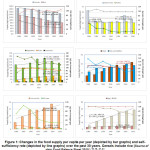 |
Figure 1: Changes in the food supply per capita per year (depicted by bar graphs) and self-sufficiency rate (depicted by line graphs) over the past 30 years. Cereals include rice (Source of data: Food Balance Sheet 2010.)16-18, 21-23 Click here to View figure |
The trend of self-sufficiency rates of food and nutrition: The trend of quantity-based food self-sufficiency rate, which shows the ratio of domestic food production to domestic food consumption, is also shown in Figure 1 (depicted by line graphs). The self-sufficiency rate of cereals and pulses decreased rapidly, reaching 28.1% and 11.0% in 2010, respectively. On the other hand, seaweeds accounted for 119.8%, followed by eggs (99.7%), starch roots (98.4%), and vegetables, 90.1%. However, in 2010, self-sufficiency rate of fats and oils only amounted to 2.6%.
The self-sufficiency rate of nutrient supply is shown in Figure 2. Both energy and protein self-sufficiency rates remained above 50% until 2000, then it declined to less than 50% in 2010. For lipid, self-sufficiency late has already been rapidly reduced by 30.3% in 1990 and then 20% in 2000. It has continued to decline slowly to reach below 20% till 2007. In 2008 it was recovered to keep above 20% by 2010.
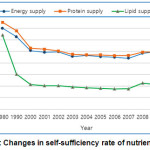 |
Figure 2: Changes in the self-sufficiency rate of nutrient supply Click here to View figure |
Foods from plants and animals: During the last three decades, daily food intake per person was within the range from 1,048 g to 1,701 g. The proportions of plant and animal foods were 98.8% vs. 9.2% in 1980, and 79.5% vs. 20.5% in 2010, respectively (depicted by line graphs). Over the past 30 years, overall ratios of plant and animal foods have ranged from about 82 to 18 (Figure 3).
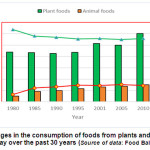 |
Figure 3: Changes in the consumption of foods from plants and animal origins per capita per day over the past 30 years (Source of data: Food Balance Sheet 2010). Click here to View figure |
Nutrient Intake
Trends in daily intakes of nutrients: According to the Food Balance Sheet of Korea and the results of Korea National Nutrition Survey, the energy intake of Koreans per person per day was 2,052 kcal in 1980 and 1,936 kcal in 1985. It has been at the range of 1,839 ~ 2000 kcal during the years from 1990 to 2010. In 2010, energy intake was slightly over 2,000 kcal (up to 2,066 kcal) (Table 1).
Table 1: Changes in the nutrient intake per capita per day over the past 30 years
| Nutrient | 19801) | 19852) | 19902) | 19952) | 20012) | 20052) | 20102) |
| Energy (kcal) | 2,052.0 | 1,936.0 | 1,868.0 | 1,839.0 | 1,880.8 | 1,979.1 | 2,065.8 |
| Protein (g) | 73.6 | 74.5 | 78.9 | 73.3 | 70.1 | 75.0 | 74.3 |
| Lipid (g) | 36.6 | 29.5 | 28.9 | 38.5 | 41.6 | 45.2 | 45.4 |
| Carbohydrate (g) | – | 342.0 | 316.0 | 295.0 | 294.5 | 301.1 | 323.1 |
| Calcium (mg) | 511.0 | 569.0 | 517.0 | 531.0 | 494.6 | 552.5 | 525.3 |
| Iron (mg) | 12.6 | 15.6 | 22.7 | 21.9 | 12.1 | 13.8 | 14.6 |
| Vitamin A (㎍RE) | 3,037(RE) | 1,846.0 | 1,662.0 | 443.0 | 619.4 | 781.3 | 800.0 |
| Thiamin (mg) | – | – | – | 1,270.8 | 1,307.9 | 1,394.0 | |
| Thiamin (mg) | 1.92 | 1.34 | 1.15 | 1.16 | 1.27 | 1.30 | 1.37 |
| Riboflavin | – | – | – | 1,145.3 | 1,212.0 | 1,292.0 | |
| Riboflavin (mg) | 1.03 | 1.2 | 1.3 | 1.2 | 1.1 | 1.2 | 1.3 |
| Niacin (mg) | 13.4 | 25.7 | 21.6 | 16.7 | 16.6 | 17.0 | 17.1 |
| Vitamin C (mg) | 125 | 64.7 | 81.2 | 98.3 | 133.2 | 99.1 | 105.1 |
Source of data: 1) Food Balance Sheet 2000. 2) Korea Statistics / Korea National Nutrition Survey, 1981~1995, and Korea National Health and Nutrition Examination Survey, 1998~2010, in the calculation of the age-standardized population of one-year or over.
According to the results of the new recommended standard during the years from 1998 to 2010, the proportions of the three energy nutrients in total energy intake is shown in Figure 4. The proportion of protein was 14.6 ~ 15.5%, lipid 18.2 ~ 20.3%, and carbohydrate 64.2 ~ 67.1%, respectively (Figure 4). No significant change was observed during these years. The averages of the three nutrients during these years are 14.9%, 18.9%, and 66.3%, respectively, which are appropriate for the ratio of energy used in food supply and demand assessment among Korean nutrition standards (KDRIs). It recommends 7 ~ 20% of energy intake from protein, 15 ~ 20% from lipid, and 55 ~ 65% from carbohydrate in adults 20 years old or over. However, it should be noted that the intake of lipids exceeds or is near its recommended level during this period.
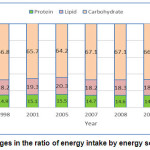 |
Figure 4: Changes in the ratio of energy intake by energy source nutrients Click here to View figure |
Trends in nutrient intake ratios to recommended levels (KDRIs): Table 2 shows the intake ratio of each nutrient to KDRIs in the survey years from 1998 to 2010. Overall, an average intake of energy was 92.6% and protein was 144% of the KDRIs. The intakes of phosphorous, iron, vitamin A, thiamine, riboflavin, niacin, and vitamin C were in the range of 92 ~ 159% of the recommended level, while the intakes of calcium and potassium were insufficient and sodium was much excessive.
The lower intakes of energy and riboflavin were almost overcome in 2010. However, calcium intake was still only 69.9% on average these years, much lower than the KDRIs. Further, the insufficient intake of calcium has prevalent for more than ten years. The intake level of sodium was excessive, more than three times, based on the AI, the adequate intake of KDRIs, and potassium intake was only 66.3% (87.9% vs. 58.6%) of the recommendation level.
Table 2: Trends in nutrient intake ratios to the Dietary Reference Intakes for Koreans (KDRIs)
| Nutrient | 1998 | 2001 | 2005 | 2007 | 2008 | 2009 | 2010 | Average |
| Energy | 91.4 | 90.1 | 96.5 | 88.5 | 90.5 | 91.1 | 99.9 | 92.6 |
| Protein | 114.8 | 122.6 | 166.9 | 145.3 | 147.6 | 148.9 | 163.5 | 144.2 |
| Calcium | 71.2 | 70.2 | 75.9 | 64.3 | 67.0 | 67.5 | 73.4 | 69.9 |
| Phosphorous | 149.9 | 161.1 | 172.4 | 151.4 | 156.6 | 157.6 | 169.4 | 159.8 |
| Sodium | – | – | 374.8 | 315.9 | 327.7 | 328.2 | 338.6 | 337.0 |
| Potassium | – | – | 60.7 | 59.1 | 61.9 | 61.9 | 87.9 | 66.3 |
| Iron | 91.8 | 95.2 | 127.7 | 121.3 | 122.9 | 123.7 | 139.9 | 117.5 |
| Vitamin A (㎍RE) | 92.1 | 94.6 | 121.7 | 112.6 | 119.7 | 118.7 | 122.7 | 111.7 |
| Thiamin | 123.8 | 117.9 | 122.8 | 115.6 | 115.9 | 117.5 | 129.9 | 120.5 |
| Riboflavin | 84.3 | 90.0 | 96.8 | 84.7 | 92.3 | 94.9 | 103.3 | 92.3 |
| Niacin | 108.9 | 118.1 | 120.6 | 103.6 | 106.7 | 108.7 | 120.3 | 112.4 |
| Vitamin C | 233.0 | 197.4 | 107.7 | 100.3 | 108.3 | 108.5 | 114.1 | 138.5 |
Source of data: Korea Statistics / Korea National Health and Nutrition Examination Survey, 1998-2010, in the calculation of the age-standardized population of one year or over.
It was found that males consumed the most of nutrients more than females. The energy intake of females (89%) was continuously lower than males (96%) (p < 0.05). The riboflavin intake of females (90%) was lower than males (97.1%) (p < 0.05), although both intake levels were up to 100% in 2010. The iron intake of females (94.9%) has been much lower than that of males (140%) (p < 0.05), but both intake levels were over 100% in 2010. Intakes of several other nutrients also showed gender differences (Figure 5).
The insufficient intake levels of calcium were observed in both genders, although the deficiency was more serious in female (p < 0.05). In 2010, calcium intake was still 78.0% in males, and 69.6% in females. The potassium intake of males was overcome up to 97.6% in 2010, but still only 78.2% for females (p < 0.05). Although the excessive intakes of sodium were found in both genders, it was much higher for males than for females (average: 388% vs. 285%) (p < 0.05) (Figure 5).
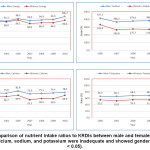 |
Figure 5: Comparison of nutrient intake ratios to KRDIs between male and females. The intakes of energy, calcium, sodium, and potassium were inadequate and showed gender difference (p < 0.05). Click here to View figure |
Discussion
Results show that there have been many changes in food supply and demand in South Korea over the past 30 years. In particular, changes in the supply of cereals, rice, meat, milk, fish and shellfish, and fats and oils are remarkable. The supply of cereals, rice, and starch roots have decreased, but the supply of meat, fish and shellfish, milk, fats and oils, and fruits and vegetables have increased. The most noticeable among them is the rate of animal food consumption. Though it was only 3% in 1969 and 9.2% in 1980, it has reached about 20% in 2010. As the supply and intake of meat, fish, shellfish, and milk have increased, the proportion of energy taken in as lipid has increased from 7% to 18% during the period. Similar results have been reported by Bhurosy and Jeewon.26
The annual supply of cereals per capita in 2010 was 145.1kg (397.5g per day), a decrease by 21.6% from 1980. In particular, the supply of rice, the main staple, has decreased by 38.7% from 1980. In addition, the supply of starch roots, which has been the second main energy source, has decreased by 35.8%. Food supply over the last 30 years shows that carbohydrate-based foods such as rice are still the largest portion of the Korean diet, but consumption of these foods is continuously declining. These changes make us assume that the grain-based Korean diet could also be decreased in the future. The gradual changes indicate a shift in trends from grain-based dietary to animal-based dietary. It can be said that the eating habits of Koreans, mainly focused on carbohydrates, transitioning to western style meals focused on protein and lipid due to improved economic growth and lifestyle changes.27, 28
The structure of nutrient intake has also changed together with changes in food consumption structure. Males had more nutrient intake than females, and some of the nutrient intakes showed a significant difference between genders. Low levels of energy intake compared to the recommendation in females is said to be related to their weight loss diet for body shaping, especially in the young generation. In terms of imbalance in nutrient intake, inadequate intake of calcium and sodium was not a problem of a specific gender or age but a nutritional problem of the whole population. The supply of milk has increased significantly to about five times (from 10.8 kg to 57.0 kg) over the past 30 years.6 but insufficient calcium intake is still present. Such insufficient calcium intake might have lasted more than 30 years. Although there was a significant difference in sodium intake between genders, the excessive intake of sodium (more than three times of KDIRs for males and more than two times of KDIRs for females) has been continued over the past decades and a nationwide serious public health problem.
The food self-sufficiency rate is known to be an important index for evaluating the extent of how well domestic food production responds to domestic food consumption. In this study, it is examined focusing on a quantity based self-sufficiency rate and the self-sufficiency rate of nutritional supply. The quantity-based self-sufficiency rate of rice has continuously increased from 85.7% in 1980 to 104.5% in 2010. However, the rate of cereals other than rice has decreased from 58.7% in 1980 to its half in 2010 (28.1%). For pulses, their quantity based self-sufficiency rate was 47.3% in 1980, and it’s quarter (11.0%) in 2010. In 2010, their quantity based self-sufficiency rate was 90.1% for vegetables and 81.0% for fruit, relatively high, followed by meat 78.6%, fish and shellfish 68.1% and milk 66.3%. On the other hand, the quantity-based self-sufficiency rate of seaweeds was 119.8%, eggs 99.7%, and starch roots 98.4%, respectively. For edible fats and oils, which have been heavily depended on imports, their rate was 17.9% in 1980, 8% in 1990 and 3.0% in 2000, but only 2.6% in 2010.
Seaweeds, eggs, and starchy roots are mostly covered by domestic products. The quantity-based self-sufficiency rate of rice is satisfactory, whereas for grains excluding rice, and pulses, significant portions of their consumptions are covered by imports. For meat, the quantity-based self-sufficiency rates of pork and chicken are around 80%, but the rate of bovine meet varies from 40% depending on a rise and fall of domestic beef production and the amount of imported beef. For fish and shellfish, their rate is fluctuant depending on varying marine environment caused by climate change.29-32
As the share of domestic supply has declined for each food, the share of domestic food consumption has also declined in whole food consumption. As a result, the rate of nutrition self-sufficiency is gradually decreasing. Especially in the long term, the domestic food supply of rice and other major grains is decreasing, which can adversely affect food self-sufficiency. A decrease in the food self-sufficiency rate has been an important issue because it is one of the major factors directly affecting food security. It should also be noted that westernized dietary habits have greatly increased, and consequently, the intake of lipids has reached the maximum of its recommended level. It should be warned that the consequence is highly likely to have a negative impact on public health, such as the occurrence of many chronic degenerative diseases. In this regard, countermeasures and strategies to public health are needed both for production and consumption. Rice is the main staple and a major food source for Koreans and is very important for food security.33 It is said that rice provides up to 50% of the dietary caloric supply for Asians.27, 34 As a result of this study, rice is now supplying about 32.7% of calories to Koreans, which is much lower than that of Asians. Further, changing rate of per capita rice consumption (direct consumption) in South Korea was -1.83% from 1992 to 2002.28 The trends are opposite to the current situation in western countries where consumption of rice is increasing..
Conclusion
There has been a noticeable shift in nutrient intake from cereal-based food to meat and fats and oils with a substantial intake of lipid. The supply of cereal has also decreased. Although rice consumption is still the largest proportion, it has declined to one-third of total energy intake, which is much lower than that of Asians. In addition, insufficient calcium intake and excessive sodium intake have been prevalent for more than a decade. These long-standing patterns would eventually further increase the potential risk of obesity, osteoporosis, and hypertension of Koreans in the future. Dedicated efforts should be made in terms of food production and consumption to maintain and promote the health of Koreans. On the production side, establishing a stable supply chain of agricultural products and improving quality competitiveness would be important. On a consumption side, we should raise awareness of consumption of agricultural products in Korea promoting healthy diets via nutrition education, and disseminating healthy traditional Korean food. We believe that through such efforts and promotion it will be possible to strengthen food security, to preserve traditional dietary pattern, and to maintain the health of Korean people.
Author Contributions
J.G. Kim (author 1) conceived and designed the study. J.S. Kim (author 2) analyzed the data. Both authors contributed to writing a draft and reviewing the manuscript. J.G. Kim (author 3) reviewed, edited, and revised the draft, and completed the final version of the manuscript.
Funding
This research received no external funding.
Conflicts of Interest
The authors declare no conflict of interest.
References
- S. National Library of Medicine / National Center for Biotechnology Information, DRI Dietary Reference Intakes: Applications in Dietary Assessment – 3. Using Dietary Reference Intakes for Nutrient Assessment of Individuals. Washington (DC): National Academies Press (US); 2000.
- Health at a Glance 2017: OECD Indicators. Paris: OECD Publishing; 2017.
- Ministry of Health and Welfare of Korea (MOHW) / Korea Institute for Health and Social Affairs. OECD Health Statistics 2017. Sejong: MOHW; 2017.
- Benyaich, A. The effects of the Mediterranean diet on chronic diseases: cardiovascular diseases, oxidative stress, dyslipidemia, diabetes mellitus, blood pressure, cancer, neurodegenerative disease and obesity. JAAR. 2017: 2(6):333–355. http://dx.doi.org/10.21839/jaar.2017.v2i6.122
CrossRef - Statistics Korea. Prevalence of Obesity in South Korea, 2016. Daejeon: Korea National Statistics Office; 2018. http://www.index.go.kr/potal/main/EachDtlPageDetail.do?idx_cd=2705. [Accessed April 24, 2018].
- Statistics Korea. Causes of Death in South Korea, 2010. Daejeon: Korea National Statistics Office; 2018. http://www.index.go.kr/potal/main/EachDtlPageDetail.do?idx_cd=1012. [Accessed April 24, 2018].
- International Agency for Cancer Research (IARC). IARC Monographs on the Evaluation of Carcinogenic Risk to Humans. Lyon: IARC; 2014.
- World Health Organization (WHO). Global status report on non communicable diseases 2010. Geneva: WHO; 2011.
- WHO Western-Pacific Region. Cardiovascular diseases: Risk factors for cardiovascular disease. Manila: WHO Western-Pacific Region; September 2011. http://www.wpro.who.int/mediacentre/factsheets/cardiovascular_disease/en/. [Accessed April 24, 2018].
- Ministry of Health and Welfare of Korea (MOHW). Korea National Nutrition Survey 1990. Seoul: MOHW.
- Ministry of Health and Welfare of Korea / Korea Health Industry Development Institute (KHIDI). Korea National Health and Nutrition Examination Survey 1998. Seoul: KHIDI.
- Ministry of Health and Welfare of Korea / Korea Centers for Disease Control and Prevention (KCDC). Korea National Health and Nutrition Examination Survey 2010. Cheongju / Osong: KCDC; 2012.
- Haeng-Shin Lee, Sung-ok Kwon, Miyong Yon, Dohee Kim, Jee-Yeon Lee, Jiwoon Nam, Seung-joo Park, Jee-young Yeon, Soon-kyu Lee, Hye-young Lee, Oh-sang Kwon and Cho-il Kim. Dietary total sugar intake of Koreans: Based on the Korea National Health and Nutrition Examination Survey (KNHANES), 2008-2011. J Nutr Health. 2014;47(4):26-276. http://dx.doi.org/10.4163/jnh.2014.47.4.26.
CrossRef - Cheon S. Y., Wang H. W., Lee H. J., Hwang K. M., Yoon H. S., Kang Y. J. Relationship of sodium consumption with obesity in Korean adults based on Korea National Health and Nutrition Examination Survey 2010~2014. J Nutr Health. 2017;50(1):64-73. http://dx.doi.org/10.4163/jnh.2017.50.1.64.
CrossRef - Park B., Kang H-C., Kang D. R., Jee S. H. Associations between parental and adult-offspring obesity in South Korean population. J Health Info Stat. 2012;37(2):1-11.
- Jin H-J., Seong M-G., Park M-K. The relationship between body mass index and periodontal disease in Korean adults using Korea National Health and Nutrition Survey. J Korean Soc Oral Health Sci. 2017;5(1):53-57.
- Shin J. Y., Kim J-M., Kim Y. The association of heavy metals in blood, fish consumption frequency, and risk of cardiovascular diseases among Korean adults: The Korean National Health and Nutrition Examination Survey (2008-2010). Korean J Nutr. 2012;45(4):347-361. http://dx.doi.org/10.4163/kjn.2012.45.4.347.
CrossRef - Kim S-B., Kim S-K., Kim S-N., Cho Y-S., Kim M-H. Establishment of one portion size of dishes frequently consumed by Korean adult – focusing on rice, noodles, soups, and stews. Korean J Food Nutr. 2013;26:745-752. http://dx.doi.org/10.9799/ksfan.2013.26.4.745
CrossRef - Youn E., Paik J. K., Kim B. Utilization of Korea National Health and Nutrition Examination Survey Database: Estimation of tomato consumption and the risk of metabolic syndrome. Food Eng Prog. 2014;8(2):109-115. DOI http://dx.doi.org/10.13050/foodengprog.2014.18.2.109.
CrossRef - Joo N. S., Dawson-Hughes B., Kim Y. S., Oh K., Yeum K. J. Impact of calcium and vitamin D insufficiencies on serum parathyroid hormone and bone mineral density: analysis of the fourth and fifth Korea National Health and Nutrition Examination Survey (KNHANES IV-3, 2009 and V-1, 2010). J Bone Miner Res. 2013;28:764-770.
CrossRef - Korea Rural Economic Institute (KREI). Food Balance Sheet 2010. Naju: KREI, 2011.
- Statistics Korea. National nutrition status. Daejeon: Korea National Statistics Office; 2015. http://www.index.go.kr/potal/main/EachDtlPageDetail.do?idx_cd=2765. [Accessed April 24, 2018]
- Statistics Korea. Korea National Health and Nutrition Examination Survey: 2015 report of quality management for statistics. Daejeon: Korea National Statistics Office; 2015.
- Korea Centers for Disease Control and Prevention (KCDC). Korea National Health and Nutrition Examination Survey: Guidebook for data users. Cheongju: KCDC; 2015.
- Nam G. E. Consideration in analysis of Nutrition Survey Data from Korea National Health and Nutrition Examination Survey. Korean J Fam Pract. 2017;7(1):1-2.
CrossRef - Bhurosy T., Jeewon R. Changes in eating habits and food traditions of Indo-Mauritians. Ind J Traditional Knowledge. 2016;15:355-362.
- Muthayya S., Sugimoto J. D., Montgomery S., Maberly G. F. An overview of global rice production, supply, trade, and consumption. Ann NY Acad Sci. 2014;1324:7–14.
CrossRef - World Food Statistics and Graphics. World per capita and total rice consumption. http://worldfood.apionet.or.jp/graph/index.html. [Accessed April 24, 2018].
- Ministry for Food, Agriculture, Forestry and Fisheries (MFAFF). Major Statistics in Agriculture, Food, Forestry and Fisheries. 2011. Gwacheon: MFAFF; 2011.
- Perry A. L., Low P. J., Ellis J. R.Reynolds J. D. Climate change and distribution shift in marine fishes. Science. 2005;308:1912-1914.
CrossRef - Kim J. G., Kim J. S. Climate change and expansion of squids catches in Korea. J Environ Health Sci. 2017;43(6):516-524.
- Kim J. G., Kim J. S. Climate change and depletion of walleye pollock resources in the East Sea. J Environ Health Sci. 2018; 44(3):259-266.
- The Food and Agriculture Organization of the United Nations (FAO). Food Security Information for Action Practical Guides: An introduction to the basic concepts of food security. Rome: EC-FAO Food Security Programme; 2008.
- The Food and Agriculture Organization of the United Nations (FAO) and the Pan American Health Organization (PAHO). 2016 edition of the Panorama of Food and Nutritional Security in Latin American and Caribbean. Santiago: PAHO; 2017.
Accepted on: 16-04-2019
Second Review by: Prof. Monica BUTNARIU Romania
Final Approval by: Prof. Min-Hsiung Pan and Dr. Rajesh Jeewon


Web of Science Coverage
Emerging Sources Citation Index (ESCI)
2024 Journal Impact Factor: 1.1
Scopus Journal Metrics
CiteScore 2025: 2.6
CiteScore Details
Sustainable Nutrition: Food Systems, Nutrient Retention, and Public Health Impact
![]()
This journal is a member of, and subscribes to the principles of, the Committee on Publication Ethics (COPE)


