Prevalence and Associated Factors of Hypertension among Adults in Rural Uttarakhand: A Community Based Cross Sectional Study
Vinita Thapliyal1
, Anil Joshi2 1Amity Institute of Food Technology, Amity University, Noida
2Himalayan Environmental Studies and Conservation Organization (HESCO)
Corresponding author Email: ksingh11@amity.edu
DOI : http://dx.doi.org/10.12944/CRNFSJ.6.2.22
Download this article as:
![]()
India is in a state of transition epidemiological, economic, and demographic and nutrition transition. And all these transitions are leading to non communicable diseases like obesity, hypertension and insulin resistance. The study was aimed to estimate the Prevalence of hypertension and its associated risk factors among adults of rural Uttrakhand.
It is a cross sectional community based study. Survey was conducted in rural areas of Uttrakhand, to make a sample size of 300 adults (18-45yr), using WHO STEPS questionnaire. Waist Circumference, Blood pressure, Body Mass Index of the participants was calculated. P value < 0.05 was considered significant.
In the sample population based on systolic BP, 61.3% were non-hypertensive, 29.7% were pre-hypertensive and 9% were hypertensive. Based on diastolic BP, 43.3% were non-hypertensive, 32.7% were pre-hypertensive and 24% were hypertensive. Subjects with hypertension and pre-hypertension have higher BMI and waist circumference.
A high prevalence rate of pre-hypertension and hypertension was depicted in rural areas of Uttrakhand region.4.8% of the female participants had systolic high blood pressure compared to the 11.9% of the male participants. On the other hand, 21.8% of the female participants had diastolic high blood pressure compared to the over 25% of the male participants.
Cross Sectional; Prevalence; Rural Uttarakhand
Introduction
Hypertension is one of the most important causes of the total disease burden in the world.1 According to large observational studies, hypertension is thus associated with high incidence of cardiovascular disease, such as stroke, ischemic heart disease, and other vascular diseases.2,5 An increased incidence of cardiovascular disease has in fact been seen in relation to blood pressure levels across the entire blood pressure distribution,6,8 also within the normal blood pressure range.9,11 For half a century, treatment and awareness of high blood pressure has been insufficient, as described by “The rule of halves”12,14 meaning that only half of those identified with hypertension were aware of their condition, and only half of those aware were treated, and of those treated only half achieved treatment goals. Even though treatment has contributed to a reduction of cardiovascular events, the control of high blood pressure and hypertension can still be improved.15 The risk of becoming hypertensive in later life is considerable, as studies from almost all high-income countries have shown that blood pressure rises with increasing age.16,17 The incidence of hypertension is likely to vary depending on the initial blood pressure18 and the intra-individual variation of blood pressure measurements.19,20
Although there are subjects in whom the hypertension can be traced to an underlying disease, i.e. secondary hypertension, those cases are rare and most hypertensive cases have primary hypertension.21 Primary hypertension stems from interaction between multiple genetic and environmental factors, involving complex path genetic mechanisms.22 More recent studies in twins23,24 have concluded that approximately 60% of the family association of blood pressure is explained by shared genes and approximately 40 % by shared environment. Thus, even though genetics might account for the largest impact, there is still a major influence of lifestyle and environmental factors,25,27 which are potentially preventable.
Moderate alcohol consumption is known to reduce cardiovascular mortality28 and also seems to have a beneficial effect on blood pressure, at least in women.29 Previous studies have identified biological mechanisms that would explain the beneficial effect of alcohol on blood pressure, such as anti-inflammatory effects30 and positive changes in lipid metabolism,31,33 which support a causative effect. However, an excessive intake raises blood pressure and causes other problems34. In the World Health Organization Global Burden of Disease 2000 Comparative Risk Analysis study,35 16% of all hypertensive disease was attributed to the consumption of alcohol.
Associations between body mass index (BMI) and blood pressure are generally acknowledged36,37 and have been found to be almost linear.38 Some studies suggest that weight gain may account for 65-75 % of the incidence of human essential hypertension.39 The evidence for a protective effect of physical activity with regard to development of hypertension40,43 and CVD33 is well established; however, most people in industrialized societies are unfortunately becoming less physically active in their daily lives.44 Physical activity not only acts directly on blood pressure,45 but also indirectly through its beneficial influence on body weight and insulin resistance,46,47 thus making it an important factor to consider.
It is well established that the experience of perceived stress is accompanied by an increase in blood pressure, which is a completely normal physiological adaptation.48 Animal studies show that chronic stress induces also a permanent blood pressure increase, and some behavior-based approaches to stress management, such as meditation, yoga and muscular relaxation, have shown moderate decreases in elevated blood pressure.49
Uttrakhand is a geographically ecologically frail, economically inchoate, and compactly populated mountain ecosystem. With fast growing urbanization and development of infrastructure, connectivity to the villages is more and therefore area has undergone urbanization in a rapid way and with this there is easy access to markets. Hence, major area of cultivated land and are being used for more infrastructure expansion, services activities, and economic activities in the hilly region.50 There is moderate regional transition from farming of traditional crop and animal husbandry system to locally yielded vegetables, fruits and milk for sale in townified, urban locale. This affects the conventional land use model. The shift in the pattern of physical activity and dietary changes is main reason of demographic and socio-economic changes.50
Uttarakhand is a diverse state with varied terrains and compact population density in plain region. Demographic shift is pointing a transition in population dynamics homologues with socio economic growth (i.e. rising economies, education, employment, improvement in health status and life expectancy and changes in life style). This has been coincided by an epidemiological shift.51 Despite increase in life expectancy, there is a steady growth in chronic diseases of aging and life-styles related diseases such as hypertension, stroke, diabetes, and other cardiovascular diseases. The various studies have shown the emergence of the epidemiological shift has often been linked with epidemics of degenerative heart diseases (including hypertension, ischemic heart diseases, and CVD), type 2 diabetes mellitus, and other chronic diseases.
Weather conditions results in various contradictory life-style practice and lead to practices like smoking, tobacco consumption, alcohol consumption, consumption of fruits and vegetables not grown locally52 this give rise to a high prevalence rate of non-communicable diseases.50
The study was undertaken to find the prevalence and associated risk factors of hypertension. The study would aid in generating the data regarding obesity, hypertension in a rural area and hence would initiate timely precautionary measures to reduce the adverse health effects.
Material and Methods
Study Tool
A locally adapted, pre- tested, and Hindi translated WHO adapted step questionnaire was used to carry out the survey. It has following parameters tobacco intake, alcohol intake, diet, physical activity, related history with treatment of hypertension and diabetes were collected. Asian cut off of waist circumference (WC) and Body Mass Index were computed.
Study Detail
A survey was conducted in village population of the Uttrakhand state. For the study, 300 adults (18-45 years) of age using purposive and incidental sampling techniques were selected. Sample size of 300 was collected because it is more than 10% of the population (18-45years). In a village households were visited personally and one man and woman from eligible age groups were selected. If there is more than one eligible candidate present in a particular household, the random selection was done.
Data Collection
The collection of data was done using WHO STEPS questionnaire approach. Interview technique was used by the investigator. Confidentiality of the information was ensured and consent form was filled by all the investigators. Anthropometric measurements and variables such as weight (kilograms) using Karda digital weighing scale, height (centimeters) using stadia meter and WC (waist circumference in centimeters) were recorded using standard procedures were measured in a separate room. BMI (kg /m2) was calculated (53) the latest classification of BMI for Asian populations was used to define overweight (23-24.99kg/m2) & obesity (> 25 kg/m2). (54) Waist Hip Ratio >0.90 in men and >0.80 in women was taken as high and used to define central obesity.55
Blood pressure was measured using a Mercury Sphygmomanometer. The readings of blood pressure were taken twice with the subject sitting in a relaxed sitting and average of both reading was taken. Hypertension was classified using JNC -8 criteria.56
Sample Size
The sample size calculated was 269 with confidence interval of 90% and margin of error 5 %. Formula used for the calculation is as under:
Sample Size = z2 x p (1-p)
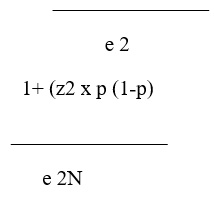
Where N = Population Size
e = Margin of error
Z = z score
The calculated sample size was 269 but a total of 300 participants were included for the study. Consent form was obtained from each study participant.
Definition and Diagnostic Criteria
Hypertension was calculated using JNC 8 criteria.57 Using the systolic BP, adults were classified as normotensive if they had systolic BP <119 mmHg, pre-hypertensive if they had systolic BP of 120-139 mmHg and hypertensive if they have systolic BP of >140 mmHg. Using the diastolic BP, adults were classified as normotensive if they had diastolic BP <79 mmHg, pre-hypertensive if they had diastolic BP of 80-89 mmHg and hypertensive if they have diastolic BP of >90 mmHg.
Data Analysis
Data analysis was carried out using SPSS version 17.0. Pearson’s Chi‑square test was used to evaluate differences between groups for categorized variables. Normally distributed data was 90% confidence intervals. Frequency distribution and cross tabulation was done to find the relationship with categorical variables. The chi square test was used and level of significance p was 0.05 (p < 0.05).
Results
Out of 300 adults 44(14.7%) were hypertensive with significant higher percentage of males 32(18.2%) as compared to females 12(9.7%)
Socio Demogrophic
Table 1 shows the socio demographic profile of the subject. Out of the 300 adults, 176 (58.7%) were males whereas 124 (41.3%) were females. Uttrakhand has majority of Hindu population 95% were Hindu, 2.7% were Muslims and 2.3% were Sikh. Of the 300 adults in the study, 225 (75.5%) were married, 65 (21.7%) were unmarried whereas 8 (2.7%) were divorced or widowed or separated. Only 4% of the population had not attended school. It was found out of 300, that 28 (9.3%) were government employee.
Table 1: Socio demographic Characteristics of the Study Subjects
| Variable | Sub Group | N | % | P Value |
| Gender | Male | 176 | 58.7 | <0.01 |
| Female | 124 | 41.3 | ||
| Religion | Hindu | 285 | 95 | <0.01 |
| Muslim | 8 | 2.7 | ||
| Sikh | 7 | 2.3 | ||
| Marital Status | Married | 225 | 75.5 | <0.01 |
| Unmarried | 65 | 21.5 | ||
| Divorced/Widow/Separated | 8 | 2.7 | ||
| Education | Attended | 288 | 96 | <0.01 |
| Non Attended | 12 | 4 | ||
| Occupation | Government Employee | 28 | 9.3 | <0.01 |
| Nongovernment Employee | 68 | 22.7 | ||
| Self Employed | 100 | 33.3 | ||
| Non Paid | 1 | 0.3 | ||
| Home Maker | 40 | 13.3 | ||
| Unemployed able to work | 17 | 5.6 | ||
| Student | 40 | 13.3 |
Modifiable Risk Factors
Anthropometric Characteristics
The mean age of the adults in the current study was 32.2±8.9 years. The mean height was 160.8±8.7 cm, weight was 61.6±9.9 kg, BMI was 23.7±2.7 kg/m2 and waist circumference was 84.7±10.5 cm. Height, weight and waist circumference was significantly higher in males as compared to females (p<0.05). There was no significant difference in age or BMI between males and females (p>0.05)
Table 2: Anthropometric characteristics of study population
| Males(n=176) | Females(n=124) | P value | |
| Age (years) | 33.8±8.9 | 34.9±9.0 | 0.837 |
| Height (cm) | 166.2±6.1 | 153.2±5.7 | 0.001 |
| Weight (kg) | 65.4±9.2 | 56.1±8.1 | 0.001 |
| BMI (kg/m2) | 23.6±2.6 | 23.8±2.8 | 0.528 |
| Waist circumference (cm) | 86.7±9.3 | 81.8±11.4 | 0.001 |
Data presented as Mean±SD
Behavioral and Associated Risk Factors
Table 2B shows the behavioral modifiable risk factors of the study group. Various modifiable risk factors analyzed were smoking of tobacco products, smokeless tobacco, alcohol consumption, fruits and vegetable consumption, history of diabetes, BMI and waist circumferences. Off the 300 adults in the current study, 82 (27.6%) smoked tobacco products. Significantly higher percentage of males [81 (46.8%)] smoked tobacco products as compared to females [1 (0.8%)] Of the 82 people who smoked, 79 (96.3%) smoked daily whereas 3 (3.7%) smoked but not daily. 77 (25.7%) reported to be consuming alcohol in the last 12 months. Significantly higher percentage of males consumed alcohol [75 (43.4%)] as compared to females [2 (1.7%)]. About 13.6 % of the population was having history of diabetes. Only 23 % of the population consumed fruits 7days/week and about 73% males and females consumed vegetable 7 days/ week i.e. consumed vegetables.
Table 3: Behavioral and Other Characteristics of Study Population
| Variable | N | % | χ2(p value) |
| Smoke TobaccoFrequency | 8279 | 26.796.3 | 76.517(<0.01) |
| Alcohol Use in past 12 months | 77 | 25.7 | 64.045(<0.01) |
| Brisk walk or cycling for 30 minutes | 223 | 74.3 | 1.679(0.195) |
| History of Diabetes | 41 | 13.6 | 0.484(0.487) |
| Consumption of Fruits 7 days a week | 66 | 22 | 7.368(0.288) |
| Consumption of Vegetables 7 days a week | 220 | 73.3 | 1.754(0.941) |
Table 4 gives correlation of age and anthropometry with vital statistics. There was a significant positive correlation of pulse rate with age in males (p<0.05). There was also a significant positive correlation of weight with diastolic BP in males (p<0.05). BMI was also significantly positively correlated with systolic and diastolic BP in males (p<0.05). There was no significant correlation of waist circumference with vital statistics in males (p>0.05). There was also no correlation of anthropometry with vital statistics in females.
Table 4: Correlation of age and anthropometry with vital statistics when classified according to gender
| Males (n=176) | Females (n=124) | |||||
| Systolic BP | Diastolic BP | Pulse Rate | Systolic BP | Diastolic BP | Pulse Rate | |
| Age | 0.122 | 0.090 | 0.265* | 0.064 | 0.055 | 0.121 |
| Weight | 0.139 | 0.172* | 0.050 | 0.053 | 0.021 | 0.064 |
| BMI | 0.194* | 0.207* | 0.085 | 0.115 | 0.04 | 0.049 |
| Waist circumference | 0.065 | 0.092 | 0.01 | 0.117 | -0.015 | 0.054 |
Data presented as Pearson Correlation Value. *p <0.05
Table 5 depicted the regression analysis which shows the presence or absence of Hypertension as the dependent variable and age, BMI, vegetable intake frequency, use of alcohol, smoking, presence of diabetes as independent variables. Analysis revealed that in the population of BMI was significantly associated with hypertension (OR 1.311, 95% CI; 1.035–1.662).BMI was significantly correlated with systolic BP in adults (p<0.05). Diastolic BP was significantly positively correlated with age and BMI in adults (p<0.05). Age was positively significantly correlated with pulse rate in adults (p<0.05). Thus, in Uttrakhand with higher BMI, the risk hypertension increases by 1.3 times.
Table 5: Multivariate Analysis for Risk Factor of Hypertension
|
Variables in the Equation |
||||
| Exp(B) | 95.0% C.I.for EXP(B) | |||
| Lower | Upper | |||
| Step 1a | Gender(1) | 1.730 | .528 | 5.663 |
| Age | 1.001 | .931 | 1.075 | |
| Diabetes (1) | 1.171 | .299 | 4.586 | |
| Smoking (1) | .548 | .046 | 6.555 | |
| alcohol_12_months (1) | 2.145 | .180 | 25.603 | |
| BMI | 1.311 | 1.035 | 1.662 | |
| veg_freq_code (1) | 2.930 | .284 | 30.271 | |
Variables entered on step 1: Gender, Age, diabetes, smoke, alcohol_12_months, BMI, veg_freq_code.
Discussion and Conclusion
The present study demonstrated the prevalence of hypertension which was found significantly high among adults.58 Studies shows a significant association of hypertension with age.59 In the present study, the unacceptably high rates of hypertension and BMI were detected among the population of the rural areas. This study outlines remarkable positive correlation between all the anthropometric factors (weight, BMI) and systolic and diastolic blood pressure except for waist circumference. Many researchers have already reported positive correlation of body mass index with hypertension (systolic and diastolic).38
Among modifiable factors, no significant association was shown with tobacco and alcohol intake. This is inconsistent with other findings where tobacco use alcohol consumption has been found to be associated with hypertension.34
The major point of this study was to deduce the prevalence of hypertension and to find associated risk factors in different rural zones of Uttrakhand. This study concluded to create the behavior changes and modification in life style and various discussed modifiable risk factors so that the prevalence of Hypertension can be reduced in the population.
In cessation, the study showed that more than 40 % population in our rural area has high BMI. There are alarming rates of high BMI and obesity among women and youth, signifying where targeted actions should be taken. Owing to the effective alliance of hypertension with lower BMI cut-off value (less than 23 kg/m2), this study uses Asian-specific cutoff for the defining levels of overweight and obesity among the population. This call an immediate attention and action at the state and also at national level to control the problem of Non communicable disease especially hypertension among Asian countries.
Limitations
Lack of specific data on stress levels is a major limitation of the study. Any causal association cannot be derived from the present cross-sectional study design. More research with appropriate study design is needed to find if any causal association exists between hypertension and the discussed variables.
Acknowledgements
This study has received no financial or editorial support.
Conflict of Interest
There is no potential conflict of interest involved in this research
References
- Lim SS, Vos T, Flaxman AD, Danaei G, Shibuya K, Adair-Rohani H, et al. A comparative risk assessment of burden of disease and injury attributable to 67 risk factors and risk factor clusters in 21 regions, 1990–2010: a systematic analysis for the Global Burden of Disease Study 2010. Lancet. 2012;380:2224-60.
CrossRef - Stokes J 3rd, Kannel WB, Wolf PA, D’Agostino RB, Cupples LA. Blood pressure as a risk for cardiovascular disease. Hypertension. 1989;13(5 suppl):I13-8.
CrossRef - Kannel WB, Wolf PA, Verter J, McNamara PM. Epidemiologic assessment of the role of blood pressure in stroke. The Framingham study. JAMA. 1970;214:301-10.
CrossRef - Kannel WB, Castelli WP, McNamara PM, McKee PA, Feinleib M. Role of blood pressure in the development of congestive heart failure. The Framingham study. NEJM. 1972;287:781-7.
CrossRef - Whelton PK, Perneger TV, Brancati FL, Klag MJ. Epidemiology and prevention of blood pressure-related renal disease. J Hypertens Suppl. 1992;10:S77-84.
CrossRef - MacMahon S, Peto R, Cutler J, Collins R, Sorlie P, Neaton J. Blood pressure, stroke, and coronary heart disease. Part 1. Prolonged differences in blood pressure: prospective observational studies corrected for the regression dilution bias. Lancet. 1990;335:765-74.
CrossRef - Lewington S, Clarke R, Qizilbash N, Peto R, Collins R. Prospective Studies Collaboration. Age-specific relevance of usual blood pressure and vascular mortality: a meta-analysis of individual data for one million adults in 61 prospective studies. Lancet. 2002;360:1903-13.
CrossRef - Staessen JA, Li Y, Thijs L, Wang JG. Blood pressure reduction and cardiovascular prevention: an update including the 2003-2004 secondary prevention trials. Hypertens Res. 2005;28:385-407.
CrossRef - Vasan RS, Larson MG, Leip EP, Evans JC, O’Donnell CJ, Kannel WB, et al. Impact of high-normal blood pressure on the risk of cardiovascular disease. NEJM. 2001;345:1291-7.
CrossRef - Liszka HA, Mainous AR 3rd, King DE, Everett CJ, Egan BM. Prehypertension and cardiovascular morbidity. Ann Fam Med. 2005;3:294-9.
CrossRef - Zhang Y, Lee ET, Devereux RB, Yeh J, Best LG, Fabsitz RR, Howard BV. Prehypertension, diabetes, and cardiovascular disease risk in a population based sample: the Strong Heart Study. Hypertension. 2006;47:410-4.
CrossRef - Wilber JA, Barrow JG. Hypertension: A community problem. Am J Med. 1972;52:653-63.
CrossRef - Hart JT. Semicontinuous screening of a whole community for hypertension. Lancet. 1970;2:223-6.
CrossRef - Smith WC, Lee AJ, Crombie IK, Tunstall-Pedoe H. Control of blood pressure in Scotland: The rule of halves. BMJ. 1990;300:981-3.
CrossRef - Lindblad U, Ek J, Eckner J, Larsson CA, Guangliang S, Råstam L. Prevalence, awareness, treatment and control of hypertension – rule of thirds in The Skaraborg Project. SJPHC. 2011;30:88–94.
- Franklin SS, Izzo JL. Aging, hypertension, and arterial stiffness. In: Izzo JL, Black HR, Council for High Blood Pressure Research (AHA), eds. Hypertension Primer: The Essentials of High Blood Pressure, 3rd edition. Lippington Williams & Wilkins. 2003: pp 170-4.
- Vasan RS, Beiser A, Seshadri S, Larson MG, Kannel WB, D’Agostino RB, et al. Residual lifetime risk for developing hypertension in middleaged women and men: The Framingham Heart Study. JAMA. 2002;287:1003-10.
CrossRef - Wu M, Ware JH, Feinleib M. On the relation between blood pressure change and initial value. J Chronic Dis. 1980;33:637-44.
CrossRef - Weissfeld JL, Kuller LH. Methodologic evaluation of incidence rates for hypertension: calculated for Pittsburgh’s MRFIT usual care men. J Chron Dis. 1985;38:915-25.
CrossRef - Vasan RS, Larson MG, Leip EP, Kannel WB, Levy D. Assessment of frequency of progression to hypertension in non-hypertensive participants in the Framingham Heart Study: a cohort study. Lancet. 2001;358:1682-6.
CrossRef - Labarthe DR. Epidemiology and prevention of cardiovascular diseases: A global challenge. Aspen Publishers Inc, Gaithersburg, Maryland, USA. 1998.
- Kurtz TW, Spence MA. Genetics of essential hypertension. Am J Med. 1993;94:77-84.
CrossRef - Fagard RH, Loos RJ, Beunen G, Derom C, Vlietinck R. Influence of chorionicity on the heritability estimates of blood pressure: a study in twins. J Hypertens. 2003;21:1313-8.
CrossRef - Kupper N, Willemsen G, Riese H, Posthuma D, Boomsma DI, de Geus EJ. Heritability of daytime ambulatory blood pressure in an extended twin design. Hypertension. 2005;45:80-5.
CrossRef - Mancia G, Fagard R, Narkiewicz K, Redon J, Zanchetti A, Böhm M, et al. 2013 practice guidelines for the management of arterial hypertension of the European Society of Hypertension (ESH) and the European Society of Cardiology (ESC): ESH/ESC Task Force for the Management of Arterial Hypertension. J Hypertens. 2013;31:1925-38.
CrossRef - National Clinical Guidance Centre, Hypertension (NICE CG 127). National Institute for Health and Clinical Excellence. 2011. http://www.nice.org.uk/nicemedia/live/13561/56007/ 56007.pdf.
- James PA, Oparil S, Carter BL, Cushman WC, Dennison-Himmelfarb C, Handler J, et al. 2014 Evidence-based guideline for the management of high blood pressure in adults: Report from the panel members appointed to The Eighth Joint National Committee (JNC 8). JAMA. 2014;311:507-20.
CrossRef - Ronksley PE, Brien SE, Turner BJ, Mukamal KJ, Ghali WA. Association of alcohol consumption with selected cardiovascular disease outcomes: a systematic review and meta-analysis. BMJ. 2011;342:d671.
CrossRef - Taylor B, Irving HM, Baliunas D, Roerecke M, Patra J, Mohapatra S, et al. Alcohol and hypertension: gender differences in dose-response relationships determined through systematic review and meta-analysis. Addiction. 2009;104:1981-90.
CrossRef - Raum E, Gebhardt K, Buchner M, Schiltenwolf M, Brenner H. Long- term and short-term alcohol consumption and levels of C-reactive protein. Int J Cardiol. 2007;121:224-6.
CrossRef - Brien SE, Ronksley PE, Turner BJ, Mukamal KJ, Ghali WA. Effect of alcohol consumption on biological markers associated with risk of cardiovascular disease: systematic review and meta-analysis of interventional studies. BMJ. 2011;342:d636.
CrossRef - Langer RD, Criqui MH, Reed DM. Lipoproteins and blood pressure as biological pathways for effect of moderate alcohol consumption on coronary heart disease. Circulation. 1992;85:910-5.
CrossRef - Rimm EB, Williams P, Fosher K, Criqui M, Stampfer MJ. Moderate alcohol intake and lower risk of coronary heart disease: meta-analysis of effects on lipids and haemostatic factors. BMJ. 1999;319:1523-8.
CrossRef - Beilin LJ, Puddey IB. Alcohol and hypertension: an update. Hypertension. 2006;47:1035-8.
CrossRef - Rehm J, Room R, Monteiro M, Gmel G, Graham K, Rehn N, et al. Alcohol as a risk factor for global burden of disease. Eur Addict Res. 2003;9:157–64.
CrossRef - Kannel WB. Risk stratification in hypertension: new insights from the Framingham study. Am J Hypertens. 2000;13(1 Pt 2):3S-10S.
CrossRef - Huang Z, Willett WC, Manson JE, Rossner B, Stamper MJ, Speizer FE, et al. Body weight, weight change, and risk of hypertension in Ann Intern Med. 1998;128:81-8.
- Hall JE. The kidney, hypertension, and obesity. Hypertension. 2003;41:625-33.
CrossRef - Garrison RJ, Kannel WB, Stokes J 3rd, Castelli WP. Incidence and precursors of hypertension in young adults: the Framingham Offspring Study. Prev Med. 1987;16:235-51.
CrossRef - Barengo NC, Hu G, Kastarinen M, Lakka TA, Pekkarinen H, Nissinen A, et al. Low physical activity as a predictor for antihypertensive drug treatment in 25-64-year-old populations in eastern and south-western Finland. J Hypertens. 2005;23:293-9.
CrossRef - Leary SD, Ness AR, Smith GD, Mattocks C, Deere K, Blair SN, et al. Physical activity and blood pressure in childhood: findings from a population-based study. Hypertension. 2008;51:92-8.
CrossRef - Whelton SP, Chin A, Xin X, He J. Effect of aerobic exercise on blood pressure: a meta-analysis of randomized, controlled trials. Ann Intern Med. 2002;136:493-503.
CrossRef - Williams PT. A cohort study of incident hypertension in relation to changes in vigorous physical activity in men and women. J Hypertens. 2008;26:1085-93.
CrossRef - Matthews CE, Chen KY, Freedson PS, Buchowski MS, Beech BM, Pate RR, et al. Amount of time spent in sedentary behaviors in the United States, 2003–2004. Am J Epidemiol. 2008;167:875-81.
CrossRef - Sofi F, Capalbo A, Marcucci R, Gori AM, Fedi S, Macchi C, et al. Leisure time physical activity but not occupational physical activity significantly affects cardiovascular risk factors in an adult population. Eur J Clin Invest. 2007;37:947- 53.
CrossRef - Berengo NC, Kastarinen M, Lakka T, Nissinen A, Tuomilehto J. Different forms of physical activity and cardiovascular risk factors among 24-64-year-old men and women in Finland. Eur J Cardiovasc Prev Rehabil. 2006;13:51-9.
- Hjemdahl P. Cardiovascular system and stress. In: Fink G, ed. Encyclopedia of Stress (vol 1). London: Academic Press. 2000 pp389403.
- Blumenthal JA, Sherwood A, Gullette EC, Georgiades A, Tweedy D. Biobehavioral approaches to the treatment of essential hypertension. J Consult Clin Psychol. 2002;70:569-89.
CrossRef - Thapliyal V, Singh K. ‘Nutrition Transition’: A Paradigm Shift in Uttrakhand. J Nutr Food Sci. 2014;4: 298.
CrossRef - Amuna P and Zotor FB. Epidemiological and nutrition transition in developing countries: Impact on human health and development”. Proceedings of the nutrition Socienty. 2008; 67:(1):82-90,
- National Institute of Medical Statistics, Indian Council of Medical Research (ICMR), 2009, IDSP Non-Communicable Disease Risk Factors Survey, Phase-I States of India. 2007-08. National Institute of Medical Statistics and Division of Non-Communicable Diseases, Indian Council of Medical Research, New Delhi, India. Reterieved from (http://www.icmr.nic.in/final/IDSP-NCD%20Reports/Phase- 1%20States%20of%20India.pdf)
- World Health Organization Western Pacific Region, International Association for the Study of Obesity, International Obesity Task Force,.The Asia– Pacific perspective: redefining obesity and its treatment. Sydney, Australia: Health Communications Australia Pty Limited; 2000. Available:http://www.who.int/nutrition/publications/obesity/09577082_1_1/en/ (accessed 2006 Aug 23).
- Dudeja V, Misra A, Pandey RM, Devina G, Kumar G, Vikram NK. BMI does not accurately predict overweight in Asian Indians in Northern India. Br J Nutr. 2001; 86:105-12.
CrossRef - Gus M, Fuchs SC, Moreira LB, Moraes RS, Wiehe M, Silva AF, et al. Association between different measurements of obesity and the incidence of hypertension. Am J Hypertens. 2004; 17: 50-3,
CrossRef - James PA, Oparil S, Carter BL, et al. 2014 Evidence Based Guideline for the Management of High Blood Pressure in Adults: Report From the Panel Members Appointed to the Eighth Joint National Committee (JNC 8). JAMA. 2014; 311:(5):507-520.
CrossRef - S. Vasan, A. Beiser, S. Seshadri et al., “Residual lifetime risk for developing hypertension in middle-aged women and men: the Framingham Heart Study,” The Journal of the American Medical Association. 2002 vol. 287, no. 8, pp. 1003–1010.
CrossRef - Hsieh SD, Yoshinaga H, Muto T, Sakurai Y, Kosaka K. Health risks among Japanese men with moderate body mass index. Int J Obes Relat Metab Disord. 2000;24: 358-62.
CrossRef - Seidell JC, Cigolini M, Deslypere JP, Charzewska J, Ellsinger BM, Cruz A. Body fat distribution in relation to serum lipids and blood pressure in 38-year-old European men: the European fat distribution study. Atherosclerosis. 1991;86: 251-60.
CrossRef - Shahbazpour N. Prevalence of overweight and obesity and their relation to hypertension in adult male university students in Kerman, Iran. Int J Endocrinol Metab. 2003;2:55-60.
Accepted on: 22-4-2018
Second Review by: Dr. Abiodun Moshood Adeoye (Nigeria)
Final Approval by: Prof. Min-Hsiung Pan


Web of Science Coverage
Emerging Sources Citation Index (ESCI)
2024 Journal Impact Factor: 1.1
Scopus Journal Metrics
CiteScore 2025: 2.6
CiteScore Details
Sustainable Nutrition: Food Systems, Nutrient Retention, and Public Health Impact
![]()
This journal is a member of, and subscribes to the principles of, the Committee on Publication Ethics (COPE)


