

Introduction
A nutrition label is a display of food ingredients used to guide consumers toward healthy food choices 1,2. According to the Food Act (number 30 for the year 2015), Jordan Food and Drug Administration (JFDA) defined a food label as any label, designation, photograph, description whether written, printed, attached to a food 3. To achieve the aim of better food choices, food labels should be clear and well understood by the consumers 1.
Overweight and obesity occur when there is an imbalance between food intake and physical activity 4. The World Health Organization (WHO) reported that in 2016, 1.9 billion adults were obese 5. Obesity increases the risk for other comorbidities such as cardiovascular diseases (CVDs) and diabetes mellitus type II 4. The prevalence of obesity and its related comorbidities in Jordan is high. In 2015, the WHO reported that obesity affects 30% of the Jordanian population. In addition, CVDs and diabetes contribute to 75.6% and 7.6% of mortality in Jordan respectively 6. The rising prevalence of obesity necessitated developing an action plan to combat obesity. Hence, between 2010 and 2015, the Jordanian government has adopted a strategy to combat obesity and enhance physical activity 7. Moreover, in 2015, the Jordanian government adopted the national strategy and plan of action against obesity, diabetes, hypertension, and dyslipidemia 8. Based on this strategy, one of the actions intended by the Jordan Ministry of Health (MOH) was to develop a policy framework including the necessary regulations and laws that cover all areas relevant to the promotion of healthy eating patterns and physical activity. The policy of food labeling is the framework that is based on a set of laws and regulations that support a healthy diet and deliver information to the consumer about food quality, drawing consumer attention to the potential health benefits and risks of certain diseases, motivating manufacturers to produce better food products, and motivating consumers to select better food choices 9.
In terms of eating patterns, Jordan MOH is looking to control the labeling of food products particularly their fat and trans-fat content, caloric content, and coloring substances. According to this vision, national labeling standards are being developed and updated for locally-produced and imported foods 8.
The dietary guidelines for Americans recommend lower intakes of solid fats (saturated and trans fats), cholesterol, sugar, and increase dietary fiber intake 10. For this purpose, the Food and Drug Administration (FDA) mandates setting the amounts of total fat, saturated fat, trans fats, cholesterol, sodium, fiber, sugars, and added sugars within the food label. Moreover, the percent daily values (% DV) of fat and saturated fat, cholesterol, sodium, dietary fiber, sugar, and added sugars are required to be displayed 11. On the other hand, Jordanian law for food labeling requires the product name, net weight, manufacturer’s name and address, lot number, production and expiry dates, ingredient list 3, and fortifying matters (for powdered milk only). The dietary reference intake values are not required 12. On the other hand, foods that are exported are imported from/to Jordan and must comply with food legislation in other relevant countries and any conditions and standards set out in the bilateral agreements between Jordan and the importing country or with the approval of the competent authorities of the importing country 3.
The lack of mandating adequate nutritional information on the label might contribute to consumer misleading despite that achieving the aim of better food choosing needs a clear and well-understood food label 1. The aim of the current research is to put some highlights on a sample of packaged foods sold in the Jordanian market regarding their food labels in terms of following the JFDA and FDA food label guidelines in an attempt to raise the attention toward a modification of policies, laws, and regulations of food label in Jordan. Moreover, the current research aims at exploring some sources of fat, saturated fat, trans fats, cholesterol, sugar and added sugar in a sample of packaged foods that are sold in the Jordanian market. Knowing the sources of the abovementioned components may put some information for Jordanian consumers as they are risk factors for the most common causes of death worldwide.
Materials and Methods
This is a cross-sectional study that aimed to screen the products that are sold in the Jordanian market for their food label. Undergraduate students of 3rd and 4th classes studying in the Department of Nutrition/Faculty of Pharmacy and Medical Sciences/University of Petra/Amman/Jordan and Department of Clinical Nutrition and Dietetics/ Faculty of Applied Health Sciences/ The Hashemite University/Zarqa/ Jordan were thankfully asked to examine and record the food labels of foods in the supermarket as well as their homes. Data were recorded and analyzed using an excel sheet. As well, students were asked to capture clear photos for every checked food label to check the validity of their records. For each group of 10 students, a team leader was assigned to check the similarity of the written information and the captured photos. A second data check was performed by the authors.
JFDA criteria were used to check the food labels in terms of product name, brand name, net weight, manufacturer name and address, lot number, production and expiry dates, and ingredient list 3. In addition, United States FDA regulations of 2016 (for regular labels and new labels) 13 were used to check the label in terms of product name, brand name, serving size, energy, macronutrient (total fat, total protein, total carbohydrates), saturated fat, trans fat, cholesterol, dietary fiber, total sugars, added sugar, micronutrient contents (Na, Ca, vitamin D, Fe, and K). The content of these nutrients was checked in the units that are specified by the FDA (2016) regulations i.e. serving size (in common measures and weight), energy (Kcal.), total fat, saturated fats, total carbohydrates, and dietary fiber (in grams and % daily values (% DV), trans fats and protein (in grams), cholesterol, Na, Ca, Fe, K, and vitamin C (in milligrams and % DV), the vitamins A and vitamin D (in micrograms and % DV). DVs were checked based on 2000 Kcal. and 2500 Kcal. diet recommendations. Additionally, food item names and groups according to the American Dietetic Association (ADA) exchange system for diabetes 14 categories (i,e. carbohydrates: starch, fruits, vegetables, other carbohydrates, fats: monounsaturated fats, polyunsaturated fats, saturated fats, protein: plant-based protein, lean protein, medium fat protein, and high fat protein, and combination foods), sweets, desserts, and other carbohydrates, free foods, and combination foods were checked.
The criteria which were set to evaluate nutrient sources are that set by FDA i.e. FDA sets foods which contains a nutrient in amounts that contribute to ≥ 20% of DV are rich sources of that nutrient, those containing 10-19% DV are good sources, and those containing 5%DV are low sources 15.
Results
A total of 663 packaged products were screened. Only 22% (145 products) of these products were local. Three products didn’t contain nutritional information on their packages. It is noteworthy to indicate that there was a general observation from the students who screened the products that food labels were not clear in terms of small font and inconsistent between Arabic and other language versions. In this study, checking the label showed that the screened products were compliant with JFDA standards. However, they were not in compliance with some FDA standards. Tables 1-4 show the numbers and percentages of compliant products with the FDA standards in terms of energy, macronutrient, and fiber contents in g/serving and as %DV (Table 1), sugars, added sugars, saturated and trans fats, and cholesterol in g or mg/serving and as % DV (Table 2), the vitamins A, C, and D in µg or mg/serving and as % DV (Table 3), the minerals Na, K, Fe, and Ca in mg/serving and as % DV (Table 4). Table 1 shows that very few of the screened products (15 out of 663) displayed the serving size in both measures (Tables 1-5).
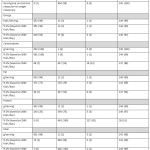 |
Table 1: Status of the Screened Products in Terms of Energy, Macronutrient and Fiber Contents (in Kcal. or g per serving, and % DV based on 2000 and 2500 Kcal.) as Number and Percentages. |
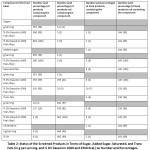 |
Table 2: Status of the Screened Products in Terms of Sugar, Added Sugar, Saturated, and Trans Fats (in g per serving, and % DV based on 2000 and 2500 Kcal.) as Number and Percentages. |
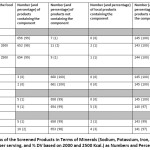 |
Table 3: Status of the Screened Products in Terms of Minerals (Sodium, Potassium, Iron, and Calcium) (in mg per serving, and % DV based on 2000 and 2500 Kcal.) as Numbers and Percentages. |
Tables 1-4 show that most of the screened products (including local products) abide by the instructions of the FDA in terms of setting the serving size, energy, macronutrient, fiber, sugars, added sugars, saturated fat, Na contents (in Kcal. and g) and as %DV. However, in terms of protein, fiber, trans fats, and cholesterol, contents (as %DV), most of the product manufacturers didn’t set the values. In addition, the product contents of K, Fe, Ca, the vitamins A, C, and D (in mg and µg/serving) and as % DV was not displayed in most of the screened foods. Also, these tables show that most of the local products obey all of the FDA standards.
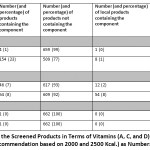 |
Table 4: Status of the Screened Products in Terms of Vitamins (A, C, and D) (in mg and µg per serving, and % Recommendation based on 2000 and 2500 Kcal.) as Numbers and Percentages. |
Table 5 shows the status of compliance with FDA standards for the local products. This table shows that most of these products contain the serving size, energy content (Kcal./serving), carbohydrate content (g/serving), protein content (% DV based on 2500 Kcal. diet), saturated fats in g/serving and % DV based on 2000 Kcal. diet, trans fats in g/serving and as % DV, cholesterol as % DV, Na as % DV, and vitamin C as mg/serving and as % DV. In addition, this table shows that the screened local products were inconsistent in setting nutrition label information. Some products display the % DV based on 2000 Kcal. diet, other display it based on 2500 Kcal diet, and many manufacturers didn’t display the content at all.
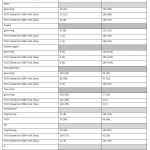 |
Table 5: Status of Local Products in Terms of Energy, Macronutrient, Fiber, and Micronutrient Contents (in Kcal. or g per serving, and % DV based on 2000 and 2500 Kcal.) as Numbers and Percentages. |
In this survey, the products were screened for hidden sources of added sugars, Na, saturated and trans fats since these components are considered as dietary risk factors for obesity, CVDs, and diabetes; the top ten killers in Jordan 6. Table 6 shows some sources of added sugars, Na, and saturated fats among the screened products. The classification of sources was based on FDA criteria i.e. FDA sets foods that contains a nutrient in amounts that contribute to ≥ 20% of DV are rich sources of that nutrient, those containing 10-19% DV are good sources, and those containing 5% DV are low sources 15.
Table 6: Some Sources of Added Sugars, Na, and Saturated Fats among the Screened Products.
| Classification | Foods |
| Good sources of added sugars | Deep frozen potatoes, Barbecue sauce, Crunchy oats & honey, Raisin bran roasted bran flakes, Dark chocolate |
| Rich sources of sodium | Cheddar cheese, Foul mudammas (broad beans packed in oil and brine), Powder chicken mix, Barbecue sauce, Pan cake and waffle mix, Nacho cheese sauce, Chickpea dip (Hummus), Tomato paste, Italian dressing, Mayonnaise, Soy sauce, Macroni & cheese, Chickpeas, Sliced bread |
| Good sources of sodium | Pasta sauce (garlic and herbs), Triple chocolate fudge cake mix, Falafel mix, Samosa leaves (ready-to-use dough sheets), Low carb waffle and pan cake mix, Sandwich biscuits, Spring roll pastry, Soy non-dairy beverage, Bread tanour (Arabic bread), Sports drink, Instant oat meal maple syrup, Corn flakes cereal, Bread crumbs, Cream cheese spread, Instant pudding and pie filling, Puff pastry squares, Labneh, Popcorn, Chickpea dip, Chips |
| Rich sources of saturated fats | Digestive sweet meal biscuits, Muffin mix, Low-fat cheddar cheese, Ice cream, Puff pastry, Tahini (sesame paste), Creamy dressing (Ranch), Chocolate topping, Turkish labneh, Popcorn, Triple chocolate cake mix, Noodles |
| Good sources of saturated fats | Halawa with pistachios, Crunchy peanut butter, Falafel mix, Sesame tahini, Chips, Dates with bran, Cappuccino, Dark chocolate, Deep frozen potato, Taco shells, Caramel macchiato, Nacho cheese sauce, Chips, Cocoa powder, Pistachio filled cookies, Lasagna, Sweetened fat cocoa powder, Crunchy oats and coconut, Hot cocoa mix, Tomato ketchup chips |
*Products were classified into (good) and (rich) based on the FDA criteria were a serving of rich sources provided with ≥20% of DV and a serving of good sources provides with 10-19% of DV15
Table 7 shows the classification of the screened foods which were found as hidden sources of added sugars, Na, and saturated fats according to the exchange system for diabetes 14. It is obvious from the table that most (16 products) of these products were classified in the carbohydrate list, some (9 products) of them in the (sweets, desserts, and other carbohydrates) list, others (7 products) in the protein list, one product is classified in the free food list, one product in the combination food list, two in the fat list, and one in the carbohydrate and fat list.
Table 7: Classification of the Screened Foods which were found as Hidden Sources of Added Sugars, Na, and Saturated Fats according to the ADA Exchange System for Diabetes.
| Food Item | Exchange List |
| Sliced bread, Bread tanour (Arabic bread), Corn flakes cereal, Popcorn, Noodles, Instant oat meal maple syrup, Bread crumbs, Tomato paste, Roasted bran flakes, Raisin bran, Pan cake and waffle mix, Low carb waffle and pan cake mix, Soy non-dairy beverage, Sandwich biscuits, Digestive sweet meal biscuits | Carbohydrates |
| Barbecue sauce, Triple chocolate fudge cake mix, Dark chocolate, Sports drink, Instant pudding and pie filling, Muffin mix, Ice cream, Chocolate topping, Triple chocolate cake mix | Sweets, desserts, and other carbohydrates, |
| Soy sauce | Free foods |
| Marconi & cheese | Combination foods, |
| Chickpeas, Chickpea dip, Falafel mix, Cheddar cheese, Low fat cheddar cheese, Foul mudammas (broad beans packed in oil and brine), Cream cheese spread | Protein, |
| Chips | Carbohydrates + fats |
| Tahini (sesame paste), Mayonnaise | Fats |
| Deep frozen potatoes, Nacho cheese sauce, Italian dressing, Pasta sauce (garlic and herbs), Creamy dressing (ranch), Crunchy oats & honey, Puff pastry squares, Digestive sweetmeal biscuits, Samosa leaves (ready-to-use dough sheets), Labneh, Turkish labneh, Powder chicken mix, Spring roll pastry | Not listed |
Table 8: Position of the American Dietetic Association (ADA) Exchange Lists from the Sources of Added Sugars, Na, and Saturated Fats found in this Survey.
| Risk Factor | Food Source | Position of the ADA |
| Added sugars | Barbecue sauce, dark chocolate | Highlighted |
| Deep frozen potatoes, Crunchy oats and honey, Raisin bran roasted bran flakes, | Not highlighted | |
| Sodium | Cheddar cheese, Tomato paste, Soy sauce, Macaroni & cheese, Bread crumbs, | Highlighted |
| Foul mudammas (broad beans packed in oil and brine), Powdered chicken mix, Barbecue sauce, Spring roll pastry, Nacho cheese sauce, Chickpea dip (Hummus), Italian dressing, Mayonnaise, Pasta sauce (garlic and herbs), Triple chocolate fudge cake mix, Falafel mix, Samosa leaves (ready-to-use dough sheets), Low carb waffle and pancake mix, Spring roll pastry, Soy non-dairy beverage, Bread tanour (Arabic bread), Sports drink, Instant oatmeal maple syrup, Corn flakes cereal, Cream cheese spread, Instant pudding and pie filling, Puff pastry squares, Labneh, Popcorn, Chips, Pancake and waffle mix, Sandwich biscuits, | Not highlighted | |
| Saturated fats | Ice cream, Muffin mix, Puff pastry, Tahini (sesame paste), Creamy dressing (ranch), Chocolate topping, Turkish labneh, Triple chocolate cake mix, Noodles, Halawa (a sweet made from sesame paste, dried milk, and sugar) with pistachios, Crunchy peanut butter, Chips, Dates with bran, Cappuccino, Dark chocolate, Deep frozen potato, Taco shells, Caramel macchiato, Nacho cheese sauce, Chips, Cocoa powder, Pistachio filled cookies, Lasagna, Sweetened fat cocoa powder, Crunchy oats and coconut, Hot cocoa mix, Tomato ketchup chips. | Not highlighted |
Discussion
Setting clear information on the food label enables consumers to follow the guidelines and to achieve the intended purposes of the food label 16. Labeling requirements which were set by the Jordanian Institute of Standardization and Meteorology (JISM) require food labels to be in Arabic and permit an Arabic label stick 12. In addition, the FDA encourages label clarity 16. It is recommended, thus, to ascertain the clarity of food label presentation and the consistency between Arabic and other language versions of the food label for the sake of consumers following guidelines and health and wellbeing accordingly. Legislators as well as monitoring parties are responsible for controlling the clarity and authenticity of different languages of food labels. Manufacturers are called to set clear labels. As well, it is the role of consumers to read labels and choose better foods.
Serving size is the amount of food set on the food label indicating the recommended amount to be consumed in an eating session/episode 16. Setting serving size on the food label indicates a reference point for the consumer, reflects the real amounts consumed, affects food consumption 17, and enables consumers to compare between different products in order to consume better food choices in terms of nutritive value as well as price 15,18. The FDA doesn’t require displaying the serving size both in common measures and weight measures. Compliant with this, very few of the screened products displayed the serving size in both measures (Tables 1 and 5). The FDA recommends, rather, setting the serving size in household measures in order to develop consumer awareness and understanding of nutrition information and choose healthier food alternatives 16,19. During this survey, it has been found that most of the screened products set serving sizes. This finding encourages mandating setting serving size on the food label for the sake of the above-mentioned benefits for the consumer. Some countries such as the USA, Canada, European countries, Australia, and New Zealand obligate the presence of serving size 20. Standardization is, thus, common and allows compromise in food information, benefits, facilitate following laws and regulations, and encourages adopting healthier dietary pattern 20. What should be taken into consideration is what would be the better choice for consumers? Is it setting the common serving size based on the culture and Jordanian population eating pattern or that based on the ADA exchange lists? Setting the serving size based on the culture and Jordanian population eating pattern will accommodate Jordanian culture while the other choice might suit the products that are exchanged between Jordan and other countries.
% DV is one of the numerical methods for presenting the nutrient content of foods that is relevant to nutrient content claims. It represents how much a serving provides from the recommended amount of nutrients 10. This method is based on scientific information on chronic disease risk reduction. The presence of such figures allows the consumer to compare between different products 9,21. In addition, setting the % DV enhances food marketing 22.
The WHO stated that the most common causes of death in Jordan are cardiovascular diseases (CVDs) accounting for 37% of deaths. Cancers, communicable, maternal, perinatal, and nutritional conditions, and diabetes are of the ten most common causes of death in Jordan accounting for 12%, 11%, and 6% of deaths in Jordan respectively 6. Nutrition and diet affect the rate of these causes of death, especially in developing countries. Among these dietary factors is the consumption of increased amounts of energy and macronutrients, refined grains with low fiber content, sugar and sugar-sweetened beverages, edible animal fats and oils, and processed foods containing saturated and trans fats, Na, reduced consumption of Ca and K 23. In addition, obesity is central to CVDs, diabetes mellitus, and some types of cancers. Jordanian food processing market is growing 24 and the consumption of processed and packaged foods is increasing. There is an increased interest in the nutrition information extracted from the food label. Consumers want standardized, “easy to understand” information, colorful, and attractive labels 25. Consumers feel that they are motivated by reading nutrition information on foods 26. However, some food labels may mislead consumers 27. Food label draws attention to food products and motivates purchasing. The label format and content affect understanding the nutritional value of food. These facts necessitate the reform of policies, laws, regulations related to the food label. The reform requires looking at the benefits of food labels in a broader context, standardizing the guidelines for displaying the food label, and recognizing the use of nutrition labeling as a major motivator for product reformulation and innovation 28. This requires the collaboration of stakeholders, governmental and non-governmental related agencies, food manufacturers, scientists and educators, and consumers. Scientists and educators are called to educate consumers about the context and importance of food labels. It is noteworthy to mention controlling food labels needs educational campaigns for consumers to reduce barriers 26 and allow better understanding for issues such as serving size and % DV 29. Stakeholders, scientists and educators are required to develop a curriculum related to education about food label context and importance. Stakeholders and legislators are called to focus on developing new related laws, regulations, and policies without any increase in food costs neither for the manufacturer nor for the consumer. Food manufacturers are needed to work hard on developing informative, clear, easy-to-understand, and attractive food labels.
Among the screened products, some unexpected sources of added sugars, Na, and saturated fats were found. Fortunately, some agencies such as the American Dietetic Association (ADA) highlighted these components for the consumers 14. The foods were found as hidden sources of added sugars, Na, and saturated fats according to the exchange system for diabetes 14. It is obvious from the table that most of these products were classified in the carbohydrate list, some of them in the (sweets, desserts, and other carbohydrates) list, others in the protein list, one product is classified in the free food list, one product in the combination food list, two in the fat list, and one in the carbohydrate and fat list. What is noteworthy is that many of the products (13 products) are not listed (as they are) in the ADA exchange lists. Nonetheless, some of these unlisted products are presented within the exchange lists in another way such as prepared versions. For example, deep-frozen potatoes are not listed within the exchange list but fried potatoes are listed there. The same applies to triple chocolate fudge cake mix, falafel mix, instant pudding and pie filling, pancake and waffle mix. Other products are not listed Per se but the exchange lists contain similar products such as whole wheat sweetmeal biscuits (listed as biscuits). Other foods are unique to the Arab or other cuisines such as Samosa leaves (ready-to-use dough sheets), Labneh, and Turkish labneh.
The ADA exchange lists highlight the presence of high amounts of salt, fat, and fiber in the listed foods by symbols 14. The ADA didn’t highlight the presence of saturated fats, trans fats, and added sugars. It is recommended, thus, that agencies such as ADA and scientists highlight the presence of added sugars, Na, and saturated fats within these and other food items. The legislators are called to look for ways to indicate the presence of high amounts of dietary risk factors such as sugars, added sugars, Na, saturated, and trans fats in packaged food sold in Jordanian markets taking into consideration cultural and educational backgrounds. The use of colors and symbols in food labels was a successful experience and enhanced consumer health in many countries such as the United States 30, Britain 31,32, Canada 33, and Sweden 34.
This study is the first study of its kind that was performed to screen the products sold in the Jordanian market against USFDA as well as JFDA standards of food labels. In addition, this study identified some hidden sources of Na and saturated fats. This study is limited by cross-sectional design.
Results of this research show that most of the screened products abide by the food label laws and regulations of JFDA. However, most of the products didn’t follow the FDA guidelines of food labeling. In addition, different products displayed different patterns of food labeling information. Furthermore, the food label of some screened products showed that there are some hidden sources of added sugars, Na, and saturated fats.
The Jordanian government is working to control food labels. JFDA laws and regulations related to food label requires the product name, net weight, manufacturers name and address, lot number, production and expiry dates, ingredient list, and fortifying 3 matters for milk powder). Food label laws and regulations are called to be reformed in accordance with FDA food label guidelines in order to be more informative for the sake of consumer health and manufacturer benefits. Legislators, stakeholders, scientists and educators and manufacturers are called to share knowledge and experience to reform laws and regulations related to the food labels. Scientists and educators are called to develop curricula related to consumer and manufacturer education regarding the context and importance of food labels. In addition, they are called to identify foods that are known to be sources of dietary risk factors for chronic diseases.
Acknowledgment
This research did not receive any specific grant from funding agencies in the public, commercial, or not-for-profit sectors. This research was performed at the Department of Nutrition/Faculty of Pharmacy and Medical Sciences/University of Petra/Amman and Department of Clinical Nutrition and Dietetics/ Faculty of Applied Health Sciences/The Hashemite University/Zarqa/Jordan. The authors would like to thank the students who participated in this research voluntarily.
Funding Sources
The authors received no financial support for the research, authorship, and/or publication of this article.
Conflict of Interest
The authors declare no conflict of interest.
References
- Moore SG, Donnelly JK, Jones S. Effect of Educational Interventions on Understanding and Use of Nutrition Labels : A Systematic Review. 2018:1-14. doi:10.3390/nu10101432.
CrossRef - Instituto Nacional de Salud Pública de México. Review of Current Labelling Regulations and Practices for Food and Beverage Targeting Children and Adolescents in Latin America Countries (Mexico, Chile, Costa Rica and Argentina) and Recommendations for Facilitating Consumer Information.; 2016. https://www.unicef.org/lac/sites/unicef.org.lac/files/2018-05/20161205_UNICEF_LACRO_Etiquetado_ING.pdf%0Ahttps://www.unicef.org/ecuador/english/20161122_UNICEF_LACRO_Labeling_Report_LR(3).pdf.
- Jordanian Food Law. Jordan: JFDA
- Lysen NK, Israel DA. Krause’s Foos & The Nutrition Care Process. 14th Editi. (Mahan, L. Kathleen., editor. | Raymond JL, ed.). Canada: Elsevier; 2107.
- WHO Director-General’s opening remarks at the mission briefing on COVID-19 -11 March 2020. 2020. https://www.who.int/dg/speeches/detail/who-director-general-s-opening-remarks-at-the-mission-briefing-on-covid-19—26-february-2020.
- WHO. Health Profile 2015.; 2017. doi:10.1017/CBO9781107415324.004.
CrossRef - Musaiger AO, Al Hazzaa HM, Al-Qahtani A, et al. Strategy to combat obesity and to promote physical activity in Arab countries. Diabetes, Metab Syndr Obes Targets Ther. 2011;4(January 2015):89-97. doi:10.2147/DMSO.S17322.
CrossRef - The National Strategy and Plan of Action against Diabetes, Hypertension, Dyslipidemia, and Obesity in Jordan.; 2015.
- HandBook On Food Labelling To Protect Consumers.; 2016. http://www.fao.org/3/a-i6575e.pdf.
- Wilson MD, Gibson TN, Ellwood K. Relationships among Food Label Use, Motivation, and Dietary Quality. 2015:1068-1080. doi:10.3390/nu7021068.
CrossRef - Is Your Label Ready For FDA’s Deadline_ _ Registrar. Is Your Label Ready? https://www.registrarcorp.com/fda-food/labeling/?utm_source=google&utm_medium=cpc&utm_term=fda food labeling guide&utm_content=108650974468&utm_campaign=9840683420&matchtype=p&device=c&gclid=CjwKCAjw_-D3BRBIEiwAjVMy7MVOxbk_Knyoyb1rS8uPf-_ty4npT5wjM2_c5x-l. Accessed June 28, 2020.
- Verdonk R, Khraishy M. Food and Agricultural Import Regulations and Standards – Narrative FAIRS Country Report. 2015.
- Nutrition Facts Label Reboot: A Tale of Two Labels.; 2019. https://www.fda.gov/consumers/consumer-updates/nutrition-facts-label-reboot-tale-two-labels.
- Geil PB. Choose Your Foods : Exchange Lists for Diabetes : The 2008 Revision of Exchange Lists for Meal Planning. 2008:281-283.
CrossRef - Ellie Whitney, Rolfes SR. Understanding Nutrition. Vol 47. 12th ed. (Williams P, Rose N, Feldman E, Glubka A, Tarson L, eds.). USA: Woods Worth, Cengage learning; 2015. doi:10.1016/j.jneb.2015.06.001.
CrossRef - Roberto CA, Khandpur N. Improving the design of nutrition labels to promote healthier food choices and reasonable portion sizes. Int J Obes. 2014;38(SUPPL. 1): S25-S33. doi:10.1038/ijo.2014.86.
CrossRef - Hydock C, Wilson A, Easwar K. The effects of increased serving sizes on consumption. Appetite. 2016;101(August):71-79. doi:10.1016/j.appet.2016.02.156.
CrossRef - Vermeer WM, Steenhuis IHM, Seidell JC. Portion size: A qualitative study of consumers’ attitudes toward point-of-purchase interventions aimed at the portion size. Health Educ Res. 2010;25(1):109-120. doi:10.1093/her/cyp051.
CrossRef - Kliemann N, Boro Veiros M, González-Chica DA, Pacheco da Costa Proença R. Is the serving size and household measure information on labels clear and standardized? Analysis of the labels of processed foods sold in Brazil. Vigilância Sanitária em Debate. 2014;2(4). doi:10.3395/vd.v2i4.445.
CrossRef - Kliemann N, Kraemer MVS, Scapin T, et al. Serving size and nutrition labeling: Implications for nutrition information and nutrition claims on packaged foods. Nutrients. 2018;10(7). doi:10.3390/nu10070891.
CrossRef - European Parliaments and the Council. REPORT FROM THE COMMISSION TO THE EUROPEAN PARLIAMENT AND THE COUNCIL regarding the use of additional forms of expression and presentation of the nutrition declaration. J Chem Inf Model. 2020. file:///C:/Users/User/Downloads/fvm939e.pdf.
- Food Standards Agency. Guide to creating a front of pack (FoP) nutrition label for pre-packed products sold through retail outlets. Food Stand Agency. 2016;(November):33.
- Krishnaswamy K, Vaidya R, Rajgopal G, Vasudevan S. Diet and nutrition in the prevention of non-communicable diseases. Proc Indian Natl Sci Acad. 2016;82(5):1477-1494. doi:10.16943/ptinsa/2016/48881.
CrossRef - GIZ Jordan. Jordan’s ICT sector Analysis and Strategy for Sectoral Improvement. 2019;(May).
- Bandara BES, De Silva DAM, Maduwanthi BCH, Warunasinghe WAAI. Impact of Food Labeling Information on Consumer Purchasing Decision: With Special Reference to Faculty of Agricultural Sciences. Procedia Food Sci. 2016;6(Icsusl 2015):309-313. doi:10.1016/j.profoo.2016.02.061.
CrossRef - Graham DJ, Orquin JL, Visschers VHM. Eye-tracking and nutrition label use: A review of the literature and recommendations for label enhancement. Food Policy. 2012;37(4):378-382. doi:10.1016/j.foodpol.2012.03.004.
CrossRef - Kuchler F, Greene C, Bowman M, Marshall KK, Bovay J, Lynch L. Beyond nutrition and organic labels – 30 years of experience with intervening in food labels. Econ Res Rep – Econ Res Serv USDA. 2017;(239):v-pp. https://www.ers.usda.gov/webdocs/publications/85687/err-239.pdf.
- Bonsmann SSG, Celemín LF, Grunert KG. Food labeling to advance better education for life. Eur J Clin Nutr. 2010;64:S14-S19. doi:10.1038/ejcn.2010.204.
CrossRef - Moore SG, Donnelly JK, Jones S, Cade JE. Effect of educational interventions on understanding and use of nutrition labels: A systematic review. Nutrients. 2018;10(10):1-14. doi:10.3390/nu10101432.
CrossRef - Supplements D, Nutrition A. Additional Copies Are Available From ; 2013. https://www.fda.gov/files/food/published/Food-Labeling-Guide-%28PDF%29.pdf.
- Albert J. New Technologies and Food Labelling: The Controversy over Labelling of Foods Derived from Genetically Modified Crops.; 2009. doi:10.1533/9781845697594.153.
CrossRef - Vasiljevic M, Pechey R, Marteau TM. Making food labels social : The impact of color of nutritional labels and injunctive norms on perceptions and choice of snack foods Making food labels social : The impact of color of nutritional labels and injunctive norms on perceptions and choice of s. Appetite. 2015;91(April):56-63. doi:10.1016/j.appet.2015.03.034.
CrossRef - Goodman S, Vanderlee L, Acton R, Mahamad S, Hammond D. The Impact of Front-of-Package Label Design on Consumer Understanding of Nutrient Amounts. 2018. doi:10.3390/nu10111624.
CrossRef - Larsson I, Wilhelmsen L. The ’ Green Keyhole ’ revisited : Nutritional knowledge may influence food The ` Green Keyhole ’ revisited : Nutritional knowledge may influence food selection. 1999;(March 2014). doi:10.1038/sj.ejcn.1600839.
CrossRef

This work is licensed under a Creative Commons Attribution 4.0 International License.


