
Introduction
Rice bran is an underutilized byproduct of rice milling industry usually produced during polishing of rough rice that contains 12-15% crude protein and 14-15% crude fat. It also comprises essential amino acids, fiber, vitamins and minerals.1 Rice bran is a source of hypoallergenic proteins; thus, it is used in baby food formulations to keep up necessary growth and development of infants.2 The qualities of rice bran protein are quite comparable to qualities of animal proteins.3 During milling process around 8% of total paddy weight is produced as bran which is used either as animal feed or throw to the environment. Nowadays few industries in Bangladesh are involved in producing oil from rice bran but the protein in rice bran is still under-utilized or somehow wasted which could be a prominent vehicle to combat protein deficiency in developing country.4 In developing countries including Bangladesh, it is very difficult to maintain adequate protein in the diet every day. FAO stated that, although Bangladesh meet the total energy intake (2250 Kcal/capita/day), the energy come from protein is not adequate. At least 12% energy should come from protein and 20% energy should come from fat whereas energy consumption from protein and fat in Bangladesh is 8.61% and 10.90% respectively.5 Therefore, the extraction of protein from rice bran and its utilization in the food could be an authentic way to fulfill protein demand as well as a perfect utilization of by-products.
Different methods have been reported to extract protein from different protein sources like oilseeds, cereals, legumes, milk and muscle proteins.6-8 The most common and simple procedure to get high yield and relatively pure protein is alkaline extraction.9 However, this method induces unfavorable chemical reactions that result in a loss of nutritive value and formation of toxic substances.10 The extraction conditions like solid solvent ratio, solvent pH, extraction time are affected the extraction yield and extracted protein quality. Therefore solvent extraction of protein from rice bran employs alkaline condition so precipitation at the isoelectric point purpose at pH 4.5 scale. The single factor influences the yield, yet in addition all the elements influence the yield together. At the point when numerous components and connections influence desired responses, response surface methodology (RSM) which can give the pertinent data in the most limited time with minimal number of analyses is a successful instrument for streamlining the procedure.11
Although the nutritional potentiality of rice bran has been recognized, but rice bran protein concentrates and isolates are not commercially accessible. On the other hand, Bangladesh produced a large quantity of rice bran yearly, but its application in foods is very limited. Besides, utilization of such protein in food products has not studied widely though it is feasible. Therefore, the purposes of this study were to determine the optimal conditions for preparing rice bran extract and utilize this extract in bakery food products.
Materials and Methods
Procurement of Rice Bran
Parboiled rice (Oryza sativa) bran (variety: BRRI-29) was collected from Tangail, Bangladesh. Then it was sieved with 100 mash screen before defatting treatment.
Defatting Treatment
Rice bran was defatted following Wang et al.,2 using hexane as a solvent in bran to the ratio of 1:3 at a setting of 250 rpm in a T-line lab stirrer (Talboys Engineering Corp., Emersion, NJ) for 30 minute and centrifuged (SORVAL ST 8R, Thermo fisher, Germany) at 3000 rpm for 10 minute at room temperature. Then air-dried for overnight and sieved through a 100 mesh screen. The defatted rice bran (DRB) was then packed in a polyethylene bag and stored at 5ºC for protein extraction.
Protein Extraction
Extraction of protein concentrate from defatted rice bran was carried out according to the experimental design shown in Table 2. The extraction was done by slight modification of alkaline method used by Jiamyangyuen et al.,12 At first, defatted rice bran sample was mixed with distilled deionized water at the ratio of 1:30 to 1:50. Then pH 8.5-10.5 was adjusted by adding sodium hydroxide solution and stirred for 30 minutes at room temperature. The slurry prepared was then centrifuged at 3000 rpm for 30 minutes and the supernatant was collected in a beaker. Hydrochloric acid was added to the supernatant to adjust pH to 4.5 and kept in refrigeration temperature for overnight to well settle down of protein fractions. After 24 hour, the sample centrifuged again at 3000 rpm for 30 min and precipitate was washed using water (pH 4.5). The residue was suspended in distilled deionized water (pH 7.0) and oven dried (40 °C) overnight and stored at -5 ºC.
Chemical Analysis
The moisture, ash, fat, crude fiber, and nitrogen free extracts of collected parboiled and defatted rice bran and 5% rice bran protein concentrate (RBPC) biscuits were determined according to AOAC13 method. Protein content of parboiled and defatted rice bran, RBPC and 5% RBPC biscuits were obtained by following Kjeldahl method. The utilizable carbohydrate content was determined by using the following equation
![]()
Amino Acid Profile of RBPC
Amino acid composition of RBPC was determined by using an amino acid analyzer (Model No: 228-39015-38; Shimadzu, Japan), according to method describe by Anonymous14. About 0.5 g of sample was pasted with 50ml 6N HCl and then the sample were filtered. The filtrated sample was hydrolyzed for 22-24 hours in a hydrolyzing apparatus about at 105 0C. After hydrolyzing, HCl was removed from filtrate with distilled water for 3-4 times by evaporating in a water bath. After completing the evaporation, the stock solution was prepared and mark up to 25ml in a volumetric flask by using 0.1N HCl. This stock solution was injected in amino acid analyzer and the amino acids were determined by using the following equation
![]()
Functional Properties of RBPC
Water and oil Absorption Capacity
The sample (1.0 g) was mixed with 10 ml distilled water and oil, kept at ambient temperature for 30 minutes and centrifuged for 10 minutes at 2000 rpm. Water and oil absorption capacity were expressed as percent water bound per gram of the sample15.
Emulsifying Capacity and Emulsion Stability
Emulsion were prepared following by mixture 1.0 ml of corn oil and 3.0 ml of flour solution (2%) in 0.1M phosphate buffer (pH 7).The mixture were shaken and homogenized in Ultra Turrax (Hansen Co., West Germany) at 4000 rpm for 10 minutes at 20 oC. Then the mixture was centrifuged at 2000 rpm for 5 minutes and then poured into 50 ml measuring cylinders and stayed a few minutes until the emulsified layer was stable16. Emulsion capacity (EC) was measured by using following equation.
To determine the emulsion stability, about 50 μL of the homogenized mixture was taken from the bottom of the container of different times and pH and then diluted with 5 ml of 0.1% sodium dodecyl sulfate solution. The absorbance of the diluted mixture was then determined at 500 nm. The emulsion stability of samples at different pH level was expressed as the half-time of the initial turbidity of the emulsion17. Values obtained are means of replicate samples.
Foaming Capacity and Stability
Two grams of the sample were blended with 100 ml buffer at two pH levels (8 and 10) in a moulinex blender at high speed for 2 minutes. The mixture was poured into a 250 ml measuring cylinder and the foam volume was recorded after 30 sec18. The foam stability was estimated as function of pH (8, 10) according to Ahmed and Schmidt19. The foam stability (FS) was noted at 15 min interval after pouring the material in a cylinder and was determined by using following equation.
![]()
Bulk Density
A known weight of the protein concentrate was added to a graduated measuring cylinder. The cylinder was gently tapped and volume occupied by the sample was estimated Narayana and Rao.20
Experimental Design and Statistical Analysis
Response surface methodology (RSM) was applied for the optimization of extraction process parameters of protein from rice bran. A central composite design (CCD) with two independent variables was employed. The variables used were solid (rice bran) solvent (water) ratio and pH of solvent. The minimum, mean and maximum values for solid solvent ratio and pH are presented in Table 2. For the generation of response surface plots, the complete design consisted of 13 experiments including four factorial experiments (levels -1 and +1), four axial experiments (levels ±α), and five replicates in center point (Table 2). Experiments in the center of the design were performed in order to make the estimation of pure error possible. All the experiments were carried out at random in order to minimize the effect of unexplained variability in the observed responses due to systematic errors. The response functions measured was yield of protein concentrate. A response surface analysis and analysis of variance (ANOVA) were imposed to determine the regression coefficients, statistical significance of the model terms and to fit the mathematical models of the experimental data to optimize the both response variables overall region. The regression coefficients for linear, quadratic and interaction terms were determined by using multiple linear regressions.21
Formulation of High Protein Biscuits
The rice bran protein concentrate was incorporated in the standardized recipe of biscuit in 5% proportion and biscuits were prepared by following Prodhan et al.,22 standard method. In the production of high protein biscuits 0% (control sample) and 5% (high protein) level of extracted rice bran protein were incorporated with wheat flour. Then RBPC and baking powder were mixed with wheat flour and then salt, sugars were mixed properly with soybean oil. The remaining dry ingredients were transferred into the dough mixer, water was added as per requirement to form soft dough and then soybean oil was added to the mixture to prepare homogenous mass of batter. The batter was rolled out to give different shape. Flat sheet (0.4 cm) was prepared using dough sheeter. Biscuits were stamped out using stamping method. Trays with raw biscuits were kept in the baking oven for 20 min at temperature 160-170°C and observed changes during baking. After complete baking it was cooled up to 45 °C and packed in low density polyethylene packs. Prepared high protein biscuit was compared with control biscuit in terms of physicochemical and sensory evaluation.
Physical Attributes Analysis
Physical properties of biscuits are an important attribute which plays an important role to determine the consumer acceptability. AACC13 method was used to determine the diameter and thickness of the biscuits. The spread ratio of the biscuits was determined according to following equation.

Where, correction factor was 1.0 in this study at constant atmospheric pressure. The area of the biscuit was multiplied by thickness to determine the volume of biscuit and the density of biscuit was obtained by ratio of weight to volume of biscuits. Percentage of spread factor was determined by using following equation.

Sensory Evaluation
The sensory evaluation of rice bran protein concentrate incorporated biscuit and control biscuit were undertaken by semi trained panelist. The sensory attributes like appearance, color, taste, flavor, texture, and overall acceptability were evaluated by 9-point hedonic score system to justify the preferences to the food.
Statistical Analysis
Statistical analyses were done using the SPSS (version 20). Difference in physical parameters, proximate composition and sensory scores were detected using one-way analysis of variance (ANOVA). A significance level of (< 0.05) was used for the study. All the experiments were done with replication and analyzed with mean and standard deviation through Microsoft Excel 2013.
Results and Discussion
Composition of Rice Bran
Proximate composition of parboiled (full fatted) and defatted rice bran is presented in Table 1. Defatting process was done to reduce fat content of rice bran. This process also reduces protein content but increase ash content significantly. Proximate composition of defatted rice bran obtained by present study was comparable to the previous studies observed by Ly et al.,23 Little variation in composition might be due to different varieties of paddy. Lower protein content in defatted rice bran might be due to defatting process significantly reducing protein content.
Table 1: Proximate composition of parboiled and defatted rice bran.
| Parameters | Parboiled Rice Bran (%) | Defatted Rice Bran (%) |
| Moisture | 9.33±0.33* | 10.11±0.19* |
| Ash | 9.44±0.19* | 12.99±0.15* |
| Fat | 12.55±0.58* | 1.36±0.07* |
| Crude Fiber | 13.06±0.39NS | 12.84±0.24NS |
| Protein | 24.90±0.36* | 20.78±0.25* |
| Carbohydrate | 43.78 | 54.76 |
| Nitrogen Free Extracts | 43.16 | 32.40 |
Values are means ± SD calculated as percentage for two types rice bran, analyzed individually in triplicate. Here, * indicates significant difference; NS indicates difference is non- significant.
Optimization of Protein Extraction Condition
Experimental values of rice bran protein concentrate yield obtained at different design point of experiment are presented in Table 2. Protein concentrate yield ranged from 0.7 to 12.47% of rice bran and the highest yield was 12.47% when extracted at pH 9.5 and solvent and solid ratio 40:1 (Table 2).
Table 2: Factors (solvent: solid and pH) and their levels used in the full experimental design and the response protein yield obtained.
| Std order | Solvent : solid | Solvent pH | %yield of RBPC |
| 1 | 30 | 8.5 | 0.7 |
| 2 | 50 | 8.5 | 1.99 |
| 3 | 30 | 10.5 | 1.25 |
| 4 | 50 | 10.5 | 6.2 |
| 5 | 25.86 | 9.5 | 1.27 |
| 6 | 54.14 | 9.5 | 1.4 |
| 7 | 40 | 8.09 | 7.26 |
| 8 | 40 | 10.91 | 5.24 |
| 9 | 40 | 9.5 | 12.16 |
| 10 | 40 | 9.5 | 12.32 |
| 11 | 40 | 9.5 | 10.3 |
| 12 | 40 | 9.5 | 11.35 |
| 13 | 40 | 9.5 | 12.47 |
Table 3: Regression equations for observed responses of the experiments of protein extraction process along with ANOVA results.
| Response | Regression equations | Model Prob>F | R2 | AdjR2 | LOF Prob>F | CV | SD |
| Yield | 11.72+0.8A+0.24B+0.92A*B-5.51A2-3.05B2 | 0.0005 | 0.934 | 0.884 | 0.0563 | 25% | 1.621 |
The influence of two independent variables towards protein yield was reported through the second order polynomial regression equation (Table 3). For protein concentrate yield, effect of pH (A), extraction solvent ratio (B) observed in first order linear effect (A, B), second order quadratic effect (A2 and B2) and interaction effect (AB). Result also showed that the linear and interaction coefficient for extraction pH and solid solvent ratio were positive but second order quadratic effect was negative. It indicates that the yield of protein was increased with the increasing of extraction pH and solvent ratio.
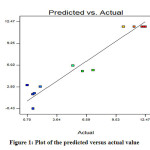 |
Figure 1: Plot of the predicted versus actual value. |
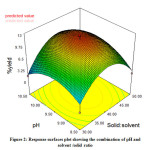 |
Figure 2: Response surfaces plot showing the combination of pH and solvent /solid ratio. |
A graphical representation of the models’ quality can be seen in Figure 1. The predicted versus actual values for the yield of protein concentrate shows that the predicted values are closed to the actual values. It indicated the model fitted very well with the data. The response surface plot (Figure 2) showed the quadratic effect of pH and solid (bran)/ solvent ratio on protein concentrate extraction. The curve in Figure 2 reveals the significant (p<0.05) increase in protein concentrate with increasing pH of solvent and bran /solvent ratio.
Multiple Optimization and Model Validation
An optimum response surface model has been generated based on protein concentrate yield. Optimization was considered as a key element to maximize the process efficiency with increased output. The aim of this analysis was to ascertain the best process parameter for maximum yield of protein concentrate. Table 4 shows the optimum value for factors and responses.
A solvent/solid ratio and solvent pH were 40.77:1 (v/w) and 9.55 respectively. Optimum extraction conditions were estimated by the highest desirability (0.939) method using a Minitab Software. The optimum predicted value for protein concentrate yield was 11.76% at optimum extraction condition (Table 4). Three experiments were run according to recommended optimum conditions to test the adequacy of the response surface model. A comparison between optimum value and the experimental value of response (protein concentrate) was done for validation test. The experimental value of protein concentrate was 11.71 which is remarkably close to predicted optimum value (11.76%). Researcher found the similar result in plant material. Previous study also found significant effects of solvent/solid ratio on protein concentrate yield while they extract protein concentrate from pumpkin seed and the optimum extraction yield was reported at 30.2:1 solvent/solid ratio (v/w)24.
Table 4: Predicted and experimental values of the responses at optimum condition for protein extraction.
| Factor Response | Desirability | |||
| Solid: Solvent | pH | %Yield | ||
| Predicted value | 40.77 | 9.55 | 11.76 | 0.939 |
| Experimental data | 40.70±0.09 | 9.60±0.15 | 11.71±0.06 | |
Mean ± SD
Characterization of Extracted Protein
Proximate Composition of Rice Bran Protein Concentrates
Figure 3 showed the outcome of proximate composition of RBPC extracted at optimum extraction conditions. The moisture content in rice bran protein concentrate observed 10.20% which is very close to the study of Patsanguan et al.,25 The lower moisture content of RBPC justifies the suitability for long term storage without deterioration. Yeom et al.,26 found moisture content in RBPC lower than the present study. The higher ash content in rice bran contributed to its high mineral content. The ash content of RBPC obtained 9.43% which is quite higher than the study of El-Sayed et al.,27
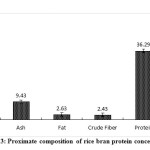 |
Figure 3: Proximate composition of rice bran protein concentrate. |
Percent of protein observed in RBPC was 36.29 and higher protein content of sample justifies the suitability of utilization of rice bran as a functional ingredient in formulation of food products to improve nutritional characteristics. This results are very close to the findings (37.6%) observed by Yadav et al.,28 but quite higher than the value (18.95%) recorded by Patsanguan et al.,25 in RBPC. The fat and crude fiber content in RBPC found 2.63 and 2.43 percent respectively. These results were in agreement with the result reported by Patsanguan et al (2014). On the other hand, comparatively lower findings were reported by Yadav et al.,28 and other researchers Yeom et al.,26 and Chittapalo et al.,29
Amino Acid Profile of Rice Bran Protein Concentrate:
Amino acid profile refers to the percentage of amino acids present in RBPC. The experimental data revealed that RBPC contained most of Essential Amino Acids (EAA) and that were Leucine, Isoleucine, Methionine, Lysine, Valine and Threonine with various concentrations (Table 5). It has been observed that Arginine and Leucine are the major essential amino acids in RBPC that were 2.72 and 1.71 percent respectively which was close to the findings of El-Sayed et al.,27
Table 5: Essential and Non-Essential Amino Acid Profile of RBPC.
| Essential Amino Acids | Value (%) | Non-Essential Amino Acids | Value (%) |
| Threonine | 0.88 | Aspartic Acid | 1.94 |
| Valine | 1.28 | Serine | 1.14 |
| Methionine | 0.54 | Glutamic Acid | 2.78 |
| Isoleucine | 0.78 | Alanine | 1.53 |
| Leucine | 1.71 | Glycine | 1.47 |
| Histidine | 0.59 | Tyrosine | 0.93 |
| Lysine | 1.54 | ||
| Arginine | 2.72 |
In addition to the essential amino acid, limiting amino acids histidine and methionine also found 0.59 and 0.54 percent respectively whereas wang et al.,2 observed quite higher amount (7.11 and 2.82 respectively) in RBPC. Table 5 also shows that RBPC contained 0.88 and 0.78 and 1.28 percent Threonine and Isoleucine and Valine respectively which is quite similar to result obtained by Patsanguan et al.,25 who reported 0.13, 1.14 and 1.04 respectively in rice bran protein isolate. Rice bran protein concentrate also contained non-essential amino acid such as; aspartic acid, serine, glutamic acid, alanine, glycine and tyrosine (Table 5). These results are comparable to the values reported by Patsanguan et al.,25 and others findings2 but quite lower than the findings observed by Prakash & Ramaswamy30 and El-Sayed et al.,27. Nutritional quality of protein depends on its essential amino acids (EAA). Rice bran protein concentrate most of the essential amino acids so that it’s bran can be used effectively in human nutrition; also it is possible to improve the protein quality parameters by amino acid supplementation.
Functional Properties of Rice Bran Protein Concentrate
Different functional properties of RBPC are shown in Table 6. The functional properties are the physico-chemical nature of protein, which affects the sensory profile of the product. The result of emulsifying capacity of RBPC obtained from this study (56%) was within the value cited by Chandi and Sogi31 (24- 74%). RBPC had higher emulsifying capacity compared to the findings of Yadav et al.,28 (40%). The prepared emulsion was less stable (36 min) than value obtained (43.15 min) by Theerakulkait et al.,32 (43.15 min). The noticeable differences observed may be due to pH which is found varied in different studies.
Table 6: Functional Properties of RBPC.
| Properties | Value |
| Emulsifying capacity (%) | 56±1.41 |
| Emulsifying stability (min) | 36±1.41 |
| Water absorption capacity (g/g) | 3.02±0.26 |
| Oil absorption capacity (g/g) | 1.72±0.04 |
| Bulk density (g/ml) | 0.49±0.01 |
| Foaming capacity (pH 8 & 10) (%) | 42±2.12 & 54±0.71 |
| Foaming Stability (pH 8 & 10) (min) | 31.5±2.12 & 43.5±1.77 |
Values are means ± SD calculated as percentage for two types rice bran, analyzed individually in duplicate.
In the present study, obtained lower water binding capacity value of RBPC (3.02 g water/g sample) compared to reported value by Chandi and Sogi31(3.87–5.60 g/g). However, water binding capacity of RBPC was similar with the value (2.9 g/ml) reported by Yadav et al.,28 On the other hand, Gupta et al.,33 found lower value (1.1-2.27 g/g and 1.72 to 2.69 g/g) than the value of present investigation. The higher water absorption capacity could be attributed to the presence of greater amount of hydrophilic constituents.34 High water absorption of proteins helps to reduce moisture loss in packed bakery goods.30 RBPC had the lowest oil binding capacity value being 1.72 compared to the other findings such as Yadav et al.,28 (2.3 ml/g), Patsanguan et al.,25 (1.85 to 3.75 g/g) and Chandi and Sogi31(3.74 – 9.18 g/g). However, oil binding capacity of RBPC was similar with the value reported by Gupta et al.,33 (1.64 and 6.89 g/g). The oil absorption used for increase mouth feel and flavor retention. The obtained bulk density value of RBPC (0.49 g/ml) was similar with the value reported by Yadav et al.,28 (0.4 g/ml). Rice bran protein concentrate had been analyzed for foaming capacity and stability at two pH levels (8 and 10). From this study, it was observed that obtained value of foaming capacity and stability for pH 8 (42% and 31.5 min) and for that pH 10 (54% and 43.5 min) was within value obtained by Yeom et al.,26 (40-90% and 30-90 min). This value depends on the concentration of the solution and pH condition.26
Proximate Composition of Biscuits Prepared by Using RBPC
The proximate composition of 5 % level of substitution of rice bran protein concentrate biscuit were comparable to control biscuits (Figure 4). Significant increase in moisture (from 2.75 to 3.96), ash (from 4.40 to 8.45) and protein (from 7.54 to 9.13) in rice bran protein concentrate substituted biscuits, whereas significant decrease of fat content (20.79) in non-substitute RBPC biscuits and RBPC substituted biscuits (14.28) was observed. Previous study also revealed the significant increase of protein content in 15% RBPC supplemented biscuit.28
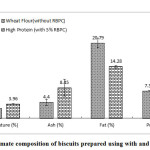 |
Figure 4: Proximate composition of biscuits prepared using with and without RBPC |
Physical Attributes Analysis of Biscuits Prepared using RBPC
Physical characteristics of biscuits, such as thickness and length were affected significantly (p < 0.05) with the addition of RBPC (Table 7). The average length of control biscuit was 4.38 cm whereas that of supplemented biscuits had 5.02 cm. It has been observed that the volume and density of the control biscuits were not significantly different from the supplemented biscuit (Table 7). This occurred probably due to the ability of the RBPC to absorb more water and to retain oil during the baking process.
Table 7: Physical Analysis of prepared using RBPC.
| Physical Attributes | Wheat Flour biscuit(without RBPC) | High Protein biscuit(with 5% RBPC) |
| Thickness (cm)Length (cm)Volume (cm3)Spread ratioDensity (g/ml)Spread Factor | 1.07±0.11*4.38± 0.17*16.54±1.02NS4.12±0.36NS0.55±0.07NS97 | 1.25±0.02*5.02± 0.23*19.78±2.54NS4.02±0.14NS0.49±0.03NS98 |
Values are means ± SD calculated for rice bran protein concentrate, analyzed individually in tetracate. Here, * indicates significant difference; NS indicates difference is non- significant.
The results reflected that the changes in diameter and thickness have effects on spread ratio and percent spread of biscuit. The spread ratio and percent spread of control biscuit were 4.12 and 97 respectively. The spread ratio of the high protein biscuits decreased to 4.02 as the 5 percent concentration of RBPC increased in the blends. Klunklin and Savage35 also reported the reduction in spread ratio of the mussel powder (high protein content) fortified biscuit substituted with wheat flour from 10 to 20 percent.
Sensory Evaluation of Biscuits Prepared by using Rice Bran Protein Concentrates
Table 8 shows the sensory evaluation score of biscuits prepared using rice bran protein concentrate and control biscuit. The biscuits prepared by replacing wheat flour with 5 per cent RBPC were not significantly different from control biscuits with respect to color, taste, flavor, texture and overall acceptability. Result reveled that flavor and color of biscuits prepared using RBPC were better than control. On the other hand, control biscuits had superior texture and taste than that of RBPC substituted biscuits.
Table 8: Sensory evaluation of biscuits prepared by using rice bran protein concentrates.
| Quality Attributes | Wheat Flour Biscuit(without RBPC) | High Protein Biscuit(with 5% RBPC) |
| General appearance | 7.72±0.78* | 7.54±0.52* |
| Flavor | 7.54±0.82NS | 7.63±0.67NS |
| Color | 7.72±0.64NS | 7.81±0.40NS |
| Texture | 7.81±0.75NS | 7.45±0.68NS |
| Taste | 7.90±0.70NS | 7.18±0.75NS |
| Overall acceptability | 7.90±0.83* | 7.72±0.64* |
Values are means ± SD ; Here, * indicates significant difference; NS indicates difference is non- significant.
Bera and Mukherjee (1989) reported that RBPC could safely be incorporated in biscuit up to 5 per cent. Replacement of refined wheat flour with up to 10 per cent RBPC produced protein–enriched biscuits with moderately desirable overall acceptability.36 Jiamyangyuen et al.,12 also found that 1% level of defatted RBPC in bread was most acceptable. Result also showed that as compared to control biscuits with rice bran protein concentrate had high acceptability by the panelist.
Conclusion
Protein concentrate was extracted using alkali extraction method and optimization of protein extraction condition was done using central composite design of response surface methodology. Yield of rice bran protein concentrate from defatted rice bran was significantly (p<0.05%) affected by extraction process parameter. Optimum process variables for extraction of protein concentration from defatted rice bran with alkali extraction method were 1:40.77and 9.50 for solid/ solvent ratio and pH of solution respectively which gave protein yield 12.47 % and protein content 36.29%. PH had most significant effect on yield of protein concentrate followed by ratio of extraction solvent. Before incorporation of rice bran protein concentrate in biscuits, it had been analyzed to seek out the compatibility. Rice bran protein concentrate were characterized for their chemical and functional activities. Extracted rice bran protein concentrate showed high emulsifying and foaming capacity. Among eight essential amino acids, arginine was found highest amount (2.72%). On the other hand, among six non-essential amino acids, glutamic acid was found in highest amount (2.78%). The addition of 5% rice bran protein concentrate in biscuit formulation found higher protein and fiber content but little decrease in the overall acceptability by the panelist. Rice bran protein concentrate can be beneficially utilized by incorporating at 5 percent level to formulate protein enriched biscuits to upgrade the nutritional quality without affecting sensory quality significantly. These biscuits are enhanced with nutritional value especially for malnourished or undernourished people and can be easily affordable for them.
Acknowledgments
The authors would like to acknowledge Ministry of Science and Technology, Bangladesh for awarding a grant (project ID: GS191) to peruse the research.
Funding Sources
The authors would like to acknowledge Ministry of Science and Technology, Bangladesh for awarding a grant (project ID: GS191) to peruse the research.
References
- Oduguwa O. O., Edema M. O. and Ayeni A. O. Physico-chemical and microbiological analyses of fermented corn cob, rice bran and cowpea husk for use in composite rabbit feed. Bioresource technology. 2008; 99(6):1816-1820.
- Wang M., Hettiarachchy N. S., Qi M., Burks W. & Siebenmorgen T. Preparation and functional properties of rice bran protein isolate. Journal of Agricultural and Food Chemistry. 1999; 47(2): 411-416.
- Han S.W., Chee K. M. and Cho S. J. Nutritional quality of rice bran protein in comparison to animal and vegetable protein. Food chemistry. 2015; 172: 766-769.
- Dutta D., Parvej M.S. and Afsar A. M. Evaluation of mechanical properties of de-oiled rice bran reinforced polypropylene composites. In AIP Conference Proceedings. 2018; 1980 (1): 030003.
- Begum M. E. A., Hossain M. I. and Haese L. D. Food security in Bangladesh: Present status and trend. Progressive Agriculture. 2013; 24(1-2): 263-271.
- Horax R., Hettiarachchy N.S., Chen P. and Jalaluddin M. Preparation and characterization of protein isolate from cowpea (Vigna unguiculata L. Walp.) Food Sci. 2004; 69:114-118
- Agboola S., Ng D. and Mills D. Characterization and functional properties of Australia rice protein isolates. J. Cereal. Sci. 2005; 41: 283-290
- Paraman I., Hettiarachchy N.S., Schaefer C. and Beck M.I. Hydrophobicity, solubility, and emulsifying properties of enzyme-modified rice endosperm protein. Cereal Chem. 2007; 84: 343-349
- Ronny H., Navam H., A. K. and Pengyin C. Protein extraction optimization, characterization, and functionalities of protein isolate from bitter melon (Momordica charantia) seed. Food Chem. 2010; 124: 545-550.
- De Groot A. P., & Slump P. Effects of severe alkali treatment of proteins on amino acid composition and nutritive value. The Journal of nutrition. 1969; 98(1): 45-56.
- Rustom I.Y.S., Lopez-Leiva M.H. and Nair B. M. Optimization of extraction of peanut proteins with water by response surface methodology. J. Food Sci. 1991; 56: 1660-1663.
- Jiamyangyuen S., Srijesdaruk V., & Harper W. J. Extraction of rice bran protein concentrate and its application in bread. Extraction, 2005; 27(1): 56.
- In Approved Methods of American Association of Cereal Chemists, 10th Ed., American Association of Cereal Chemists, St. Paul, M.N. 2000.
- D497.1 MAR93. Agricultural machinery management data. ASAE Standards, 328- 334, ASAE, St. Joseph, MJ, USA. 1993.
- Sosulski F.W., Garratt M.O. & Slinkard A.E. Functional properties of ten legume flours. International Journal of Food Science and Technology.1976;9: 66-69.
- Yasumatsu K. K., Sawada S., Maritaka J., Toda T., Wada K. I. Whipping and emulsifying properties of soy bean products. Agri Biol Chem. 1972; 36: 719–727.
- Kato A., Shimokawa K., & Kobayashi K. Improvement of the functional properties of insoluble gluten by pronase digestion followed by dextran conjugation. Journal of Agricultural and Food Chemistry. 1991; 39(6): 1053-1056.
- Lawhon J. T., Cater C. M., & Mattil K. F. comparative study of the whipping potential of an extract from several oilseed flours. Cereal Science Today. 1972; 17(4): 240-294,
- Ahmed E. A. and Chmidt R.H. Functional properties of peanut and soybean proteins as influenced by processing method. Peanut Sci.1979; 6: 1-6.
- Narayana K. and M. S. Narasinga Rao. Functional properties of raw and heat processed winged bean (Psophocarpus tetragonolobus) flour. J. Food Sci., 1982; 47: 1534-1538.
- Moure A., Rua M., Sinerio J., & Dominguez H. Aqueous extraction and membrane isolation of protein from defatted Guevina avellana. Journal of Food Science. 2002; 67: 688–696.
- Prodhan U. K., Linkon K.M.M.R., Al-Amin MF., Alam MJ. Development and quality evaluation of mushroom (pleurotussajor-caju) enriched biscuits. Emirates Journal of Food and Agriculture. 2015. 27(7): 542-547 doi: 10.9755/ejfa.2015.04.082.
- Ly H. L., Tran T. M. C., Tran T. T. T., Ton N. M. N., & Le V. V. M. Application of ultrasound to protein extraction from defatted rice bran. International Food Research Journal. 2018; 25(2): 695-701
- Quanhang L. and Caili F. Application of response surface methodology for extraction of germinant pumpkin seeds protein. Food Chem. 2005; 92:701-706.
- Patsanguan S., Hisaranusorn N., Phongthai S., & Rawdkuen S. Rice Bran Protein Isolates: Preparation and their Physico-Chemical and Functional Properties. Food and Applied Bioscience Journal. 2014;2(3): 169-182.
- Yeom H. J., Lee E. H., Ha M. S., Ha S. D., & Bae D. H. Production and physicochemical properties of rice bran protein isolates prepared with autoclaving and enzymatic hydrolysis. Journal of the Korean Society for Applied Biological Chemistry. 2010; 53(1): 62-70.
- El-Sayed I. Y., Yasser F.M. K., Hemat E., Elsheshetawy and Mohamed A. A. E. Functional and Nutritional Characteristics of Prepared Rice Bran Protein Products. World Journal of Dairy & Food Sciences.2016; 11 (1): 100-108.
- Yadav R. B., Yadav B. S., & Chaudhary D. Extraction, characterization and utilization of rice bran protein concentrate for biscuit making. British Food Journal. 2011; 113(9):1173-1182.
- Chittapalo T. and Noomhorm A. Ultrasonic assisted alkali extraction of protein from defatted rice bran and properties of the protein concentrates. International Journal of Food Science and Technology. 2009; 44: 1843- 1849.
- Prakash J., & Ramaswamy H. S. Rice bran proteins: properties and food uses. Critical Reviews in Food Science & Nutrition. 1996; 36(6): 537-552.
- Chandi G. K., & Sogi D. S. Functional properties of rice bran protein concentrates. Journal of Food Engineering. 2007; 79(2): 592-597.
- Theerakulkait C., Chaiseri S., & Mongkolkanchanasiri S. Extraction and some functional properties of protein extract from rice bran. Kasetsart J. (Nat. Sci.), 2006; 40(5): 209-214.
- Gupta S., Chandi G. & Sogi D. Effect of Extraction Temperature on Functional Properties of Rice Bran Protein Concentrates. International Journal of Food Engineering. 2008; 4(2): 21
- Akubor P. I., & Badifu G. I. Chemical composition, functional properties and baking potential of African breadfruit kernel and wheat flour blends. International journal of food science & technology. 2004; 39(2): 223-229.
- Klunklin W., & Savage G. Addition of defatted green‐lipped mussel powder and mixed spices to wheat–purple rice flour biscuits: Physicochemical, in vitro digestibility and sensory evaluation. Food Science & Nutrition. 2018; 17; 6(7):1839-1847.
- Bera M. B. and Mukherjee R. K. Solubility, emulsifying, and foaming properties of rice bran protein concentrates. Journal of food science, 1989; 54(1):142-145.

This work is licensed under a Creative Commons Attribution 4.0 International License.


