

Introduction
Physical inactivity and overweight / obesity have been classified as the fourth and fifth major causes of deaths worldwide, and are among the risk factors to chronic diseases including diabetes, heart diseases, and hypertension.1, 2 Due to the increasing rates of overweight and obesity in adolescents,3 implementation of effective prevention interventions is of utmost health importance. Higher rates of obesity in adolescents’ have been reported in high income countries.4 However, developing nations are faced with the triple burden of nutritional problems.5 Kenya is not exempted and is facing an increase in overweight and obesity, particularly in urban areas.6 In light of the United Nations –Non Communicable Disease Declaration, and in line with the Sustainable Development Goal 3,7 and the Kenya Vision 2030, advocating for healthy lifestyles such as adequate physical activity and healthy food consumption habits for all Kenyan adolescents, is a priority.8 According to a report by Healthy Active Kids Kenya, 2016, about 50% of children and adolescents in Kenya participate in adequate physical activity (HAAK, 2016). Studies conducted by Adamo and Ojiambo9, 10 revealed that Kenyan children living in urban areas spend plenty of time in sedentary activities compared to those in rural areas. Schools have been singled out as crucial environments for implementing physical activity programmes to avert this emerging public health problem, owing to the fact that they are in constant touch with the adolescents.11 Adolescents require sixty minutes or more of physical activity every day. Most of the weekly activities should be of moderate or vigorous intensity to accumulate at least 1500-3000 metabolic equivalent tasks (MET)-minutes. Globally, 81% of adolescents are physically inactive12while in Kenya only 12.6% of children are reported to meet the sixty minutes or more recommendation of moderate or vigorous physical activity per day.13 In Kenya, school children have been reported to have moderate nutrition knowledge. A study among school children in Nairobi revealed that the children had moderate nutrition knowledge (mean score 5.16 + 1.6, 51.6%) and poor dietary practices associated with negative attitude.14 Unhealthy eating habits are strongly associated with obesity. Hence, to encourage healthier eating habits, knowledge in nutrition needs to be promoted,15 and therefore intervention activities that target raising awareness on overweight and obesity and related health risks remain a priority.
Adolescents have also been reported to show inappropriate dietary habits such as excessive consumption of calorific meals and sweetened snacks and drinks while consuming less of fruits, vegetables and fish.16 A study conducted in Iran reported that only 9.3% of adolescents had appropriate nutrition practice,17 while in Nigeria, only 15% of adolescents consumed fruits and vegetables.18 In Kenya, a study by Okeyo et al., revealed that dietary practices of adolescents were inappropriate.19
Kenya is already reporting increasing trends in NCDs including cancer, diabetes and cardiovascular diseases among adult population.20 Among Kenyan children and adolescents, respectively combined prevalence of 15.5% overweight/obesity has been reported.21 This is similar to global trends that indicate combined prevalence of more than 18% of overweight and obesity among the age group 5-19 years.22
Interventions during childhood and adolescence are important as it has been shown that overweight/ obese children can probably become overweight/ obese at adolescence and consequently overweight/obese at adulthood.23 The early stages of life (childhood and adolescence), provide a “window of opportunity” to prevent these trends in adulthood. Several intervention studies have shown a reduction in overweight/obesity for the ages 15-18 years. While intervention studies to lessen the burden of overweight and obesity in adolescents have been carried out extensively worldwide, such studies are limited in the Kenyan population. It is against this background that the study investigated the effect of a school focused physical and nutrition education intervention on weight status amongst adolescents in Uasin Gishu County, Kenya.
Materials and Methods
Study Design
This was a cluster-Randomized Controlled Trial (RCT) with two study arms to test the effect of a school focused nutrition and physical education intervention programme on the weight status of adolescents in secondary schools in Kenya. The schools were randomized into study arms rather than the individual participants to avoid contamination of information from one study arm to the other.
Study Area and Study Population
The study was conducted in public urban mixed day secondary schools in Uasin Gishu County, Kenya, during the months of August 2018 to March 2019 for both the control and the intervention groups. The County is situated in Mid-West region of Kenya’s Rift Valley. The County has 198 secondary schools; 36 private and 162 public schools. The study population was adolescents 15-18 years old attending mixed public schools in Eldoret town. The inclusion criteria for the study participants were: adolescents: 15-18 years old; in form two; willing to participate in the study; those whose parents/guardians accorded the study team written informed consent. The exclusion criteria were those adolescents with documented health-related impairments and could not participate in physical exercises, as reported by the school nurse or the class teachers were excluded from the study.
Sample Size Determination
Sampling methodology and Randomization Process
Multi-stage sampling was undertaken to select the schools that were included in the study (Figure 1). In the first stage, ten mixed public day schools that were eligible for participation were purposively selected. The eligibility criteria for the schools were; having at least two streams (a stream has an average of 40 students) in form two. Four schools were then selected out of these ten by simple random sampling using a Table of Random Numbers. The four selected schools were then randomly placed into the intervention and the control study arms (two in each of the arms) (Figure 1) using an excel software by a biostatistician who was blinded to the study hypotheses.
Recruitment of Study Participants to the Study Arms
Equal numbers of students (111 per study arm) were sampled from each school (Figure 1) to take part in the study giving a total of 222 participants. The students were placed in the study arm dependent on the group in which their school was randomly placed. Students were sampled proportionately according to the ratio of boys to girls in each of the schools. Recruitment of study participants was conducted by the researchers by simple random sampling using a table of random numbers from the list of the form two students who met the inclusion criteria.
Blinding Design
Only the researcher was aware of the study hypotheses and the treatment given to the intervention arm. The hypotheses of the study was concealed from the research assistants both those offering PE and nutrition education and those collecting data. Furthermore, the research assistants offering PE and nutrition education were not the same ones collecting data from the adolescents.
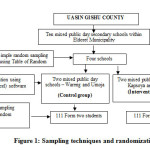 |
Figure 1: Sampling techniques and randomization. Click here to View figure |
Baseline Data Collection
Upon recruitment into the study, baseline data was collected from the participants.
Control Group
The schools in the control group received no intervention from the research team during the study. The participants received the regular/typical school curriculum, in which all schools in Kenya have weekly 40 minutes physical education (P.E) class sessions. The sessions do not include a gym instructor to facilitate physical fitness training programme. The PE lessons are in many instances used to teach other examinable subjects in many schools,23 in an attempt to perform well in national examinations. The control group did not receive the Nutrition education lessons, but followed the regular school curriculum which includes regular life skills lessons.
The Intervention Group
Upon recruitment into the study, baseline data was collected from the participants. Interventions were administered to the schools in this study arm after baseline data collection. The Nutrition and Physical Education Intervention was aimed at improving the knowledge, attitudes and skills to enhance healthy eating behavior and to improve Physical activity levels among adolescents. This group was not restricted from following the regular school curriculum that the control group received. The intervention had two components; nutrition education and physical education.
Physical Education Component of the Intervention
Physical Education was taught to students by the researchers assisted by two physical fitness instructors in the classroom, and in the school sports field during the PE lesson. All schools in Kenya have 40 minutes regular physical exercise (P.E) class session each week. The sessions were conducted weekly during the afternoon periods, between 3.20 pm and 4.00 pm.
The PE sessions consisted of both theory and practical components. The theory component was conducted in the classroom, for duration of 40 minutes, and was facilitated by the principle researcher, a week before the practical session.
The practical components were conducted in the school sports field, for duration of up to 60 minutes, and were facilitated by physical fitness instructors, who were part of the research team.
The physical fitness instructors facilitated the sessions with reinforcement from the principal researcher and the games teachers. The demonstrations started with warm up exercises such as jogging and running round the field. This was then followed by physical exercises for the specific session, and then ended with warm up exercises. Participants were engaged in different types of physical exercises. The lessons extended into the games time.
Sessions two to eight of the PE focused on at least 60 minutes of moderate to Vigorous Physical Activity (MVPA) per day. A total of seven sessions, 40 to 60 minute each of enhanced, supervised physical fitness sessions, guided by two physical fitness instructors and the principal researcher were conducted in the field in each of the intervention schools during PE lessons. The specific PE mode included aerobic exercises such as jogging, running, walking to and from school, cycling, ball playing, and rope skipping and dancing. Resistance, balance, and flexibility exercises were also conducted (Table 1). The students were encouraged to participate in physical fitness activities during school breaks, and at home; and a follow up on whether students achieved the 60 minutes or more of MVPA daily target was done in the next session. Students who achieved the set target would get positive reinforcement such as praise from the research team.
The Content of the Physical Education Component
The first session was used to highlight the different types of Physical activity, health benefits of PA and ways of reducing sedentary time. This was done through a combination of learning methods (lecture, role-play, and group discussions), where participants were engaged in discussing the types of physical exercises they engage in, how and where they do them and ways in which they could improve on their PA levels. The PA pyramid for adolescents was used to elaborate on the different types of PE students could engage in (Table 1).
Table 1: Physical Education Schedule in Intervention Schools.
| Session | Duration (minutes) | Content | Teaching/learning activities | Learning resources |
| 1 | 40 | Definition of physical activity Examples of physical activitiesHealth benefits of physical activityBenefits of healthy eating | Lecture, role play and class discussion | Physical activity pyramid |
| 2 | 40 | Aerobic exercises – jogging, running, | Demonstrations,Physical exercise in the field | Play field |
| 3 | 40 | Balance and aerobic exercises – Rope skipping, | Demonstrations,Physical exercise in the field | Play field, skipping ropes |
| 4 | 40 | Flexibility Aerobic exercises – rope skipping, jogging, | Demonstrations,Physical exercise in the field | Skipping ropes, play field |
| 5 | 40 | Resistance exercise- press ups, pull and push etc Aerobic exercises – Hand ball, volley ball, foot ball | Demonstrations,Physical exercise in the field | Hand ball, football, volley ball, play field |
| 6 | 40 | Balance, resistance, flexibility exercises | Demonstrations,Physical exercise in the field | Play field |
| 7 & 8 | 40 each | Aerobic exercise- jogging, aerobic dance | Demonstrations,Physical exercise in the field | Play field |
Nutrition Education component of the intervention
The nutrition education was conducted in the classrooms by the researcher assisted by two research assistants. The lessons were conducted during the morning sessions, between 10.20 am and 12.30 pm (specific time differed from one intervention school and the other). Each of the session lasted 40 minutes.
The Content of the Nutrition Education Sessions
The nutrition content included; Healthy Eating (promoting intake of fruits, vegetables, fibre, intake of water and reducing consumption of unhealthy foods including western fast foods); Health Risks of Overweight and Obesity and Benefits of PA; The link between PA, diet and chronic diseases (Table 2). The content was delivered through class discussions, question and answer method, role play, and demonstrations. The lessons were planned and delivered in accordance with the Ministry of Education guidelines during the life skills lesson. The lessons were taught each week for eight weeks, within one term of the school calendar year. The learning resources included charts on various food sources, junk food flip charts, food guide pyramid, BMI charts and notes on nutrition.
Table 2: Nutrition Education Schedule in Intervention Schools.
| Session | Duration (min) | Content | Teaching/learning activities | Learning resources |
| 1 | 40 | Food groups and nutrients.Classification of nutrients with specific examples | Class discussion Writing notes | Food guide pyramid |
| 2 | 40 | Carbohydrates, fats and oils ClassificationFunctions of carbohydrates, fats and oilsSaturated/unsaturated fats | Class discussion Writing notes | Charts on food sources of carbohydrates, fats and oils |
| 3 | 40 | Water and fibre Importance and sources | Question and answer method Writing notes | Charts on various food sources of fibre |
| 4 | 40 | Practical advice on daily healthy food choices, benefits of healthy eating, | Power point presentation Question and answer method | My plate vs junk food flip chart |
| 5 | 40 | Overweight and obesity causes with focus on diets and physical activity | Power point presentation, discussion | Junk food flip chart |
| 6 | 40 | Health risks of overweight/obesity | Power point presentation Question and answer method | Handouts, relevant charts |
| 7 | 40 | Link between diet, PA and NCDs – risk factors of chronic NCDs | Power point presentation | Handouts, relevant charts |
| 8 | 40 | Weight classification based on BMI-calculation of BMI | Practical activity | BMI chart |
Brief health related messages and posters to promote healthy eating and physically activity behaviors were provided in the intervention schools and displayed inside the classrooms, notice boards and playground.
Data Collection Instruments and Procedures
Data was collected from both study groups arms at baseline, at 8 weeks and at 6 months post intervention. The study adapted previously validated instruments, which were further pre-tested prior to the main study, in a school with similar characteristics as the participants in the main study. The instruments included:
1. A students’ questionnaire that elicited information on socio-demographic characteristics such as age and sex of the student. This questionnaire was also used to record the weight, height and waist circumference measurements of the participants.
Students’ data was collected in the classrooms by the researchers assisted by two trained research assistants. Weight was measured to the nearest 100 g, with minimal clothing and without shoes, using a calibrated portable Seca bathroom Scale. Height was measured to the nearest 0.1 cm with the participant in standing position without shoes using a calibrated Seca 213 portable stadiometer. The waist circumference of the study participants was measured and converted to the nearest 0.1 cm. The measurements were taken after a normal expiration and with light clothing using a stretch-resistant tape.25 All measurements were taken twice then the mean of the two readings was calculated if the measurements were within the acceptable margin of error.
2. A Parents’/guardians’ questionnaire to collect information on the families’ socio-demographic and socio-economic characteristics (including parental education and family size). The questionnaires were sent home to parents/guardians through their son/daughter. The answered questionnaires were sent back to the researcher in sealed envelopes b the son/daughter
Data Analysis
Data was entered in Epi-data version 3.5. It was cleaned and analysed using Statistical Package for Social Sciences (SPSS version 21). The outcome variables were overweight and obesity status determined by BMI for age z scores 26 and waist circumference. Overweight was expressed as BMI-for-age z score >1 – <2, while obesity was defined as BMI -for-age z score >2. BMI-for-age z score >-1 – <1 was considered normal. Body mass index (BMI) was obtained from weight and height (kg/m2) converted to z-scores for age and sex26.Waist circumference cut off was 88cm for females and 102cm for males27. Descriptive statistics including frequencies, mean, standard deviation and percentages were used to report data on demographic characteristics for instance, age and sex and the magnitude of overweight and obesity of the adolescents. Chi-square test was performed to determine the association between physical and nutrition education and weight status of the students in bivariate analysis. Mean change differences between the intervention and control group were tested using independent sample t-test. A one way Analysis of Variance (ANOVA) was used to determine the effect of Physical and nutrition education on weight status of the adolescents.
Ethical Clearance
Parents of the participants gave written consent while the participants gave informed assent for inclusion before they participated in the study. Participation was voluntary and those who declined to participate were excluded from the study. The study was conducted in accordance with the Declaration of Helsinki, and the protocol was granted ethical clearance by the Ethics Committees of Kenyatta University (Ref. No. PKU/811/1877), a research permit by the National Commission for Science, Technology and Innovation, Kenya (Ref. No. NACOSTI/P/18/67641/23865) and approval by the Ministry of Education, State Department of Basic Education (Ref No. MOEST/UGC/TRN/9/VOL 111/42). To ensure confidentiality, codes rather than names were used to identify participants and all data collected were kept in locked cupboards and password protected files.
Results
Participant Recruiment and Data Collection Process
A total of 465 participants/adolescents were eligible to participate in the study (Figure 2). Out of 222 form two adolescents aged 15 – 18 years were recruited and participated in the study (Figure 2). A baseline survey was conducted among all the 222 (111 per study group). At 8 weeks post intervention, data was collected from 208 students (109 in intervention arm and 99 in the control arm), while at 6-months post intervention, data was collected from 190 students (100 in intervention group and 90 in the control group). Eleven (11) were lost to follow-up in the intervention group, while 21 were lost to follow-up in the control group.
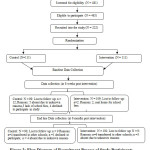 |
Figure 2: Flow Diagram of Recruitment Process of Study Participants. Click here to View figure |
Baseline Findings
Demographic Characteristics of the Study Participants at Baseline
Proportion of male participants (49.1%) was similar to the females (50.9%) in the study. By study group, there were 66 (60.6%) and 43 (39.4%) males, with 45 (39.8%) and 68 (60.2%) females in intervention and control groups respectively. The mean age was 16.49 ± 0.120 years. No significant age differences between participants in the control group and those in intervention groups were observed (T-test: -0.414; p=0.679) (Table 3). The parents mean age was 41 ±7.9 years (Table 3). The Parents of participating students in the two study groups did not differ significantly in terms of age (t-test: 0.337; p=0.738), mothers occupation (Chi-square [χ²]: 6.22; p=0.274) and marital status (χ²: 4.31; p=0.370). Most households were male headed 160 (72.1%) with only 57 (25.7%) households being female headed. Most parents (75.7%) had attained at least secondary education and above. Most students’ mothers were in informal employment 34 (15.3%) followed by formal employment 29 (13.1%). This was contrary to students’ fathers occupations. Most students’ fathers were in small scale business 53 (23.9%) followed closely by formal employment 52 (23.4%). The study groups were significantly different in terms of household head (χ²:4.19; p=0.041), mothers’ education level (χ²: 12.87; p=0.005), fathers’ occupation (χ²: 7.9; p=0.048) and family assets ownership (χ²: 11.24; p=0.011).
Table 3: Demographic Characteristics of the Study Participant at Baseline.
| N=222 | |||||
| Characteristics | Control | Intervention | Total | Chi-Square/T-test value | P-value |
| M (SD) | M (SD) | M (SD) | |||
| Age of students | |||||
| Male | 16.56(1.0) | 16.68(0.9) | 16.55(0.1) | 0.414 | 0.679 |
| Female | 16.36(0.8) | 16.38(0.8) | 16.38(0.1) | ||
| Total | 16.56(0.1) | 16.66(0.2) | 16.49(0.1) | ||
| Age of parents | 41.07 (7.7) | 42.06 (8.3) | 41.6 (7.9) | 0.337 | 0.738 |
| Household head | n (%) | n (%) | n (%) | ||
| Male | 87 (79.8) | 73 (67.6) | 160 (72.1) | 4.19 | 0.041* |
| Female | 22 (20.2) | 35 (32.4) | 57 (25.7) | ||
| Mothers’ education level | |||||
| Primary | 8 (7.7) | 26 (24.3) | 34 (15.3) | 12.87 | 0.005* |
| Secondary | 59 (56.7) | 56 (52.3) | 115 (51.8) | ||
| College | 33 (31.7) | 20 (18.7) | 53 (23.9) | ||
| None | 4 (3.8) | 5 (4.7) | 9 (4.1) | ||
| Mothers’ occupation | |||||
| Formal employment | 13 (14.8) | 16 (15.8) | 29 (13.1) | 6.22 | 0.274 |
| Large scale business | 9 (10.2) | 6 (5.9) | 15 (6.8) | ||
| Informal employment | 11 (12.5) | 23 (22.8) | 34 (15.3) | ||
| Housewife | 8 (9.1) | 14 (13.9) | 22 (9.9) | ||
| Small scale business | 44 (50) | 39 (38.6) | 83 (37.4) | ||
| Any other | 3 (3.4) | 3 (3) | 6 (2.7) | ||
| Fathers’ occupation | |||||
| Formal employment | 24 (30.8) | 28 (30.4) | 52 (23.4) | 7.9 | 0.048* |
| Small scale business | 29 (37.2) | 24 (26.1) | 53 (23.9) | ||
| Informal employment | 16 (20.5) | 35 (38) | 51 (23) | ||
| Large scale business | 9 (11.5) | 5 (5.4) | 14 (6.3) | ||
| Marital status | |||||
| Married | 82 (83.7) | 80 (75.5) | 162 (73) | 4.31 | 0.37 |
| Single | 11 (11.2) | 16 (15.1) | 27 (12.2) | ||
| Divorced | 2 (2) | 6 (5.7) | 8 (3.6) | ||
| Separated | 2 (2) | 4 (3.8) | 6 (2.7) | ||
| Any other | 1 (1) | 0 | 1 (0.5) | ||
| Those who own family assets | |||||
| Mother | 18 (18.9) | 21 (22.1) | 39 (17.6) | 11.24 | 0.011* |
| Father | 59 (62.1) | 65 (68.4) | 124 (55.9) | ||
| Grandparents | 1 (1.1) | 5 (5.3) | 6 (2.7) | ||
| Any other | 17 (17.9) | 4 (4.2) | 21 (9.5) |
The mean waist circumference, weight and mean height of the students was 75.39±7.31; 55.55±10.42 and 165.58±14.19 respectively. No significant differences between the study groups in the students’ mean waist circumference (t- test: 1.770 and 0.302; p=0.078 and 0.763), mean weight (t-test: -0.238 and 1.255; p=0.812 and 0.211) and mean height (t-test: 1.665 and 1.511; p=0.097 and 0.123) were observed at baseline for both males and females respectively (Table 4).
Table 4: Anthropometric Indices at Baseline.
| N = 222 | ||||||
| Sex | Group | |||||
| Variables | Control | Intervention | Total | |||
| M (SD) | M (SD) | M(SD) | T- test | P-value | ||
| Waist Circumference(cm) | Male | 77.1 (4.1) | 76.1 (4.3) | 76.5(0.7) | 1.77 | 0.078 |
| Female | 74.9 (4.4) | 74.7(5.4) | 74.7(0.1) | 0.302 | 0.763 | |
| Total | 76.24(4.34) | 75.24(5.02) | 75.39(7.31) | |||
| Weight(Kg) | Male | 57.6 (6.7) | 57.8 (5.8) | 57.6(0.1) | -0.238 | 0.812 |
| Female | 54.6 (5.9) | 53.5 (7.1) | 53.5(0.8) | 1.255 | 0.211 | |
| Total | 56.38(6.53) | (55.13(6.95) | 55.55(10.42) | |||
| Height(cm) | Male | 171.2 (6.8) | 169.6 (7.5) | 170.1(1.1) | 1.665 | 0.097 |
| Female | 162.0 (6.7) | 160.6 (7.1) | 161.1(0.9) | 1.511 | 0.132 | |
| Total | 167.52(8.09) | 164.04(8.50) | 165.58(14.19) | |||
| Significant at p<0.05 | ||||||
Overall, there were 43 (19.4%) underweight students, 163 (73.4%) with normal weight and 16 (7.2%) overweight (Table 5). No significant relationship between BMI for age by study group, (ӽ2 = 2.4; P =0.297) was observed. Prevalence of obesity in both study groups was 0.0%.
Table 5: Body Weight Status at Baseline.
| N=222 | ||||||
| Variables | Control | Intervention | Total | Chi-square value | p-value | |
| n(%) | n(%) | n(%) | ||||
| Underweight | Male | 19 (44.2) | 13(30.2) | 43 (19.4) | 2.43 | 0.297 |
| (BMIFA <-1) | Female | 3 (7.0) | 8 (18.6) | |||
| Normal | Male | 44 (27) | 28 (17.2) | 163 (73.4) | ||
| (BMIFA >-1 – <1) | Female | 40 (24.5) | 51 (31.3) | |||
| Overweight | Male | 3 (18.8) | 2 (12.5) | 16 (7.2) | ||
| (BMIFA >1-< 2) | Female | 2 (12.5) | 9 (56.3) | |||
| Significant at p<0.05 | ||||||
Waist Circumference and Body Weight status by Study group at 8 weeks and 6 months Post Intervention
At 8 weeks post intervention, a significant difference was observed between the mean waist circumference of the control and the intervention group (T-test: 3.229; p =0.001) (Table 6). However, no significant change in BMI for age Z scores was reported between the two groups in the same time period (T-test:-0.357; p=0.720). A lower mean waist circumference (WC) (75.51±5.86 vs. 77.68±8.37) and lower mean BMI for age Z scores (BMIFA) (-0.328±0.734 vs. -0.360±0.838) was observed among those in the intervention group as compared to those in the control group at 6 months after intervention. However, the observed difference was insignificant (p>0.05). The difference in mean WC and mean BMIFA at baseline end line were calculated for each study group. At end line (6 months post intervention) mean waist circumference increased in both study groups. However, a significant increase was only observed in the control group (t-test: 2.21; p-value=0.027), with the change in the intervention group not being significant (t-test: 0.52; p-value= 0.602). A difference of the mean differences between baseline and end line scores (difference in difference) between the two study groups was calculated. Results indicate that there were significant changes in the differences (difference in difference) in mean scores of the waist circumference (t-test: 6.611; p<0.001) and mean BMI for age z scores (t-test: 93.68; p<0.001).
Table 6: Effect of physical and nutrition education on Mean Waist circumference and Mean BMI for age Z scores.
| Mean Anthropometric Scores | ||||||
| Post Intervention | ||||||
| Study Group | Baseline mean scores ±SD | At 8 weeks mean scores ±SD | At 6 months mean scores ±SD | Difference 1SE | T-test | P-value |
| N=222 | N=208 | N=190 | ||||
| Waist Circumference (cm) | ||||||
| Control | 76.24 ± 4.34 | 76.7 ± 5.098 | 77.68 ± 8.37 | 1.4(1.0) | 2.21 | 0.027* |
| Intervention | 75.23 ± 5.018 | 74.4 ± 5.16 | 75.51 ± 5.86 | 0.3(0.8) | 0.52 | 0.602 |
| T-test | -1.59 | -3.229 | 2.086 | |||
| p-value | 0.113 | <0.001 | 0.383 | |||
| Baseline | End line | Difference | ||||
| Difference | Difference | in Difference | ||||
| Mean of group a | -1.01 | -2.17 | 1.16 | 6.61 | <0.001* | |
| minus | -2.3 | |||||
| mean of group b | ||||||
| BMS±SD | 8WMS±SD | 6MMS±SD | Difference | |||
| BMI for age | 1SE | |||||
| Z Scores | ||||||
| Control | -0.397±0.813 | -0.314± 0492 | -0.360±0.838 | 0.04(0.1) | -0.45 | 0.65 |
| Intervention | -0.329±0.824 | -0.293± 0346 | -0.328 ±0.734 | -0.0(0.1) | -0.01 | 0.991 |
| T-test | -0.619 | -0.357 | -0.346 | |||
| p-value | 0.539 | 0.72 | 0.73 | |||
| Baseline | 8 weeks | End line | Difference | 93.68 | ||
| Difference | Difference | Difference | in difference | <0.001* | ||
| Mean of groupa | 0.69 | 0.63 | 0.03 | 0.66 | ||
| Minus | ||||||
| mean of groupb | ||||||
|
*Significant at <0.05; groupa=intervention group; groupb=control group; 1Standard error; BMS=baseline mean score; 6MMS= At 6 months mean score ; Difference in difference =Baseline difference-Endline difference |
||||||
Discussion
The main aim of this study was to establish the effect of physical and nutrition education on weight status of adolescent students in mixed urban day secondary schools in Uasin Gishu County, Kenya. Adequate PA and healthy diet reduces the risk of a range of non-communicable diseases.28 In addition, weight gain has been strongly associated with health related quality of life in children and adults than weight loss; implicating a greater need for preventive strategies to tackle obesity.29 Despite this, reports indicate that more than three quarters of adolescents in the world are insufficiently physically active.30 In addition, school children in Kenya have been reported to have moderate nutrition knowledge.14 The dietary practices of Kenyan adolescents have been reported to be inappropriate.19
This study found a beneficial impact of physical and nutrition education on body weight status of adolescents at 8 week post intervention. The mean waist circumference significantly reduced in the intervention group compared to the control group, which on the contrary increased. At 6 months post intervention, waist circumference increased significantly in the control group compared to the intervention group who maintained their waist circumference. The findings of the current study are not unusual. These adolescent students were in day schools, and since no education was provided to the parents, they may not have been in a position to control their dietary intake. In addition, the students went on holiday in between the study period and hence did not receive continuous education and reinforcement from the research team, which is critical in health education. However, it is worth noting that growth in weight and height is very rapid among those in this age bracket (adolescent growth spurt). Therefore since the intervention group decreased in weight status, it implies that the intervention had an effect. The differences in mean anthropometric scores (waist circumference and BMI)(difference in difference) at baseline and end line between the control arm and the intervention arm of the study further support these positive findings of the study. The findings of the current study concur with those from reports from other studies, that school based physical and nutrition education interventions are effective in preventing overweight and obesity amongst adolescents.31-33 In addition, physical activity across the curriculum approach substantially increased in-school moderate to vigorous physical activity among children aged 6-11 years in the United states.34
Interventions that combine physical activity and nutrition education have demonstrated impact more regarding body weight reductions as compared to those that focus on either PA or NE. Findings of systematic reviews and meta-analysis have shown that interventions that combined PA and NE had favourable impact in the reduction of BMI in school children.35 The results in these reviews presented a significant change in the BMI [standardized mean difference (SMD):-0.37(95% CI:-0.63; -0.12].36-38 However, significant reductions in BMI were not observed in interventions that focused on PA only.39-40 Those interventions that focused on NE only presented similar results with SMD of -0.03((5% CI:-0.10; 0.04), p=0.39, with effect magnitude considered trivial41-42. Furthermore, Harris et al., (2009) in a meta-analysis that assessed the impact of a physical activity intervention on fat mass among school children demonstrated that interventions that combined PA and NE provided more significant results regarding fat mass reduction.43
It is important to note that school focused studies with longer intervention periods have been reported to have greater effects on overweight and obesity among children and adolescents as compared to those of shorter periods.44 Although the current study was done for a short duration, and the change in BMI for age z scores was not significantly different between the two study groups, the findings report a positive trend. Studies that document the effects of physical and nutrition education intervention on waist circumference of adolescents are limited. The current study, one of the few conducted in Sub-Saharan Africa demonstrate that physical and nutrition education interventions positively affect the waist circumference of adolescent students.
It is easy to integrate such interventions into existing school curriculum with minimal effort, and therefore emphasis should be put on importance of physical and nutrition education in schools as one way of addressing prevention efforts towards overweight and obesity.
Strategies to ensure long term effects should be conducted to enhance sustainability of results
Limitations of the study
Physical and Nutrition Education intervention could only be done within 8 weeks as the remaining school term weeks were used for continuous assessments and end year examinations, as per the Kenyan Ministry of Education calendar. The follow up assessment was conducted at 6-month post intervention, after students had come from holidays and students may have been exposed to other lifestyle factors that could have had an effect on sustainability. Due to the study duration, the study can only report short-term effects of the intervention. Longer studies may report longer-term effects. There is no African or Kenya national recommended waist circumference cut off points for adolescents and hence the cut off points used in this study are those for adults.
Conclusions
Physical and nutrition education resulted in significant decrease in waist circumference of participating adolescents. We recommend similar context-specific interventions that increase PA, in Kenyan and Sub Saharan Africa in preventing Overweight and Obesity among adolescents. These interventions should be of longer duration.
Acknowledgments
The authors thank the students and parents/guardians for their willingness to participate in the study. The support and collaboration among the head teachers and teachers, of Kimumu, Kapsoya, Umoja and Wareng secondary schools are also highly appreciated. The authors also thank University of Kabianga for the research project grant that funded the research part of the study. The support and effort by the data analyst, Maxwell Omondi is highly appreciated.
Conflicts of Interest
The Author(s) Declare(s) that there is no conflict of interest.
References
- Alamian A., ParadisG. Correlates of multiple chronic disease behavioral risk factors in Canadian children and adolescents. American Journal of Epidemiology.2009 ;( 170)1279-1289.
- World Health Organization. Global health risks: mortality and burden of disease attributable to selected major risks. 2009, Geneva, Switzerland.
- International Obesity Task Force. Global trends in Childhood Overweight , 2011. www.iaso.org/sitemedia/uploads/Global_Childhood_Overweight_March_2016
- Marie Ng, Fleming T., Robinson M., Thomson B., Graetz N., Margono C., Mullany E.C. Global, regional, and national prevalence of overweight and obesity in children and adults during 1980-2013: a systematic analysis for the Global Burden of Disease Study 2013.Lancet. 2014;384(9945), 766-781.
- World Health Organization . 2018 Global Nutrition Report.
- Government of Kenya. Kenya Health and Demographic Survey, 2008-2009. Government Printer, Nairobi,2010; 143.
- United Nations Development Plan . Good health and well-being. United Nations Official Document. 2016. Un.org. Retrieved 11 October, 2016.
- Republic of Kenya. Kenya vision 2030: a globally competitive and prosperous Kenya,2007.
- Adamo K. B., Sheel A. W., Onywera V., Waudo J., BoitM. & Tremblay, M. S. Child obesity and fitness levels among Kenyan and Canadian children from urban and rural environments: A KIDS-CAN Research Alliance Study. International Journal of Pediatric Obesity. 2011(6), e225–e232.
- Ojiambo R.M., Easton C., Casajus J.A., Konstabel K., Reilly J.J., Pitsiladis Y. Effect of urbanization on objectively measured physical activity levels, sedentary time, and indices of adiposity in Kenyan adolescents. Journal of Physical Activity and Health. 2012(9): 115-123.
- Brown T., Summerbell C. Systematic review of school-based interventions that focus on changing dietary intake and physical activity levels to prevent childhood obesity: an update to the obesity guidance produced by the National Institute for Health and Clinical Excellence; Obesity Reviews.2009(10): 110–141.
- World Health Organization. Overweight and obesity, Obesity and Overweight. 2014;
- Muthuri S. K., Wachira L. J., Onywera V. O., Tremblay M. S. Correlates of Objectively Measured Overweight/Obesity and Physical Activity in Kenyan school children:result from Iscole -Kenya. BMC Public Health. 2014;14 (436):436 -447.
- Mbithe D. D., Kimiywe J. O., Waudo J. N.,Orodho J. A. Promotion of nutrition education interventions in rural and urban primary schools in Machakos District, Kenya. Journal of Applied Biosciences. 2008;(6):130-139. ISSN 1997-590.
- Triches R.M., Giugliani E.R.J. Obesity, eating habits and nutritional knowledge among school children; Rev Saude Publica. 2015;39(4):541–7.
- Wojtyła-Buciora, P., Stawińska-Witoszyńska, B., Klimberg, A.,Wojtyła, A., Goździewska, M., Wojtyła, K., Piątek, J., Wojtyła, C., Sygit, M., Ignyś, I., Marcinkowski, J,T. et al. Nutrition-related health behaviours and prevalence of overweight and obesity among Polish children and adolescents. Ann Agric Environ Med. 2013;20(2):332-40.
- Zahra M., Aazam H., Neyrizi I., Sharifikia K., Abbasi M.. The Study of Knowledge, Attitude and Nutritional Practice of secondary School Students in Darab City, Fars province, Iran. International Journal of school Health.2015;2(2):e25702.
- Onyiriuka A. N., Umoru D. D., Ibeawuchi A. N. Weight Status and Eating Habits of Adolescent Nigerian Urban Secondary School Girls. South African Journal of Child Health. 2013;7 (3):108 -112.
- Okeyo, D.O., Gumo, S., Munde, E.O. et al.Nutritional service needs of pregnant and lactating adolescent girls in Trans-Mara East Sub-County, Narok County: focus on access and utilization of nutritional advice and services. BMC 2019: 19, 229
- Ministry of Health. Kenya National Strategy for the Prevention and Control of Non-Communicable Diseases; 2015-2020, pp 38-39; Division of Non-communicable diseases
- Okoth M.A., Ochola S., Onywera V., Steyn N.P. Determinants of overweight and obesity in Kenyan adolescents in public and private schools; African Journal of Physical Health, Education, Recreation and Dance. 2015; (21):261-272.
- World Health Organization. Obesity and Overweight (2018)
- Singh A.S., Mulder C., Twisk J.W., Van Mechelen W., Chinapaw M.J. Tracking of childhood overweight into adulthood: a systematic review of literature. Obesity Review 2008 Sep; 9(5):474-88.doi:10.1111/j.1467-789x.2008.00475.x
- Healthy Active Kids Kenya. Kenya’s 2016 Report Card on the Physical Activity and Body Weight of Children and Youth. Nairobi.
- World Health Organization.WHO STEPwise approach to surveillance (STEPS). Geneva, 2008, Switzerland,2008
- World Health Organization.BMI-for-age (BMIFA), Boys and Girls (5-19) years from Nutrition. Retrieved May 4, 2016.
- World Health Organization. Obesity: preventing and managing the global epidemic. Geneva: World Health Organization; 2000. p. 256.
- Hallal P.C., Anderson L.B., Bull F.C., Guthhold R.,Haskell W., Ekelund U. Global physical activity levels: Surveillance Progress, Pitfalls, and Prospects. Lancet. 2012; 380(9838)247-257. 10.1016/S0140-6736(12)60646-1.
- Hayes M., Baxter H., Müller‐Nordhorn , Hohls K., R. Muckelbauer R. The longitudinal association between weight change and health-related quality of life in adults and children: a systematic review. Obesity reviews 2017 doi: 10.1111/obr.12595
- World Health Organization . Physical Activity. 2018, Geneva.
- Wang D., Donald S., Chun C., Yuhui S. Effect of a school based nutrition education program on adolescents’ nutrition-related knowledge, attitudes and behavior in rural areas of China. Environmental Health and Preventive Medicine.2015; 20(4): 271-278.
- Flynn M.A., McNeil D.A., Maloff B., Mutasingwa D., Wu M., Ford C., et al. Reducing obesity and related chronic disease risk in children and youth: a synthesis of evidence with ‘best practice’ recommendations. Obesity Reviews. 2006; 7 Suppl 1: 7–66.
- Pigeot I., Barba G., Chadjigeorgiou C., de Henauw S., Kourides Y., Lissner L., et al. Prevalence and determinants of childhood overweight and obesity in European countries: Pooled analysis of the existing surveys within the IDEFICS Consortium. International journal of obesity.2009; 33(10): 1103–1110. Pmid: 19636314.
- Szabo-Reed A., Washburn R., Greene J., Ptomey L., Gorczyca A., Lee R, Little T., Lee J., Honas J., Donnelly J. Physical activity across the curriculum (PAAC3): Testing the application of technology delivered classroom physical activity breaks by Contemporary Clinical Trials. 2020. http://dx.doi.org/10.1016/j.cct.2020.105952
- Roberta R.F., Ilaine S.,Maria R.W. Effect if interventions on the body mass index of school age students 2012-meta analysis. Rev saude publica.2012;46(3).
- Singhal N., Misra A., Shah P., Gulati S. Effects of controlled school-based multi-component model of nutrition and lifestyle interventions on behavior modification, anthropometry and metabolic risk profile of urban Asian Indian adolescents in North India. European Journal Clinical Nutrition.2010; 64(4):364-73. doi:10.1038/ejcn.2009.150
- Peralta L.R., Jones R.A., Okely A.D. Promoting healthy lifestyles among adolescent boys: The Fitness Improvement and Lifestyle Awareness Program RCT. Preventive Medicine.. 2009; 48(6):537-42. doi:10.1016/j.ypmed.2009.04.007
- Johnston C.A., Tyler C., McFarlin B.K., Poston W.SC., Haddock C.K., Reeves R.S., et al. Effects of a school-based weight maintenance program for Mexican American children: results at 2 years. Obesity(Silver Spring). 2010;18(3):542-7.doi:10.1038/oby.2009.241
- Robinson T.N. Reducing children’s television viewing to prevent obesity: a randomized controlled trial. JAMA. 1999;282(16):1561-7.doi:10.1001/jama.282.16.1561
- Donnelly J.E., Greene J.L., Gibson C.A., Smith B.K., Washburn R.A., Sullivan D.K., et al. Physical Activity Across the Curriculum (PAAC): a randomized controlled trial to promote physical activity and diminish overweight and obesity in elementary school children. Preventive Medicine. 2009;49(4):336-41.doi:10.1016/j.ypmed.2009.07.022
- Muckelbauer R., Libuda L., Clausen K., Reinehr T., Kersting M.A. Simple dietary Intervention in the school setting decreased incidence of overweight in children. Obesity Facts. 2009;2(5):282-5. doi: 10.1159/000229783
- James J., Thomas P., Cavan D., Kerr D. Preventing childhood obesity by reducing consumption of carbonated drinks: cluster randomized controlled trial. British Medical Journal. 2004; 328(7450):1237. doi:10.1136/bmj.38077.458438.EE
- Harris K.C., Kuramoto K., Schulzer M., Retallack J.E. Effect of school-based physical activity interventions on body mass index in children: A meta-analysis. CMAJ.2009;180 (7):719-726.
- Gonzalez-Suarez C., Worley A., Grimmer-Somers K., Dones V. School –based interventions on Childhood Obesity: a meta-analysis. American Journal of Preventive Medicine.2009; 37(5): 418-427.

This work is licensed under a Creative Commons Attribution 4.0 International License.


