Assessment of Portion Sizes of Food Items Commonly Consumed by Urban Indian Adults: A Preliminary Study
Vidisha Sharma*
Department of Food and Nutrition, Lady Irwin College, University of Delhi, New Delhi, India.
Corresponding Author Email: vidisha0893@gmail.com
DOI : http://dx.doi.org/10.12944/CRNFSJ.8.1.17
Download this article as:
![]()
Estimation of food portion sizes is crucial for accurate and comprehensive assessment of dietary intake and nutrition counselling. The present study aimed to assess food portion sizes of adults residing in urban Delhi. A sample of 60 adults (25-60 years, male=female=30) belonging to families with earning members (male/female) engaged in government/private service within the monthly income range of Rs.40,000 to Rs.1,80,000 was selected purposively. Twenty four hour diet recall was conducted for two non-consecutive days for each participant. Data on commonly consumed food items were extracted from recalls and a list of 23 frequently eaten food items was finalized. Standardization of cooking methods and recipes was done for all the selected food items and estimated portion sizes were converted to weight equivalents. The mean, 25th, 50th (median) and 75th percentiles for food portions of the selected items were calculated for the participants. Food portion sizes were compared between male and female participants to identify gender differences. Tea, chapati, milk (as beverage), boiled rice and biscuits were the top five most frequently consumed food items, having the median portion sizes of 170 ml, 2 (in units), 306ml, 140g and 2 (in units), respectively. Male participants consumed significantly larger portion sizes than females for 12 food items (p<0.05). The methodology of this study can be utilized to prepare food portion size database for various population groups which can be used to develop more precise tools for diet assessment that are more suited to Indian population.
KEYWORDS:Diet Assessment; Dietary Intake; Food Portion Size; Portion Size Estimation; Urban Indian Adults
Introduction
Accurate assessment of dietary intake is crucial in nutrition and epidemiological research; to plan and monitor nutrition strategies as well as their evaluation. The accuracy of data generated from food consumption surveys is dependent on the accuracy of assessment of food portion sizes consumed by individuals as food group and nutrient intake is derived from these.1 Hence, estimation of food portion sizes is one of the most important steps while collecting dietary intake data.2–9 Food portion size is defined as the quantity of a food served or consumed per eating occasion including the successive helpings and minus the leftovers.10,11 It is not a consistent amount and varies among individuals.12 The utility of information on food portion sizes is not limited to collection of dietary data but it extends to dietary counselling and portion size education.13–20 The prevalence of overweight, obesity and diet related non-communicable diseases is increasing in India.21–23 The effect of consuming larger portion sizes on high energy intake and high body mass index has been reported in many studies.24–27 However, in India most of the researches focus only on daily total food group and nutrient intake and limited data is available on food portion sizes. Also, lack of any national database on food portion sizes makes interpretation of dietary data difficult. Hence, this study was undertaken to: identify the food items commonly consumed by adults residing in urban Delhi; standardize their methods of preparations and to prepare a list of their portion sizes using percentile approach and evaluate gender differences between the food portion sizes consumed.
Materials and Methods
Study Design
A cross-sectional study was undertaken using a combination of qualitative and quantitative methods. The research was reviewed and cleared by Institutional Ethics Committee, Lady Irwin College, University of Delhi, New Delhi, India (Registration no. ECR/212/INDT/DL/2014).
Sample selection
Free living adults (n=60, male=female=30, 25-60 years) residing in urban Delhi and belonging to families with earning members (male/female) engaged in government/private service within the monthly income range of Rs.40,000 to Rs.1,80,000 were selected from residential colonies and government offices using purposive sampling. Persons who were diagnosed with some health condition because of which they were on special diet (diet that is modified from the one habitually consumed by the participant because of a specific health condition such as overweight, diabetes, high blood pressure, heart disease etc.), were not included in the study. Informed written consent was taken from all the study participants.
Tools and Techniques
General profile
Information on family type, income, education and occupation of the participants was elicited using a questionnaire.
Diet recalls
Information regarding the commonly consumed food items and preparations and their portion sizes was gathered using 24-hour diet recall during January-March, 2018. The diet recalls were conducted face –to- face on two non-consecutive week days (working and non-working day) and care was taken to not include fasting and festival days. Diet recalls were conducted as per the methodology suggested by Gibson, 2005; Gibson and Ferguson, 2008; Baranowski, 2012.3, 4, 28
Estimation of Food Portion size
Various portion size estimation tools were used for facilitating accurate assessment of food quantity consumed by the study participants (figure-1). A thorough review on effectiveness of food portion size estimation aids was done before finalizing the estimation tools.29 All the tools were standardized and pretesting was done on a subsample before data collection to ensure that the participants were able to recall quantities of various food items consumed by them using these tools. Recipe interviews were conducted with thirty participants (29 females and one male who were engaged in food preparation on regular basis) to gather detailed information about the various food preparations; their detailed recipes and the amounts of different ingredients included.
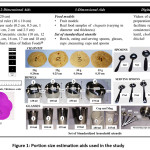 |
Figure 1: Portion size estimation aids used in the study Click here to View figure |
Selection of Food Items
Most frequently consumed food items were selected on the basis of frequency of consumption estimated from the total number of eating occasions derived from two days of 24 hour diet recall per participant, i.e., the number of times any specific item/dish/beverage appeared in 120 diet recalls of the sixty participants.
Standardization of Recipes of Food Preparations
Standardization of recipes of selected food items was done on the basis of information obtained regarding method of preparation, ingredients used, consistency and brand related details (of items purchased from outside) from 24 hour diet recalls and recipe interviews (figure-2). As most of the cooked food items were prepared at home, cooking methods commonly practised by the participants were followed. In case of food preparations for which recipe data were not available, the most similar recipe was used. Survey of utensils commonly used for serving food items was also conducted for standardization of food portion sizes.
Conversion of Estimated Portion Sizes to Weight Equivalents
The quantities of raw ingredients (except spices, condiments and seasonings) reported by the participants in household measure were converted to grams or millilitres, weighed on the digital food scale (Diet and Kitchen Scale, SECA Culina 852) which had precision of 1gram and capacity of 3,000 grams. The dish was then cooked and weight of the final yield was taken at room temperature. The portion sizes were then converted into weight equivalents by weighing the quantity reported by the participants in household measures in respective bowls or serving spoons. Portion size was set in the unit of grams. In case of liquids, it was set in the unit of millilitres and was determined using measuring cup or cylinder. In case of fruits and vegetables having peels, skin or seeds, weight of edible portion was considered.
Determination of Food Portion Sizes
Food Portion sizes of various food items were calculated on the basis of weights estimated from 24 hour diet recalls. After conversion to weight equivalents (grams or millilitres), 50th percentile (median), 25th percentile, 75th percentile, mean and range of food portion sizes were derived. This approach of determining portion sizes has been reported by several researches.10,31–37 The calculation of median portion sizes is preferred as it removes outliers i.e., very small or very larger portion sizes. If any food item (for e.g. chapati, boiled rice or tea) was consumed more than once on the same day then the median portion size as well as 25th and 75th percentiles were calculated taking into account all eating events i.e. all eating occasions of that food item for all participants. However, the number of non-consumers of that food item were excluded from the portion size computation. The food portion sizes of frequently consumed food items were computed for the entire group and were also computed for each gender separately.
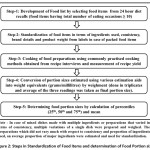 |
Figure 2: Steps in Standardization of Food items and determination of Food Portion sizes Click here to View figure |
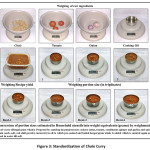 |
Figure 3: Standardization of Chole Curry Click here to View figure |
Data Entry and Analysis
All data were entered into Microsoft Excel 2010 and analysis was done using SPSS version 23. Median food portion sizes (50th percentile) along with 25th and 75th percentiles and mean of portion sizes of all food items were calculated. Comparison between distribution of food portion sizes of male and female participants was done using Independent samples Mann – Whitney U Test. All results were tested at 5% level of significance.
Results and Discussion
General Profile and characteristics of participants
A total of 60 participants (male=female=30) in the age range of 25-60 years were part of this study. The mean age of participants was 42.78 ± 9.33 years (range: 25-56 years), with mean age of men and women being 42.70 ± 9.81 years (range: 26-56 years) and 42.86 ± 8.99 years (range: 25-53 years), respectively. A high proportion of the participants were graduates or had studied up to high school (80%), belonged to nuclear families (65%) and were engaged in government/private service (63.3%). The mean monthly family income of the group was Rs 1,00,083.33 ± 50,836.15 (range: Rs 50,000 – Rs 4,00,000) (table-1).
Table 1: General profile and Characteristics of participants (n=60)
| Characteristics | Categories | No. of participants (%) |
| Age (years) | 25-29 years | 9 (15) |
| 30-34 years | 5 (8.3) | |
| 35-39 years | 5 (8.3) | |
| 40-44 years | 11 (18.3) | |
| 45-49 years | 11 (18.3) | |
| 50-54 years | 14 (23.3) | |
| 55-60 years | 5 (8.3) | |
| Gender | Male | 30 (50) |
| Female | 30 (50) | |
| Educational Qualification | High school | 13 (21.7) |
| Graduation | 35 (58.3) | |
| Post-graduation | 10 (16.7) | |
| Professional | 2 (3.3) | |
| Occupation | Home makers | 19 (31.7) |
| Government service (permanent) | 29 (48.3) | |
| Government service (contractual) | 6 (10) | |
| Private service | 3 (5) | |
| Self-employed | 1 (1.7) | |
| Unemployed | 2 (3.3) | |
| Family Type | Nuclear | 39 (65) |
| Joint | 21 (35) | |
| Monthly Family Income range (Rs) | 45,000-54,999 | 3 (5) |
| 55,000-64,999 | 6 (10) | |
| 65,000-74,999 | 3 (5) | |
| 75,000-84,999 | 18 (30) | |
| 85,000-94,999 | 1 (1.7) | |
| 95,000-1,00,000 | 10 (16.7) | |
| >1,00,000 | 19 (31.7) | |
| Dietary habit | Vegetarian | 28 (46.7) |
| Non-vegetarian | 30 (50) | |
| Ovo-vegetarian | 2 (3.3) | |
| Frequency of Consumption of Meals from outside | Daily | 1 (1.7) |
| 2-3 times/week | 9 (15) | |
| Once a week | 12 (20) | |
| Once in 15 days | 15 (25) | |
| Once a month | 17 (28.3) | |
| Rarely | 6 (10) |
Diet and Meal Pattern
Most of the meals were prepared at home except mid-morning and tea time in case of employees. The total number of meals in a day comprised three main meals (breakfast, lunch and dinner) and five in between meals (early morning, mid-morning, tea time, before dinner and bed time). More than one-third of the participants consumed six meals in a weekday (38.3%, mean: 5.83 ± 1.12 meals, range: 4-8 meals) as well as weekend day (35%, Mean: 5.66 ± 1.15 meals, range: 3-8 meals). Mid-morning, breakfast, lunch, tea-time and dinner were the meals consumed by majority of the participants. The main meals (breakfast, lunch and dinner) usually comprised a cereal, vegetable and/or pulse preparation along with some accompaniment such as curd, salad or pickle. The in between meals usually included a beverage along with a snack or sometimes a fruit or soup.
Commonly Consumed Food Items
Food items were ranked on the basis of the total number of eating occasions derived from 24 hour diet recalls conducted on two non-consecutive days for each participant (table-2 and 3). The Food items (n=23) which had sufficient number of observations overall and for both the genders were selected. The description of certain locally consumed food items is given in box-1. Among cereal preparations, chapati and plain boiled rice were most frequently consumed and were part of almost all main meals especially lunch and dinner. These cereal preparations were regularly eaten in combination with any pulse and/or vegetable preparation. Mix vegetable dry (carrot, potato and pea) and mix pulse curry (red gram dehusked and bengal gram dals) preparations were the most commonly consumed. Plain paratha was eaten most often in breakfast along with tea or some vegetable preparation. Accompaniments such as salad or curd were also an important part of lunch and dinner. Carrot and radish were most frequently consumed in combination as mix salad. Other raw vegetables eaten as salad were cucumber, onion and tomato. Biscuits (especially local bakery, marie and glucose biscuits) or namkeen (such as potato bhujia and mixture namkeen) along with some beverage, usually tea, green tea or coffee were frequently consumed early morning or in between main meals. Milk as a beverage was mostly consumed at bed time or with breakfast. Nuts, mainly almonds, were generally eaten early morning or with breakfast.
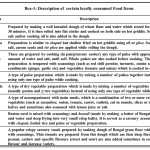 |
Box 1: Description of certain locally consumed Food Items Click here to View Box |
Food Portion Sizes
The portion sizes of commonly consumed food items derived from 24 hour diet recall data have been classified into nine food categories which are listed in table nos. 2 and 3. The portion size was calculated for the cooked weight of food preparation except in case of mix salad, curd, boondi raita, apple, almonds and jaggery. In cereals, the portion size of chapati was two in number and 70g in terms of amount of wheat flour. The most commonly consumed size of chapati was prepared from 30g of wheat flour with a diameter of 15.5 cm and thickness of 0.30 cm. The median portion sizes of boiled rice and plain paratha were 140g and 60g, respectively. Median portion sizes of pulse preparations were higher than that of vegetable preparations. In case of pulse preparations, the portion size ranged from 188g (chole curry) to 255g (mix pulse) while for vegetable preparations (dry) it ranged from 154g (fenugreek leaves and potato dry) to 220g (cauliflower potato dry). The highest median portion size was recorded for milk (306ml) in the beverage category while tea, green tea and coffee had an equal median portion size of 170ml each. Apple was the most frequently consumed fruit with a median portion size of 150g. The consumption of biscuits was more frequent than namkeen as a snack between meals with median portion size of 12.8g (2 in number) for biscuits and 20g for namkeen.
Table 2: Mean and Median portion sizes of Food items commonly consumed in main meals (n=60)
| Sn | Food Items | No. of eating occasions b | Food Portion sizes (g) | Median portion size in HHMs | |
| Mean ± SD | Median (P50) Portion size (P25, P75) | ||||
| Cereal preparations (g) | |||||
| 1. | Chapati(grams of wheat flour) | 196 | 77.75±39.64 | 70 (60,90) | – |
| Chapati (in number) | 196 | 2.63±1.23 | – | 2 (2,3) | |
| 2. | Boiled rice, plain a | 58 | 178.89±91.32 | 140 (110,205) | Bowl-2 |
| 3. | Plain paratha (grams of wheat flour) | 19 | 81.84±57.35 | 60 (35,90) | – |
| Plain paratha (in number) | 19 | 2.05±1.07 | – | 2 (1,3) | |
| Pulse preparations (g) a | |||||
| 4. | Mix pulse c | 27 | 275.07±106.74 | 255 (234,352) | Bowl-2 |
| 5. | Red gram dal c | 15 | 291.33±136.64 | 242 (212,341) | Bowl-2 |
| 6. | Chole curry d | 13 | 263.46±154.09 | 188 (184,356) | Bowl-1 |
| 7. | Red lentil c | 12 | 264.16±158.75 | 196 (150.25,347) | Bowl-1 |
| 8. | Rajmah curry d | 10 | 299.90±151.37 | 236 (228.5,343) | Bowl-2 |
| Vegetable preparations (g) a | |||||
| 9. | Mix vegetable dry | 21 | 157.42±59.59 | 156 (105,191) | Bowl-1 |
| 10. | Cauliflower Potato dry | 19 | 189±78.02 | 220 (105,220) | Bowl-2 |
| 11. | Fenugreek leaves potato dry | 14 | 160.07±53.48 | 154 (96,203) | Bowl-1 |
| Accompaniments (g) | |||||
| 12. | Curd | 19 | 176.8±89.07 | 142 (142,208) | 3/4th Bowl-1 |
| 13. | Mix salad | 18 | 39.11±21.05 | 29.5 (24,55.5) | – |
| 14. | Boondi Raita | 13 | 153.23±29.81 | 169 (126,169) | Bowl-1 |
g: grams, SD: Standard deviation, HHMs: Household Measures, P25: 25th percentile,
P50: 50th percentile, P75: 75th percentile
Capacities of household utensils (0.5ml below brim): Bowl-1: 200ml, Bowl-2: 250 ml
aPortion size of cooked food item
btotal number of times the food item appeared in 120 diet recalls of the sixty participants
Most commonly consumed pulse preparations were of medium consistency (raw pulse, g/water, ml): c 30/117 = 0.256 and d 30/155=0.193
Table 3: Mean and Median portion sizes of Food items commonly consumed in between main meals (n=60)
| Sn | Food Items | No. of eating occasions b | Food Portion sizes (g/ ml a ) | Median portion size in HHMs | |
| Mean ± SD | Median (P50) Portion size (P25, P75) | ||||
| Fruits (g) | |||||
| 1. | Apple | 19 | 149±17.43 | 153 (153,153) | – |
| Beverages (ml) | |||||
| 2. | Tea | 213 | 192.05±55.91 | 170 (170,170) | Cup-1 |
| 3. | Milk | 75 | 283.61±83.17 | 306 (194,344) | Glass-1 |
| 4. | Green Tea | 28 | 176.28±23.07 | 170 (170,170) | Cup-1 |
| 5. | Coffee | 11 | 198.18±62.28 | 170 (170,258) | Cup-1 |
| Snacks (g) | |||||
| 6. | Biscuit (by weight in grams) | 52 | 14.57±9.53 | 12.8 (8.8,17.2) | – |
| Biscuits (in number) | 52 | 2.59±1.34 | – | 2 (2,3) | |
| 7. | Namkeen | 19 | 20.31±11.05 | 20 (10,28) | – |
| Nuts (g) | |||||
| 8. | Almonds | 12 | 5.08±0.99 | 5 (5,5) | – |
| Sugars (g) | |||||
| 9. | Jaggery | 15 | 41.4±6.89 | 42 (34,47) | – |
g: grams, ml: millilitres, SD: Standard deviation, HHMs: Household Measures, P25: 25th percentile,
P50: 50th percentile, P75: 75th percentile
Capacities of household utensils (0.5ml below brim): Cup-1: 170 ml, Glass-1: 306ml
ain case of beverages, portion sizes are in millilitres
btotal number of times the food item appeared in 120 diet recalls of the sixty participants
Gender Differences in Food Portion Size
Food portion sizes were also estimated separately for both male and female participants (table-4 and 5). Significant difference in median portion sizes was observed in case of seven food preparations; chapati, plain paratha, lentils, cauliflower potato dry, mix salad and jaggery (p<0.05). Median portion sizes for male and female participants were observed to be the same for eight food preparations; biscuits (in number), mix pulse, apple, milk (as beverage), curd, tea, green tea and almonds. However, a higher mean portion size for male participants than females was observed for sixteen food items. Other researches who have analysed gender differences also showed that for most of the food items, portion sizes were larger for adult male participants than females.10,34,38–41 These studies were based on food portion sizes of adults from Australia, Bangladesh, Ireland and Nepal.
Table 4: Gender wise data for Portion sizes of Food items commonly consumed in main meals
| Sn | Food items | Male participants (n=30) | Female participants (n=30) | p value | ||||
| No. of eating occasionsb | Food Portion sizes (g) | No. of eating occasionsb | Food Portion sizes (g) | |||||
| Median, P50 (P25,P75) | Mean ± SD | Median, P50 (P25, P75) | Mean ± SD | |||||
| Cereal preparations(g) | ||||||||
| 1. | Chapati(in number) | 100 | 3(2,4) | 3.15 ±1.41 | 96 | 2(2,2) | 2.08 ±0.66 | .000* |
| Chapati (weight of wheat flour) | 100 | 90(60,105) | 93.35 ±46.10 | 96 | 60(50,70) | 61.51 ±22.12 | .000* | |
| 2. | Boiled rice, plain b | 32 | 140(110,205) | 178.84 ±105.82 | 26 | 205(110,205) | 178.96±71.63 | .361 |
| 3. | Plain paratha(in number) | 12 | 2(2,3.75) | 2.50 ±1.08 | 7 | 1(1,2) | 1.28 ±0.48 | .017* |
| Plain paratha (weight of wheat flour) | 12 | 85(50,175) | 99.16 ±64.41 | 7 | 45(30,80) | 52.14 ±25.14 | .056 | |
| Pulse preparations (g) a | ||||||||
| 4. | Mix pulse | 7 | 255(249,365) | 344 ±167.41 | 20 | 255(203,256) | 250.95±66.17 | .263 |
| 5. | Red gram dal | 8 | 242(199.2,340.2) | 278.50 ±94.50 | 7 | 212(212,341) | 306 ±180.76 | 1.000 |
| 6. | Chole curry | 7 | 350(188,362) | 332.85 ±183.53 | 6 | 188(137,205.2) | 182.50±44.23 | .101 |
| 7. | Red lentil | 6 | 344(226,437.5) | 359.33 ±181.21 | 6 | 169(142,196) | 169 ±29.57 | .015* |
| 8. | Rajmah curry | 4 | 289.5(160.2,599.5) | 349.75 ±239.09 | 6 | 236(228.5,343) | 266.67±60.25 | .762 |
| Vegetable preparations (g) a | ||||||||
| 9. | Cauliflower Potato dry | 8 | 220(220,322) | 243.87 ±75.47 | 11 | 105(105,220) | 149.09 ±53 | .012* |
| 10. | Fenugreek leaves potato dry | 7 | 203(154,203) | 184 ±56.13 | 7 | 154(96,154) | 136.14±41.35 | .128 |
| 11. | Mix vegetable dry | 13 | 156(125.5,196) | 156.69 ±60.43 | 8 | 151(105,187) | 158.62±62.30 | .750 |
| Accompaniments (g) | ||||||||
| 12. | Mix salad | 7 | 55(39,59) | 55 ±21.79 | 11 | 24(24,30) | 29 ±13.40 | .006* |
| 13. | Curd | 6 | 142(127.7,289.8) | 209.08 ±164.58 | 15 | 142(142,208) | 164 ±32.20 | .850 |
| 14. | Boondi Raita | 7 | 126(126,169) | 144.42 ±22.98 | 6 | 169(126,182.2) | 163.50±35.56 | .366 |
g: grams, ml: millilitres, SD: Standard deviation, P25: 25th percentile,
P50: 50th percentile, P75: 75th percentile
*median food portion sizes significantly different at p value <0.05 as per Independent- Samples Mann-Whitney U test
aPortion size of cooked food item
btotal number of times the food item appeared in 120 diet recalls of the sixty participants
Table 5: Gender wise data for Portion sizes of Food items commonly consumed in between main meals
| Sn | Food items | Male participants (n=30) | Female participants (n=30) | p value | ||||
| No. of eating occasionsb | Food Portion sizes (g/mla ) | No. of eating occasionsb | Food Portion sizes (g/mla ) | |||||
| Median, P50 (P25,P75) | Mean ± SD | Median, P50 (P25,P75) | Mean ± SD | |||||
| Fruits (g) | ||||||||
| 1. | Apple | 5 | 153(153,153) | 153 ±0 | 14 | 153(153,153) | 147.57±20.31 | .823 |
| Beverages (ml) | ||||||||
| 2. | Milk | 44 | 306(194,355) | 284.27 ±90.75 | 31 | 306(194,344) | 282.67±72.50 | .620 |
| 3. | Tea | 94 | 170(170,170) | 173.78 ±32.98 | 119 | 170(170,258) | 206.48±65.44 | .016* |
| 4. | Green Tea | 23 | 170(170,170) | 170±0 | 5 | 170(170,258) | 205.20±48.19 | .173 |
| 5. | Coffee | 4 | 170(170,170) | 170±0 | 7 | 172(170,258) | 214.28±75.05 | .315 |
| Snacks (g) | ||||||||
| 6. | Biscuits (in number) | 16 | 2(2,2) | 2.18±0.75 | 36 | 2(2,3) | 2.77±1.51 | .097 |
| Biscuit (by weight in grams) | 16 | 13.4(12.8,17.2) | 17.05±12.81 | 36 | 10.8(8.8,17) | 13.47±7.61 | .154 | |
| 7. | Namkeen | 8 | 24(20,28) | 23.62±5.90 | 11 | 10(10,28) | 17.90±13.43 | .177 |
| Nuts (g) | ||||||||
| 8. | Almonds | 2 | 5(5,5) | 5±0 | 10 | 5(4.7,5) | 5.10±1.10 | 1.000 |
| Sugars (g) | ||||||||
| 9. | Jaggery | 5 | 34(30,42) | 35.60±6.06 | 10 | 47(42,47) | 44.30±5.43 | .019* |
g: grams, ml: millilitres, SD: Standard deviation, P25: 25th percentile,
P50: 50th percentile, P75: 75th percentile
*median food portion sizes significantly different at p value <0.05 as per Independent- Samples Mann-Whitney U test
ain case of beverages, portion sizes are in millilitres
b total number of times the food item appeared in 120 diet recalls of the sixty participants
Diet assessment is an indispensable part of nutrition research especially in the area of nutrition epidemiology and planning of nutrition and health strategies.1,42 Accurate assessment of food portion sizes is crucial while collecting quantitative dietary data.3–5,7–9,42 Information regarding food portion sizes is crucial not only while conducting diet assessment but also during analysis of the dietary information obtained. Any error or inconsistency in food portion size information during collection of dietary data will lead to incorrect estimates of food and nutrient intake.1 Comprehensive assessment of nutritional status, in both hospital and as well as community setting, is incomplete without data on portion size of food items. Knowledge regarding usual quantity of food items consumed by individuals at one time facilitates thorough and precise dietary counselling by dieticians. Assessment of actual food portion sizes and determining target groups’ ‘small’, ‘medium’ and ‘large’ portion size facilitates nutrition counselling by suggesting practically feasible dietary modifications.13–20 Consumption of larger portion sizes has been linked with higher energy intake and higher body mass index.24–27 With the rise of obesity and other diet related non-communicable diseases in India, portion sizes may act as a reference for dietary guidance especially for portion control in weight management, health promotion and disease prevention. Food manufactures and restaurants also need current trends in portion sizes for setting appropriate serving sizes and providing its information on food labels.1,43,44 Further, data on food portion sizes is extremely useful in development of new and improved diet assessment instruments, food frequency questionnaires, food photograph series and atlases and also nutrition databases.1,10,43,45–51
The current study was conducted in an attempt to assess, standardize and determine the food portion sizes of urban adults (25-60 years) residing in Delhi, as there is scanty published information on food portion sizes among Indian population. The mean age of the participants (n=60) was 42.78 ± 9.33 years. Most of them came from nuclear families (65%), were graduates (58.3%) and had average monthly family income of Rs 1,00,000. The data from two day 24 hour diet recalls was utilized to finalize the food list. Based on the information from recipe interviews, portion sizes of frequently consumed food items were standardized and converted to weight equivalents (grams or millilitres). Percentile approach (i.e. calculation of various percentiles specifically 25th, 50th and 75th) was used to determine the portion sizes, which has also been used by a few other researches.10, 31–37 Gender wise analysis was also done and overall a higher portion size for male participants was observed. This finding was similar to other researches which also assessed gender differences in portion size of adults.10,34,38–41 There is lack of national level information on food portion sizes for Indian population as well as published researches that focus on this area. Therefore, Indian data are not accessible with which comparison of the results of the present study can be done. Some studies have been done among various population groups in different countries focussing on standardization of portion sizes.10,34,35,38–41,44,52 These databases have been utilized for preparation of food atlases or software for dietary assessment and counselling. The Indian Cuisine predominantly comprises mixed food preparations with vast regional variations in terms of ingredients, their proportion, consistency and method of preparation. Due to this variation in the types of food items/preparations consumed, it becomes difficult to compare portion sizes of Indian food items with international data or even with data from different regions within the country. The present study is a step towards standardization of portion sizes for a population group using available dietary data. The methodology followed for portion size standardization can be used to determine the food portion sizes of individuals belonging to other regions, communities, age and income groups.
Strengths and Limitations of the study
A major strength of the present study is the use of a combination of quantitative and qualitative methods, i.e. 24 hour diet recall, recipe interviews and utensil surveys, for assessment of food portion sizes which were standardized with the participation of the target group. Also, the portion sizes were estimated using different innovative 2-dimensional, 3-dimensional and digital aids to facilitate accurate recall of the quantities consumed. This study is a preliminary investigation towards development of a food photograph series for portion size estimation in an urban Indian population sub-group. National or state level database on food portion sizes is a prerequisite for development of such a tool. However, data from large scale surveys are mostly presented in terms of food and nutrient intake and information on portion sizes are not reported. As such published data were not available; this study was conducted as a preliminary exercise on a sample of 60 adults as an effort to generate data on food portion sizes using 24 hour diet recall (on two non-consecutive days i.e. 120 recalls) along with detailed recipe interviews and utensil surveys which was a time consuming and tedious exercise with a high respondent burden. As sample size of the study was small, selected mainly from Northern region of India and also as there are vast differences in eating habits and food intake within the country, representativeness of the study sample cannot be assured which can be considered as a limitation of the study.
Conclusion
Data on food portion sizes has a number of applications in different areas of nutrition epidemiology and diet researches. The methodology and results of this study can be used in developing diet assessment tools and nutrition databases, nutrition counselling for suggesting appropriate serving sizes and portion control training for health promotion and disease prevention. Further research is required in this area, among different income groups and in different regions of India.
Acknowledgement
The authors want to thank the participants of the study for giving their valuable time, effort and cooperation and also Lady Irwin College, University of Delhi for providing support for standardization of food items in laboratory.
Funding
The corresponding author is in receipt of a Senior Research Fellowship from University Grants Commission, India.
Conflict of Interest
The authors declare no conflict of interest.
References
- Young L.R., Nestle M.S. Portion sizes in dietary assessment: issues and policy implications. Nutr Rev. 1995;53(6):149-158. http://www.ncbi.nlm.nih.gov/pubmed/7478309. Accessed February 18, 2017.
- Thompson F.E., Kirkpatrick S.I., Subar A.F., et al. The National Cancer Institute’s Dietary Assessment Primer: A Resource for Diet Research. J Acad Nutr Diet. 2015;115(12):1986-1995. doi:10.1016/j.jand.2015.08.016
- Baranowski T. 24-Hour Recall and Diet Record Methods. In: Willett W, ed. Nutritional Epidemiology. 3rd New York: Oxford University Press; 2012:49-69.
- Gibson R.S. Measuring Food Consumption of Individuals. In: Gibson RS, ed. Principles of Nutritional Assessment. 2nd New York: Oxford University Press; 2005:41-64.
- Thompson F.E., Byers T. Dietary assessment resource manual. J Nutr. 1994;124(11 Suppl):2245S-2317S. http://www.ncbi.nlm.nih.gov/pubmed/7965210. Accessed February 18, 2017.
- Dietary Assessment: A Resource Guide to Method Selection and Application in Low Resource Settings. Rome; 2018. http://www.fao.org/3/I9940EN/i9940en.pdf. Accessed December 29, 2018.
- Castell G.S., Serra-Majem L., Ribas-Barba L. What and how much do we eat? 24-hour dietary recall method. Nutr Hosp. 2015;31:46-48. doi:10.3305/nh.2015.31.sup3.8750
- Shim JS., Oh K., Kim H.C. Dietary assessment methods in epidemiologic studies. Epidemiol Health. 2014:e2014009. doi:10.4178/epih/e2014009
- Tucker K.L. Assessment of usual dietary intake in population studies of gene-diet interaction. Nutr Metab Cardiovasc Dis. 2007;17(2):74-81. doi:10.1016/j.numecd.2006.07.010
- Lyons J., Walton J., Flynn A. Development of an online database of typical food portion sizes in Irish population groups. J Nutr Sci. 2013;2:e25. doi:10.1017/jns.2013.14
- Nelson M., Haraldsdóttir J. Food photographs: practical guidelines I. Design and analysis of studies to validate portion size estimates. Public Health Nutr. 1998;1(04):219-230. doi:10.1079/PHN19980038
- S. Department of Health and Human Services and U.S. Department of Agriculture. Dietary Guidelines for Americans 2015-2020. http://health.gov/dietaryguidelines/2015/guidelines/. 2015. Accessed March 3, 2017.
- Macdiarmid J.I., Loe J., Kyle J., McNeill G. “It was an education in portion size”. Experience of eating a healthy diet and barriers to long term dietary change. Appetite. 2013;71:411-419. doi:10.1016/J.APPET.2013.09.012
- Bucher T., Rollo M.E., Smith S.P., et al. Position paper on the need for portion-size education and a standardised unit of measurement. Heal Promot J Aust. 2017;28(3):260-263. doi:10.1071/HE15137
- Young L.R., Nestle M. Expanding portion sizes in the US marketplace: Implications for nutrition counseling. J Am Diet Assoc. 2003;103(2):231-240. doi:10.1053/jada.2003.50027
- Cohen D.A. Food for Thought. Nutr Today. 2018;53(1):13-17. doi:10.1097/NT.0000000000000255
- Young L.R., Nestle M. Variation in Perceptions of a ‘medium’ Food Portion: Implications for Dietary Guidance. J Am Diet Assoc. 1998;98(4):458-459. doi:10.1016/S0002-8223(98)00103-5
- Hogbin M.B., Hess M.A. Public Confusion Over Food Portions and Servings. J Am Diet Assoc. 1999;99(10):1209-1211. doi:10.1016/S0002-8223(99)00297-7
- Benelam B., Wiseman M. Size matters: Developing portion size guidance for consumers. Nutr Bull. 2019;44(1):4-6. doi:10.1111/nbu.12360
- Mian S.I., Brauer P.M. Dietary Education Tools for South Asians with Diabetes. Can J Diet Pract Res. 2009;70(1):28-35. doi:10.3148/70.1.2009.28
- NFHS-4, IIPS, MoHFW. National Family Health Survey (NFHS-4).; 2016. http://rchiips.org/NFHS/factsheet_NFHS-4.shtml.
- India State-Level Disease Burden Initiative Diabetes Collaborators N, Anjana R.M., Mohan V, et al. The increasing burden of diabetes and variations among the states of India: the Global Burden of Disease Study 1990-2016. Lancet Glob Heal. 2018;6(12):e1352-e1362. doi:10.1016/S2214-109X(18)30387-5
- India State-Level Disease Burden Initiative CVD Collaborators D, Jeemon P, Sharma M, et al. The changing patterns of cardiovascular diseases and their risk factors in the states of India: the Global Burden of Disease Study 1990-2016. Lancet Glob Heal. 2018;6(12):e1339-e1351. doi:10.1016/S2214-109X(18)30407-8
- Keenan G.S., Childs L., Rogers P.J, Hetherington MM, Brunstrom JM. The portion size effect: Women demonstrate an awareness of eating more than intended when served larger than normal portions. Appetite. 2018;126:54-60. doi:10.1016/J.APPET.2018.03.009
- Reily N.M., Vartanian L.R. The portion size effect on food intake is robust to contextual size information. Appetite. 2016;105:439-448. doi:10.1016/J.APPET.2016.06.015
- English L., Lasschuijt M., Keller K.L. Mechanisms of the portion size effect. What is known and where do we go from here? Appetite. 2015;88:39-49. doi:10.1016/J.APPET.2014.11.004
- Roe L.S., Kling S.M.R., Rolls B.J. What is eaten when all of the foods at a meal are served in large portions? Appetite. 2016;99:1-9. doi:10.1016/J.APPET.2016.01.001
- Gibson R.S., Ferguson E.L. An Interactive 24-Hour Recall for Assessing the Adequacy of Iron and Zinc Intakes in Developing Countries. Technical. Washington, DC: HarvestPlus; 2008. https://assets.publishing.service.gov.uk/media/57a08bac40f0b64974000cd6/tech08.pdf.
- Sharma V., Chadha R. Effectiveness of food portion size estimation aids for diet assessment: A systematic review. Int J Food Sci Nutr. 2017;2(5):106-112. http://www.foodsciencejournal.com/archives/2017/vol2/issue5/2-5-27. Accessed December 31, 2018.
- Sudha V., Mohan V., Anjana R, Krishnaswamy K. Mohan’s Atlas of Indian Foods. First. Chennai: Dr. Mohan’s Health Care Products Pvt Ltd; 2015.
- Lombard M., Steyn N., Burger H.M., Charlton K, Senekal M. A Food Photograph Series for Identifying Portion Sizes of Culturally Specific Dishes in Rural Areas with High Incidence of Oesophageal Cancer. Nutrients. 2013;5(8):3118-3130. doi:10.3390/nu5083118
- Nelson M., Atkinson M., Darbyshire S. Food Photography I: the perception of food portion size from photographs. Br J Nutr. 1994;72(05):649. doi:10.1079/BJN19940069
- Nelson M., Atkinson M., Darbyshire S. Food photography II: use of food photographs for estimating portion size and the nutrient content of meals. Br J Nutr. 1996;76(1):31-49. http://www.ncbi.nlm.nih.gov/pubmed/8774215. Accessed February 18, 2017.
- Sudo N., Sekiyama M., Maharjan M., Ohtsuka R. Gender differences in dietary intake among adults of Hindu communities in lowland Nepal: assessment of portion sizes and food consumption frequencies. Eur J Clin Nutr. 2006;60(4):469-477. doi:10.1038/sj.ejcn.1602339
- Choi M.K., Hyun W.J., Lee S.Y., Park H.J., Kim S.N., Song K.H. One portion size of foods frequently consumed by Korean adults. Nutr Res Pract. 2010;4(1):82-88. doi:10.4162/nrp.2010.4.1.82
- Naska A., Valanou E., Peppa E., Katsoulis M., Barbouni A., Trichopoulou A. Evaluation of a digital food photography atlas used as portion size measurement aid in dietary surveys in Greece. Public Health Nutr. 2016;19(13):2369-2376. doi:10.1017/S1368980016000227
- Jayawardena R., Herath M.P. Development of a food atlas for Sri Lankan adults. BMC Nutr. 2017;3(1):43. doi:10.1186/s40795-017-0160-4
- Sudo N., Sekiyama M., Watanabe C., Mozammel Haque Bokul A.T.M., Ohtsuka R. Gender differences in food and energy intake among adult villagers in northwestern Bangladesh: a food frequency questionnaire survey. Int J Food Sci Nutr. 2004;55(6):499-509. doi:10.1080/09637480400015844
- O’Brien S., McNulty B., Nugent A.P., Gibney E.R., Livingstone M.B.E. A comparison of gender differences in food portion sizes consumed by Irish adults during 1997 and 1999. Proc Nutr Soc. 2011;70(OCE6):E400. doi:10.1017/S002966511100485X
- Zheng M., Wu J.H.Y., Louie J.C.Y., et al. Typical food portion sizes consumed by Australian adults: results from the 2011–12 Australian National Nutrition and Physical Activity Survey. Sci Rep. 2016;6(1):19596. doi:10.1038/srep19596
- Rangan A.M., Schindeler S., Hector D.J., Gill T.P. Assessment of typical food portion sizes consumed among Australian adults. Nutr Diet. 2009;66(4):227-233. doi:10.1111/j.1747-0080.2009.01375.x
- Willett W. Overview of Nutritional Epidemiology. In: Willett W, ed. Nutritional Epidemiology. 3rd ed. New York: Oxford University Press; 2012:1-16.
- Almiron-Roig E., Navas-Carretero S., Emery P., Martínez J.A. Research into food portion size: methodological aspects and applications. Food Funct. 2018;9(2):715-739. doi:10.1039/c7fo01430a
- Sansui R., Olurin A. Portion and Serving Sizes of Commonly Consumed Foods, in Ibadan, Southwestern Nigeria. African J Biomed Res. 2003;15(3):149-158. https://www.ajol.info/index.php/ajbr/article/view/108934. Accessed December 30, 2018.
- Harris-Fry H., Paudel P., Karn M., et al. Development and validation of a photographic food atlas for portion size assessment in the southern plains of Nepal. Public Health Nutr. 2016;19(14):2495-2507. doi:10.1017/S1368980016000537
- Al Marzooqi H.M., Burke S.J., Al Ghazali M.R., Duffy E., Yousuf M.H.S Al. The development of a food atlas of portion sizes for the United Arab Emirates. J Food Compos Anal. 2015;43:140-148. doi:10.1016/J.JFCA.2015.05.008
- Tueni M., Mounayar A., Birlouez-Aragon I. Development and evaluation of a photographic atlas as a tool for dietary assessment studies in Middle East cultures. Public Health Nutr. 2012;15(06):1023-1028. doi:10.1017/S1368980012000171
- Lazarte C.E., Encinas M.E., Alegre C., Granfeldt Y. Validation of digital photographs, as a tool in 24-h recall, for the improvement of dietary assessment among rural populations in developing countries. Nutr J. 2012;11(1):61. doi:10.1186/1475-2891-11-61
- Thoradeniya T., de Silva A., Arambepola C., Atukorala S., Lanerolle P. Portion size estimation aids for Asian foods. J Hum Nutr Diet. 2012;25(5):497-504. doi:10.1111/j.1365-277X.2012.01245.x
- De Keyzer W., Huybrechts I., De Maeyer M., et al. Food photographs in nutritional surveillance: errors in portion size estimation using drawings of bread and photographs of margarine and beverages consumption. Br J Nutr. 2011;105(07):1073-1083. doi:10.1017/S0007114510004551
- Bouchoucha M., Akrout M., Bellali H., et al. Development and validation of a food photography manual, as a tool for estimation of food portion size in epidemiological dietary surveys in Tunisia. Libyan J Med. 2016;11(1):32676. doi:10.3402/ljm.v11.32676
- Lyons J., Walton J., Flynn A. Food portion sizes and dietary quality in Irish children and adolescents. Public Health Nutr. 2015;18(08):1444-1452. doi:10.1017/S1368980014001979
Reference 38- only abstract could be accessed.
Accepted on: 24/03/2020
Second Review by: Prof. Monica Tarcea Romania
Final Approval by: Prof. Reema F. Tayyem


Web of Science Coverage
Emerging Sources Citation Index (ESCI)
2024 Journal Impact Factor: 1.1
Scopus Journal Metrics
CiteScore 2025: 2.6
CiteScore Details
Sustainable Nutrition: Food Systems, Nutrient Retention, and Public Health Impact
![]()
This journal is a member of, and subscribes to the principles of, the Committee on Publication Ethics (COPE)


