Quantitative Microbiological Risk Assessment of Two Street Foods Sold in a Kenyan Town with Regard to Salmonella Contamination
Samuel Imathiu 
Department of Food Science and Technology Jomo Kenyatta University of Agriculture and Technology P. O. Box 62000-00200 Nairobi, Kenya.
Corresponding Author Email: samuel.imathiu@jkuat.ac.ke
DOI : http://dx.doi.org/10.12944/CRNFSJ.6.1.05
Download this article as:
![]()
Street sold foods have gained popularity in recent times, particularly in developing countries where their sale is often unregulated, hence, has a potential to transmitting pathogenic microorganisms which are of public health concern. A survey of two street foods, kachumbari (a type of a vegetable salad) and mandazi (a type of a wheat-based flour snack) was carried out in a Kenyan town to determine the prevalence and conduct a quantitative microbiological risk assessment to estimate the risks of infection due to consumption of the two products contaminated with Salmonella. A prevalence of 19% (16 out of 86 samples) and 7% (6 out of 86 samples) was observed for kachumbari and mandazi respectively. A risk assessment model composed of three different steps (nodes) comprising finished product (processed ready-to-eat), waiting (storage) period and consumption was used for the microbiological risk assessment. Models built in excel spreadsheets using @Risk software package, version 6 (Palisade USA) was used to obtain the inputs, outputs, and run the Monte Carlo simulations at 5000 iterations. The model estimated that in 95% of the cases, the consumers of kachumbari would be exposed to a maximum dose of 8.30 x 10⁴ Salmonella cells per single serving. On the other hand, in 95% of the cases, consumers of mandazi would be exposed to a maximum dose of 4.0 x 10⁴ Salmonella cells per single serving. The model also predicted that 64.3% and 69% of the population was at risk of developing salmonellosis upon consumption of contaminated kachumbari and mandazi respectively. The results indicate that these two products can contribute to high levels of salmonellosis morbidity. Nevertheless, a significant reduction in the level of ingested Salmonella cells in kachumbari and mandazi could be attained through a reduction of the prevalence of the pathogen contamination at or before the point of sale by the employment of good hygienic practices during their preparation and subsequent handling, in addition to enforcement of food hygiene regulations regarding street foods to ensure microbiologically safe foods are sold to the consumers. In order to improve the accuracy of this risk assessment model, more data, whenever available should be used in such studies.
KEYWORDS:Foodborne diseases; Food hygiene; Food safety; Microbiological risk assessment; Street foods
Introduction
The business of street food selling is an age-old occupation which is common worldwide.1 These foods, which usually do not require further processing before consumption, are widely accepted by many people in developing countries because they are viewed as nutritious, inexpensive, convenient and attractive.2 The World Health Organization (WHO) defines street foods as ‘foods and beverages prepared and/or sold by vendors in streets and other public places for immediate consumption or consumption at a later time without further processing or preparation’.3 Since street foods are considered among the sources that can transmit pathogenic microorganisms that can cause foodborne illnesses worldwide,4 their microbiological quality is of great food safety concern as the consumers are continuously exposed to the risk of contracting these diseases.5 A recent review publication about street foods2 talks about the pros and cons of these products, including the significance of microbiological contamination.
The World Trade Organization (WTO) recommends the use of risk analysis as a great approach towards production and provision of safe foods in an effort to assure good health to human population.6 Risk analysis comprises risk assessment, risk management and risk communication.7 The aim of risk analysis is ‘to provide a global standard for the interpretation of the acceptability of risks associated to foods to which consumers might be exposed’.8 Quantitative microbiological risk assessment (QMRA), which is one of the three components of risk analysis process, is a somewhat new scientific discipline capable of linking information from food production to consumption (farm-to-fork) and information on foodborne diseases to give an approximation of the effect of contaminated food on consumer health.9 This QMRA concept was developed by the Codex Alimentarius Commission (CAC), an executive body of WHO and FAO.8 QMRA highlights risks associated with pathogens along the food chain whose outcome is to give an approximation of the possibility of disease development from a foodborne microbe in a given population. QMRA is a scientifically-based process made up of four concise steps according to CAC10 namely; hazard identification, hazard characterization (dose-response), exposure assessment and risk characterization.
The QMRA concept is progressively gaining a lot interest and attention especially in the developed countries. In fact there currently exist a sizeable number of scientific publications and reports on microbiological risk assessment of various types of foods. Unfortunately, this is not the case with developing countries where research and publication, as well as reporting in this aspect are largely lacking. Most of the microbial food safety research in developing countries seems to focus more on incidence and prevalence of pathogenic microorganisms in foods, with the microbial risk assessment taking a back seat. QMRA, just like HACCP, is an important tool that can be used to increase safety of foods and food products through assessment of their safety as well as predicting the effects of intervention measures in food production processes.11, 12, 13 QMRA can be used to obtain important microbiological information for risk managers to mitigate, prevent or control a microbiological problem.11 QMRA is currently applied in numerous developed countries as a useful instrument to enable realistic resolutions to be made to minimize the effect of disease-causing organisms on human health.15 It is for this reason that the approach should be encouraged for adoption especially in developing countries, particularly in the African context because it has been shown that the number of QMRAs that are performed is low, and the discipline calls for awareness with regard to resource allocation.15 The objective of this investigation was to conduct a QMRA of two common street-vended foods, kachumbari and mandazi sold in one of Kenyan towns with regard to Salmonella contamination.
Materials and Methods
Kachumbari and Mandazi Products Descriptions
Kachumbari is a fresh salad dish that is popular in East Africa. Variations of this product can be found in Kenya, Tanzania, Rwanda, Uganda and Burundi. It is prepared using fresh chopped tomatoes, onions and chili peppers. There is extensive handling of this product during preparation. There is no cooking (heat treatment) step involved in its preparation and consumption.
Mandazi (singular, andazi), also known as the swahili bun is a form of deep fried bread made from wheat. The snack is popular in East Africa as it is convenient to make, can be eaten with almost any food or just as a snack by itself. It is made of wheat, sugar, salt, cooking oil and baking powder.
Determination of Prevalence of Salmonella in Kachumbari and Mandazi
Salmonella prevalence data used in this QMRA is derived from a separate unpublished study which sought to determine the prevalence of Salmonella, Staphylococcus aureus, Listeria monocytogenes and Vibrio cholerae in kachumbari and mandazi in the said town. Data for prevalence of many foodborne pathogens and consequences of the diseases they cause in Kenya is generally not readily available, and is largely lacking in scientific literature. The choice for Salmonella for the investigation of risk assessment in these two products was therefore based on the fact that salmonellosis is one of the principal causes of gastroenteritis traceable to most foods globally. This pathogen is generally estimated to cause the greatest health impact in financial terms and results in loss of Quality Adjusted Life Years (QALYs), a measure of health-related quality of life in developed countries like the USA.16 There have also been sporadic but undocumented media reports in Kenya on salmonellosis incidences, particularly in institutions of higher learning where students are known to buy street foods as convenience foods due to their affordability and busy studies lives meaning that they rarely prepare their own meals. Kachumbari and mandazi are some of the most common street vended foods in Kenya and media reporting seem to attribute them, alongside other foods to sporadic salmonellosis outbreaks in many urban centers. Table 1 shows the prevalence of Salmonella in the two products alongside other pathogens.
Table 1: Prevalence of Samonella, Staphylococcus aureus, Listeria monocytogenes and Vibrio cholerae in kachumbari and mandazi sold in Thika town. Values in parentheses represent prevalence.
| Food type | |||||||
| Kachumbari Mandazi | |||||||
| Microbial test | Total samples | +ve (%) | CFU/grange | CFU/gMean | +ve (%) | CFU/grange | CFU/gMean |
| Salmonella | 86 | 16 (18.6) | – | – | 6(7) | – | – |
| Staph. aureus | 86 | 63 (73) | 0-1.3×10⁷ | 1.1x 10⁷ | 46(53.5) | 0-2.2x 10⁵ | 1.2 x 10⁴ |
| Lis. mono. | 86 | 56(65) | 0- 1.6×10⁷ | 1.3×10⁶ | 11(12.8) | 0-1.2x 10⁵ | 1.1 x 10³ |
| Vib. cholerae | 86 | 0 | 0 | 0 | 0 | 0 | 0 |
+ve = number of positive samples
Exposure Pathways
Three nodes (steps) were considered in the exposure pathway for this study as shown in Figure 1. The pathway was modeled as a series of three unit operations and associated pathogen events that included initial contamination of the finished products (Node 1), growth during the waiting period (storage) before sale (Node 2) and dose-response after consumption (Node 3) (Figure 1).
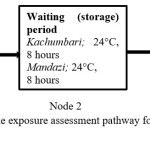 |
Figure 1: Flowchart showing the exposure assessment pathway for Salmonella in kachumbari and mandazi Click here to View figure |
The first node, finished product, starts with the evaluation of the initial prevalence, which is the chance of occurrence and the concentration of the pathogen in the ready-to-eat kachumbari and mandazi (Table 1). Changes were then assessed throughout the remaining nodes as a result of Salmonella growth dynamics. The exposure assessment concludes in an estimation of the probability and level of exposure to the pathogen following the ingestion of a single serving of either kachumbari or mandazi food. The cell addresses, formulas and input settings used in the assessment using the @Risk software are shown in Tables 2a and 2b for kachumbari and mandazi respectively.
Use of @Risk Software Package to Carry out the Risk Assessment
A risk assessment model composed of the three different nodes as highlighted above (finished product (processed ready-to-eat), waiting (storage) period and consumption) was used for the microbiological risk assessment. Models built in excel spreadsheets using @Risk software package, version 6 (Palisade USA) was used to obtain the inputs, outputs, and run the Monte Carlo simulations at 5000 iterations.
Steps in the Exposure Pathway
Node 1: Prevalence Estimate (Initial Contamination)
The proportion of contaminated ready-to-eat kachumbari and mandazi was modeled as a random variable with a discrete distribution; Discrete ({xi},{pi}) (Table 2a and 2b) as this distribution is normally used for modeling activities and phenomena with a small number of outcomes.17 The assumption made here was that the initial concentration of Salmonella in finished product ranged from 1 CFU/g (minimum), 10 CFU/g (median) and 100 CFU/g (maximum).17
Node 2: Waiting (storage) Period-Microbial Growth
Waiting period is that time duration between production and consumption (Figure 1). During this time, the food products are maintained at ambient temperature (approximately 24°C) and this happens throughout until they are purchased and consumed. There is a possibility of Salmonella growth and multiplication during this time depending on both intrinsic and extrinsic properties of the two food categories. After production, the two foods are maintained at conditions shown in Figure 1. ComBase, an online tool for quantitative food microbiology (https://www.combase.cc ) used to study and predict how microorganisms survive and grow under a variety of food-related conditions was used for modeling the level of growth of Salmonella at this step. Zero, 1 and 2 log CFU/g for minimum, median and maximum Salmonella concentration in the product was assumed at this step. A continuous distribution, PERT distribution (PERT(minimum, most likely, maximum)), was used to model the concentration of Salmonella (Table 2a and 2b).17 The PERT distribution was selected as the continuous distribution for extent of Salmonella pathogen event.
Node 3: Consumption (Dose-Response)
The third step modeled consumers’ response upon consumption of Salmonella contaminated products. A PERT distribution was used to simulate illness dose of the consumption event (Table 2a and 2b). The dose-response data for salmonellosis-causing Salmonella in consumers is scarce and the little that is available shows that the degree of virulence is strain dependent, with the least dose causing the disease in healthy individuals ranging from 105 – 1010 for the 13 strains tested.18 However, estimated doses of Salmonella ingested in outbreaks that may have involved less resistant consumers, more virulent strains of Salmonella and/or more permissive meals ranges from 101 to 1011 with a dose of < 103, usually causing illness.19 The input settings for PERT distribution for illness dose were adopted from previous studies.17 where a minimum of 1 log MPN, a median of 3 log MPN, and a maximum of 7 log MPN were used.17
Table 2a: Cell addresses and formulas used in the quantitative risk assessment model for Salmonella in kachumbari using the @Risk software.
| Cell | Variable | Description | Unit | Distribution/value | Reference |
| Node 1 Finished product (Kachumbari) | |||||
| A2 | N | Number of samples | 86 | Own data | |
| A3 | X | Number of positive samples | 16 | Own data | |
| A4 | P | Prevalence of Salmonella in kachumbari | =RiskDiscrete({0\1};{0,814\0,186}) | Calculated | |
| A5 | IC | Initial concentration of Salmonella | Log CFU/g | =RiskPert(0;1;2) | Assumed |
| A6 | IC | Initial concentration of Salmonella with prevalence | Log CFU/g | =IF(A4=0,0,A5) | Calculated |
| Node 2 (Storage) | |||||
| A8 | T | Storage temperature | °C | 26 | Own data |
| A9 | pH | Product pH | 6 | Assumed | |
| A10 | SG | Growth at storage | Log CFU/g | =RiskPert(0,19;1,19;2,19) | ComBase prediction |
| A11 | SC | Concentration of Salmonella during storage | Log CFU/g | =A6+A10 | Calculated |
| A12 | SC | Concentration of Salmonella during storage | CFU/g | =POWER(10;A11) | Calculated |
| Node 3 (Consumption) | |||||
| A14 | Ps | Portion size | g | 250 | Own data |
| A15 | C/S | Concentration of Salmonella in a serving | CFU/serving | =A12*A14 | Calculated |
| A16 | CI | Concentration of Salmonella causing illness | CFU | =POWER(10; RiskPert(1;3;7)) | Oscar, 2004 |
| A17 | R | Risk of illness as a result of consuming Salmonella contaminated kachumbari | =A15/A16 | Calculated | |
Table 2b: Cell addresses and formulas used in the quantitative risk assessment model for Salmonella in mandazi using the @Risk software.
| Cell | Variable | Description | Unit | Distribution/value | Reference |
| Node 1 Finished product (Mandazi) | |||||
| A22 | N | Number of samples | 86 | Own data | |
| A23 | X | Number of positive samples | 6 | Own data | |
| A24 | P | Prevalence of Salmonella in mandazi | =RiskDiscrete({0\1};{0,93\0,0698}) | Calculated | |
| A25 | IC | Initial concentration of Salmonella | Log CFU/g | =RiskPert(0;1;2) | Assumed |
| A26 | IC | Initial concentration Salmonella with prevalence | Log CFU/g | =IF(24=0,0,A25) | Calculated |
| Node 2 (Storage) | |||||
| A28 | T | Storage temperature | °C | 26 | Known data |
| A29 | pH | Product pH | pH | 6 | Assumed |
| A30 | SG | Growth at storage | Log CFU/g | =RiskPert(0,71;1,71;1,71) | ComBase prediction |
| A31 | SC | Concentration of Salmonella at storage | Log CFU/g | =A26+A30 | Calculated |
| A32 | SC | Concentration of Salmonella at storage | CFU/g | =POWER(10;A31) | Calculated |
| Node 3 (Consumption) | |||||
| A34 | Ps | Portion size | g | 200 | Own data |
| A35 | C/S | Concentration of Salmonella in a serving | CFU/serving | =A32*A34 | Calculated |
| A36 | CI | Concentration of Salmonella causing illness | CFU | =POWER(10; RiskPert(1;3;7)) | Calculated |
| A37 | R | Risk of illness as a result of consuming Salmonella contaminated mandazi | =A35/A36 | Calculated | |
Results and Discussion
Table 3 shows the summary of model predictions of the minimum, maximum and mean of Salmonella concentration per servings of kachumbari and mandazi at the time of consumption. It also presents the predicted level of contamination at P50, P75, P90, P95 and P99. The model estimated that in 95% of the cases, the consumers of kachumbari would be exposed to a maximum dose of 8.3 x 10⁴ or less of Salmonella cells per single serving. Only 5% of the servings would contain greater than this number, and less than 5% of the same would contain a level of contamination less than 1.0 x 10³ Salmonella cells per serving. On the other hand, in 95% of the cases, consumers of mandazi would be exposed to a maximum dose of 4.0 x 10⁴ Salmonella cells per single serving (Table 3).
Table 3: Concentration of Salmonella in kachumbari and mandazi per serving at the time of consumption. Values are exposure of the pathogen in CFU/serving.
| Exposure per serving | |||||||||
| Food type | Minimum | Maximum | Mean | Std Dev | P50 | P75 | P90 | P95 | P99 |
| Kachumbari | 4.5×10² | 1.7×10⁶ | 2.0×10⁴ | 6.6×10⁴ | 5.0×10³ | 1.1×10⁴ | 3.3×10⁴ | 8.3×10⁴ | 2.9×10⁵ |
| Mandazi | 1.2×10³ | 6.2×10⁵ | 1.4×10⁴ | 3.9×10⁴ | 7.8×10³ | 9.3×10³ | 1.0×10⁴ | 4.0×10⁴ | 2.1×10⁵ |
The model estimated that only 5% of the servings would contain a level of contamination of greater than this number, while less than 5% of the servings would contain less than 3.7 x 10³ Salmonella cells. On average, exposure by kachumbari is higher than that of mandazi. One of the possible reasons is probably because the prevalence of Salmonella in the former product was higher than in the later product at the start. It is also worth noting that since there is no heat processing step involved in the production of kachumbari, there is no chance of reducing the numbers of the pathogen already present. It is of paramount importance to also note that, in addition for kachumbari being a fresh product, it is also extensively handled by hand during production, an action that has been greatly associated with food contamination by microorganisms.2 On the other hand, although handling is also common for mandazi, the product is deep fried and therefore, the only problem could result from post-heat contamination. The storage conditions for the two products are basically the same, but their intrinsic factors differ significantly (Figure 1). It is widely known that higher water activity encourages multiplication of microorganisms in foods, which is the case with kachumbari, compared to mandazi. Data on the two products is non-existent in the literature and it is therefore difficult to do any comparison with previous work. For any food to be safe for consumption in relation to Salmonella, this pathogen is expected to be absent in every 25 g of food tested.20 which is clearly not the case with these findings.
Figures 2a and 2b show the models estimation of the population’s risk of illness upon consumption of Salmonella-contaminated kachumbari and mandazi.
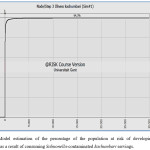 |
Figure 2a: Model estimation of the percentage of the population at risk of developing salmonellosis as a result of consuming Salmonella-contaminated kachumbari servings Click here to View figure |
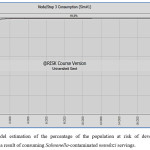 |
Figure 2b: Model estimation of the percentage of the population at risk of developing salmonellosis as a result of consuming Salmonella-contaminated mandazi servings Click here to View figure |
The likelihood of risk of illness per exposure per serving (due to single exposure) was determined by calculating the ratio of exposure to dose-response of Salmonella i.e. risk of illness per serving = Exposure (CFU per serving)/Dose-Response. The value equal to one meant that there would be illness. Figures 2a and 2b, shows the proportion of the population at risk of contracting salmonellosis as a result of consuming contaminated servings of kachumbari and mandazi respectively. For kachumbari (Figure 2a), 64.3% of the population would be at risk of developing salmonellosis, while only 35.7% would be protected from the illness. In case of mandazi (Figure 2b), 69% of the population would be at risk of developing salmonellosis while 31% of the population would be protected. With estimated daily consumers (population) of about 200000, then, approximately 128600 and 138000 would be at risk of developing salmonellosis upon consumption of contaminated kachumbari and mandazi respectively. Although both products seem to be high-risk products based on this result, it seems that mandazi would contribute to more morbidity compared to kachumbari. The reason for this finding is not well understood and thus requires further investigation, particularly by use of larger data sets and taking note of every single detail involved in the entire production line, up to the point where the consumers are served clearly, noting the general hygiene and the personal hygiene of the food handlers.
Conclusion
Quantitative microbiological risk assessment is an important method that helps in approximation of the effect of microbiologically unsafe food on the consumers, even in cases where there is limited data. This method can provide scientifically sound information with regard to the presence and growth of pathogenic microorganisms in foods. This valuable scientifically-sound information derived from such a method can be used by food safety managers and in deed any other individual involved in food safety to draw inferences and make necessary decisions to assure food safety. It has clearly been seen that QMRA due to its ability to quantify microbiological risks presented by foods, can very well supplement the popular HACCP approach which is qualitative in nature. From this study, both kachumbari and mandazi are potentially hazardous food products which is not a surprise given the conditions in which they are produced and/or handled. High exposures lead to a high estimated risk of developing salmonellosis. A significant decrease in the number of ingested Salmonella cells in kachumbari and mandazi could be achieved through a reduction of the prevalence of the pathogen contamination at or before the point of sale by the use of simple hygienic measures during their preparation and subsequent handling. These findings have demonstrated that none of the two foods can be deemed risk-free, they both have potential to cause an illness, and therefore, each and every step, from farm-to-fork needs to be looked at as a potential point of intervention to mitigate Salmonella contamination and the possible development of salmonellosis in consumers. In addition to embracing QMRA to guide in food safety decision making anchored on scientific evidence, it is also important to have policies that reinforce hygiene education of food handlers in the street food subsector to help limit risks associated with Salmonella and other foodborne pathogens.
Acknowledgements
The author wishes to thank the entire training team of the International Training Program in Food Safety, Quality Assurance and Risk Analysis of the Department of Food Safety and Quality at the University of Ghent, Belgium, for the training. There is no conflict of interest to declare.
References
- Mohammad, A. M, Shah M. M. R. and Tanvir, C. T. Knowledge and awareness of children’s food safety among school-based street food vendors in Dhaka, Bangladesh. Foodborne Pathogens and Disease; 10, 323-330: (2013).
CrossRef - Imathiu, I. Street vended foods: Potential for improving food and nutrition security or a risk factor for foodborne diseases in developing countries? Current Research in Nutrition and Food Science; 5, 55-65: (2017).
CrossRef - FAO/WHO. Informal food distribution sector in Africa. In: FAO/WHO Regional Conference on Food Safety for Africa. Harare, Zimbabwe, pp.3-6, October 2005: (2005).
- Estrada-Garcia, T., Lopez-Saucedo, C., Zamarripa-Ayala, B., Thompson, M.R., Gutierrez-Cogco, L., Mancera-Martinez, A., Escobar-Gutierrez, A. Prevalence of Escherichia coli and Salmonella spp. in street-vended food of open markets and general hygienic and trading practices in Mexico City. Epidemiology and Infection; 132, 1181-1184, (2004).
CrossRef - Zeki, G., Sebnem, P., Yeliz, Y. and Nurhan, E. The microbiological quality of ready-to-eat salads in Turkey: A focus on Salmonella spp. and Listeria monocytogenes. International Journal of Food Microbiology; 196, 79-83: (2015).
CrossRef - Hoornstra, E. and Notermans, S., 2001. Quantitative microbiological risk assessment. International Journal of Food Microbiology, 66, 21–29: (2001).
CrossRef - Voyseya, P.A. and Brown, M. Microbiological risk assessment: a new approach to food safety control. International Journal of Food Microbiology; 58, 173–179: (2000).
CrossRef - Klapwijka, P.M. Jouveb, J.L. and Stringer, M.F. Microbiological risk assessment in Europe: the next decade. International Journal of Food Microbiology; 58, 223-230: (2000).
CrossRef - Rocourt, J., BenEmbarek, P., Toyofuku , H. and Schlundt, J. Quantitative risk assessment of Listeria monocytogenes in ready-to-eat foods: the FAO/WHO approach. FEMS Immunology and Medical Microbiology; 35, 263-267: (2003).
CrossRef - CAC, 2006. Food safety risk analysis – a guide for national food safety authorities. FAO Food and Nutrition Paper 87, FAO/WHO, Italy.
- Lammerding, A.M. and Fazil, A. Hazard identification and exposure assessment for microbial food safety risk assessment. International Journal of Food Microbiology; 58, 147-157: (2000).
CrossRef - Black, D.G. and Davidson, P.M. Use of modeling to enhance the microbiological safety of the food system. Comprehensive Reviews in Food Science and Food Safety; 7, 159-167: (2008).
CrossRef - Nauta, M. J. Modelling bacterial growth in quantitative microbiological risk assessment: is it possible? International Journal of Food Microbiology; 73, 297- 304: (2002).
CrossRef - Mataragas, M., Zwietering, M.H., Skandamis, P.N. and Drosinos, E.H. Quantitative microbiological risk assessment as a tool to obtain useful information for risk managers – Specific application to Listeria monocytogenes and ready-to-eat meat products. International Journal of Food Microbiology; 141, 170-179: (2010).
CrossRef - Voyseya, P.A. and Brown, M., 2000. Microbiological risk assessment: a new approach to food safety control. International Journal of Food Microbiology; 58, 173-179: (2000).
CrossRef - Bartz, M.B., Hoffmann, S. and Morris, J.G. Ranking the risks: The 10 pathogen-food combinations with the greatest burden on public health. Emerging pathogens institute, University of Florida: (2011).
- Oscar, T.P. A quantitative risk assessment model for Salmonella and whole chickens. International Journal of Food Microbiology; 93, 231-242: (2004).
CrossRef - Blaser, M.J. and Newman, L.S. A review of human salmonellosis: I. Infective dose. Review of Infectious Diseases; 4, 1096-1106: (1982).
CrossRef - Vought, K.J. and Tatini, S.R. Salmonella enteritidis contamination of ice cream associated with a 1994 multistate outbreak. Journal of Food Protection; 61, 5-10: (1998).
CrossRef - Food Safety Authority of Ireland. Guidelines for the interpretation of results of microbiological testing of ready-to-eat foods placed on the market. Guidance Note No. 3: (2016).
Accepted on: 16-02-2018
Second Review by: Prof. Monica Tarcea (Romania)
Final Approval by: Prof. Rajesh Jeewon


Web of Science Coverage
Emerging Sources Citation Index (ESCI)
2024 Journal Impact Factor: 1.1
Scopus Journal Metrics
CiteScore 2025: 2.6
CiteScore Details
Sustainable Nutrition: Food Systems, Nutrient Retention, and Public Health Impact
![]()
This journal is a member of, and subscribes to the principles of, the Committee on Publication Ethics (COPE)


