Hydroxypropyl methylcellulose and Whey Protein Concentrate as Technological Improver in Formulation of Gluten-free Protein Rich Bread
Shivani Rustagi1
, Saumya Choudhary2, , Mohd. Kamran Khan3, , 1Department of Food Science and Technology, Warner College of Food and Dairy Technology, Sam Higginbottom University of Agriculture, Technology and Sciences, Allahabad, India-211007
2Department of Molecular and Cellular Engineering, Jacob Institute of Biotechnology and Bioengineering, Sam Higginbottom University of Agriculture, Technology and Sciences, Allahabad, India-211007
3Department of Soil Science and Plant Nutrition, Selcuk University, Turkey-401602.
Corresponding Author Email: avinash.singh@shiats.edu.in
DOI : http://dx.doi.org/10.12944/CRNFSJ.6.1.24
Download this article as:
![]()
Wheat breads contains gluten protein that is responsible for the visco-elastic properties of dough. There has recently been an increase in the prevalence of gluten-related disorders including celiac disease and non-celiac gluten sensitivity. Therefore, this study has been designed for improving bread production for gluten-free bread (sorghum and potato starch) using hydroxypropyl methylcellulose (HPMC) and whey protein concentrate (WPC-70) as technological improver and optimizing it using response surface methodology (RSM). RSM was used to investigate the influence of predictor variables (HPMC and WPC-70) on bread quality in terms of crust and crumb texture and color, flavor, porosity and overall acceptability. The HPMC level varies from 2- 3% and WPC-70 from 12-15%. Quadratic models are developed to fit with experimental data. The predictor variables had desirable effect on all the responses. Finally, 3% HPMC and 15 % WPC-70 were chosen as optimum levels. The obtained gluten-free bread can be considered as protein rich. The optimized bread was analyzed for various parameters including protein, moisture, fat, crude fiber content, acid insoluble ash and pH. The analyzed results were reported as 10.48g, 38.73g, 8.97g, 2.8g, 0.134g, 6.1 respectively. The microbiological analysis of optimized bread was performed. The total plate count was10, yeast mould was 10 and coliform count Nil. Hence, it can be stated that HPMC and WPC-70 can be efficiently used to obtain gluten-free protein rich bread.
KEYWORDS:Bread; Gluten-Free; High protein; HPMC; RSM; WPC-70.
Introduction
Bakery goods, especially bread, form a significant part of human diet. Bread baking has reached a new dimension since its inception in Egypt 12,000 years earlier.18, 20 Due to the changing lifestyles and its ease of use, bread has become a popular option and is also an important source for protein and carbohydrate. With per 100g serving bread gives approximately 6.66g of protein. According to National Nutrition Monitoring Board (NNMB), in India over the last 25 years, protein intake (mainly from cereals) is about 1 g/kg/day which are quite low and 80% population is protein deficient. Besides protein deficiency, there has been surge in the population being gluten intolerant. Wheat flour is the primary component of many daily consumed baked foods such as breads, cakes, biscuits, pizzas and pasta. Gluten, a vital structure-binding protein, is the principle wheat part that contributes to bread quality. However, increasing number of people is not able to digest gluten present in the wheat-based cereal products and suffer from diseases like Celiac Disease . It is an autoimmune system disorder influencing the gastrointestinal framework and distinguished by long-lasting intolerance to the intake of gluten, a term used to cover prolamins (specific storage ethanol-soluble proteins) in wheat (gliadin), rye (secalin), and barley (hordein). At present, approximately 1% of the world population is affected from celiac illness.8 thus, increasing the requirement of gluten-free cereals like sorghum and millet.
After wheat, rice, maize and barley, Sorghum (Sorghum bicolor) is globally the fifth most vital cereal.28 Several studies have been done on food products containing sorghum such as breads.17, 26-27, 30 tortilla23, 31 and noodles29 Sorghum is an inexpensive gluten-free cereal containing variety of phenol compounds having antioxidant activity, cholesterol-lowering properties and other health benefits. In comparison to other cereals, the protein and starch in sorghum endosperm are gradually digested which may have positive effect for diabetics.32 Gluten of wheat flour consists of gliadin and glutenin, responsible for dough’s viscosity and elasticity respectively. The gluten-free flour when hydrated with water is not able to make visco-elastic dough. In the absence of gluten, a liquid batter is obtained instead of dough which poses a technological issue for bakers, particularly in bread-making. The poor sensory quality of guten-free breads has impelled scientists to look for ingredients and technologies which will be able to mimic gluten’s unique visco-elastic properties. Hydrocolloids form an important ingredient of gluten-free bread to improve its texture and make it comparable to its wheat counterpart.25 Hydroxypropyl Methyl Cellulose (HPMC), xantham gum, agar-agar and mixture of hydrocolloids can successfully imitate gluten2 or serve other goal like gelation, thickening, emulsification and/or stabilization of air cells. HPMC is also used a bread improver producing bread with improved specific volume, smoother crumb and superior sensory attributes.1, 12, 24 Whey protein contributes to both the functional and the nutritional (enhancing protein content and providing essential amino acids) properties. Supplementation of cereal bread with milk whey protein could contribute to combat protein deficienc t. They are digested without difficulty and offer second largest Protein Efficiency Ratio (PER) after eggs. Whey protein is a complete protein having all the nine essential amino acids i.e. they have High Biological Value (HBV) and includes good amount of branched-chain amino acids (BCAAs). Properties such as antioxidant, antihypertensive, antitumor, hypolipidemic, antiviral, antibacterial, and chelating agent are exhibited by whey protein. According to13 supplementary profits of whey proteins may consist of: surge the serotonin activity and thus support peaceful sleep, decrease body fat and form the lean body mass and it improves recollection power under stress.
Several functional properties such as flavor, texture, color and aeration are provided to a range of food items by whey and whey-derived products.14, 21 In the process of bread manufacturing, whey proteins are essential to augment crust browning, crumb formation and flavor, enhance toasting qualities and delay deterioration. Other characteristics of such breads like kneading properties, size and volume of loaf are also enhanced due to the addition of whey protein. A Celiac patient diet is nutritionally unbalanced which is not much improved by addition of gluten-free products existing in the market as they are usually starch-based and hence are devoid of fiber, vitamins and other nutrients.16
The present work is an extension of previous studies on the improvement of the quality and nutritional significance of gluten-free bread. The objective of the work was to enhance a gluten-free formulation, supplemented with whey protein concentrate and hydrocolloid to evaluate sensory characteristics and overall quality of obtained gluten-free bread and to assess its nutritional and microbiological aspects.
Materials and Methods
Raw Materials and Bread-making
Whole grain sorghum was obtained from the local market of Allahabad. The grains were cleaned manually and then ground in a local mill. The flour was evaluated for its protein15 and gluten3 content. HPMC (Methocel K4M, Food Grade, E 464) was procured from Colorcon Asia Pvt. Ltd. (Goa, India); unmodified potato starch was purchased from Angel Starch & Food Pvt. Ltd. (Peundurai, India) and Whey Protein Concentrate-70 from Mahaan Proteins Ltd. (New Delhi, India). Skim milk powder, table salt (NaCl), sugar (sucrose), calcium carbonate, refined oil, vanilla essence and active dry yeast were purchased locally.
The basic recipe of formulation for the breads was performed according to the method described by.27 Bread making experiments used the following basic formulation: sorghum flour (70%) and potato starch (30%). The sum of the flours was (100%) and inferred as the flour weight basis (fwb). Salt (2.67%), sugar (18%), active dry yeast (4.34%), skim milk powder (1.67%), calcium carbonate (2.67%) and water (variable) were used as ingredients. WPC-70 and HPMC concentration were varied according to the experimental design in Response Surface Methodology (RSM). The range (maximum and minimum) of HPMC and WPC-70 for Experimental Breads was determined by considering previous research, review papers and baking trials. The optimal range kept for HPMC and WPC-70 was 2-3% and 12-15% respectively. The levels of additional ingredients HPMC and WPC-70 were calculated according to the Central Composite Rotatable Design (CCRD) as given in Table 1.
Table 1: Coded and Actual Levels of the Factors HPMC and WPC-70 in the Central Composite Designa
| Coded Levels | Actual Levels (% FWB) | |
| HPMC | WPC-70 | |
| -1.414 | 1.79280 | 11.3787 |
| -1.000 | 2 | 12 |
| 0 | 2.5 | 13.5 |
| +1.000 | 3 | 15 |
| +1.414 | 3.20711 | 15.6213 |
a Design comprised 13 runs in random order; all points in coded factor levels in the order HPMC and WPC-70: the center point (0, 0) was replicated five times, factorial points were not repeated and comprised all combinations of -1 and 1 levels of the factors; star points also were not repeated and consisted all combinations of -1.414 and 1.414 levels of the factors.
The bread was manufactured using Straight Dough Method. The dried yeast was reactivated with 10 min of pre-hydration in lukewarm water and sugar and flour. The other dry ingredients were mixed separately, fragmenting any clusters, and added to the standard mixture. The batter was mixed with 200 W Stand Mixer (Panasonic MK-GB1) with dough hook attachment for 40 sec. at level 3 out of 5 and then scraped. Mixing was continued for additional 3 to 4 min at level 4 out of 5. 400g was weighed into greased baking tins and proofed at 35°C and 85% relative humidity (RH). Proofing to height was done until the batter reached the edge of the tin (typical proof times were ≈90 min). Baking was done in Rotary Rack Oven at 140°C for 30 min and then for 180°C for 15 min. After baking, the loaves were de-panned and cooled for 90 min on cooling racks at room temperature. The loaves were then sliced and packed in polyethylene pouches.
Sensory Evaluation
Sensory evaluation was preformed within 24 hours after baking to evaluate for crust and crumb texture and color, flavor, porosity and overall acceptability of the bread sample. A panel of ten judges of regular bread consumers using the Hedonic scale product was set up. The panel was set up in three sets (to obtain three replicates) and the sensory scores were analyzed statistically.
Experimental Design and Statistical Analysis
Statistical analysis was performed using RSM for the 13 Experimental Breads (Table 2). The software Design Expert Version 10.0.0 was used to analyze the results. For each of the response variables (crust & crumb texture and color, flavor and porosity), the model summaries and lack of fit tests were analyzed for quadratic models. Three-dimensional (3-D) response surface plots were generated for each quality parameter.
Table 2: Experimental Design of gluten-free bread (Coded)
| Run | A: HPMC | B: WPC | Crust Texture | Crumb Texture | Crust Color | Crumb Color | Flavor | Porosity | Overall Acceptability |
| 1 | -1.000 | -1.000 | 7.75 | 6.49 | 6.51 | 6.89 | 7.28 | 7.46 | 7.07 |
| 2 | 0.000 | 0.000 | 6.62 | 7.31 | 7.1 | 7.28 | 7.43 | 7.75 | 7.2 |
| 3 | 0.000 | -1.414 | 7.15 | 6.44 | 6.49 | 6.92 | 7.31 | 7.44 | 6.91 |
| 4 | 0.000 | 0.000 | 7.01 | 7.33 | 6.97 | 7.18 | 7.39 | 7.79 | 7.32 |
| 5 | 1.000 | 1.000 | 8 | 7.7 | 7.45 | 7.34 | 7.79 | 7.83 | 7.48 |
| 6 | 0.000 | 0.000 | 6.99 | 7.21 | 6.85 | 7.2 | 7.39 | 7.71 | 7.17 |
| 7 | 1.000 | -1.000 | 7.85 | 8.01 | 7.51 | 7.4 | 7.71 | 7.84 | 7.37 |
| 8 | 0.000 | 1.414 | 8.25 | 7.71 | 7.69 | 7.37 | 7.83 | 7.85 | 7.45 |
| 9 | 0.000 | 0.000 | 6.87 | 7.23 | 6.7 | 7.19 | 7.38 | 7.6 | 7.29 |
| 10 | -1.414 | 0.000 | 7.19 | 6.31 | 6.5 | 6.73 | 7.31 | 7.51 | 6.95 |
| 11 | 0.000 | 0.000 | 7.05 | 6.87 | 7.01 | 6.99 | 7.18 | 7.7 | 7.25 |
| 12 | -1.000 | 1.000 | 7.25 | 6.82 | 6.75 | 6.92 | 7.5 | 7.59 | 7.03 |
| 13 | 1.414 | 0.000 | 7.87 | 7.62 | 7.41 | 7.3 | 7.73 | 7.82 | 7.4 |
The calculation of optimal factor levels for optimum bread quality was performed using a multiple response method called desirability. In this study, the predictor variables were permitted to be at any level within the range of the design.
Optimization of Formulation
The combinations computed by RSM were prepared and subjected to evaluation for sensory attributes by a panel of judges. The breads were evaluated for crust and crumb texture and color, flavor, porosity and overall acceptability on 9-point hedonic rating scale where 9 represented excellent sample.
On the optimization of the process parameters (HPMC and WPC-70), a final formulation was obtained: sorghum flour (70%), potato starch (30%), salt (2.67%), sugar (18%), active dry yeast (4.34%), skim milk powder (1.67%), calcium carbonate (2.67%), HPMC (3%), WPC-70 (15%) and water (variable). Vanilla essence and refined oil were also added. The optimized gluten-free bread was then baked and was analyzed for its physicochemical and microbiological parameters.
Physico-chemical Methods
Bread moisture,5 Protein,15 Fat,4 Crude Fibre,3 Acid Insoluble Ash,19 and pH22 were determined following the standard methods.
Texture Profile Analysis
Texture Profile Analysis (TPA) was performed on one slice from each loaf using a texture analyzer (TA-XT2i) equipped with a 35-mm cylinder probe along with a 2 kg load cell. Three middle slices of each loaf were evaluated. A 10-mm thick bread slice underwent a double compression test up to 50% deformation of its original height at a crosshead speed of 1 mm/s and a 30-s gap between compressions.
Color Measurement
Crust and Crumb Color of bread samples were measured with a hunter lab colorimeter X RITE. L* represents the lightness with values from 0 (black) to 100 (white). Chromatic components are represented by a* and b* axes. Positive values of a* are red and negative values are green, whereas positive values of b* are yellow and negative values are blue.22
Microbiological Analysis
Total plate count (TPC), yeast & mould count and coliform count were carried out on the bread samples to determine the microbial load of the samples as described by Indian Standards.6,7 Bread samples were prepared by mashing and mixing in peptone water. Sub-samples were diluted decimally and 0.1mL aliquots were spread plated on nutrient agar (NA), Yeast Extract-Dextrose-Chloramphenicol-Agar Medium (YDCA) and Crystal Violet Neutral Red Bile Lactose (VRBL) Agar for the enumeration of Aerobic Viable Bacteria, Yeast & Mould and Coliform respectively.
Results and Discussion
Response Surface Analysis
The application of RSM resulted in the different regression equations which gives the empirical relations between crust texture, crumb texture, crust color, crumb color, flavor, porosity and overall acceptability and the test variables (A- HPMC and B- WPC-70) in coded units. The coefficient of determination (R2) shows the measure of fitting the data. The quadratic models were selected as a suitable mathematical model for all responses. ANOVA showed that models were significant (P<0.05 and P<0.01) for all responses. Non- significant lack-of-fit (P< 0.05) indicate that the models correlated well with the measured data (Table 3).
Crust and Crumb Texture
The ANOVA of second order response surface model fitting for crust and crumb texture is given in Table 3. Values of “Prob > F” less than 0.0500 indicate model terms are significant. The Model F-value of 5.83 and 5.75 for Crust and Crumb Texture implies the model is significant. For Crust Texture, the quadratic terms for A and B were significant. In case of Crumb Texture, A was a significant model term. There was significant linear effect of HPMC and quadratic effect of WPC-70 on Crust Texture as depicted in Fig 1a. With increase in their levels, crust texture improved. Elevation of HPMC and WPC-70 significantly increased Crumb Texture (Fig 1b). The model equations for Crust and Crumb Texture respectively were:
Crust Texture Z1= 6.91+0.23*A+0.15*B+0.16*AB+0.34*A2+0.42*B2
Crumb Texture Z2=7.19+0.53*A+0.23*B-0.16*AB-0.054*A2+1.250E- 003*B2
Crust and Crumb Color
The results showed that the Model F-value for Crust and Crumb Color are 5.62 and 5.76 respectively which implies the model is significant as seen in Table 3. For Crust Color, A and B are significant model terms whereas for Crumb Color A was a significant term. As can be observed in Fig 1c, HPMC had significant increasing effect on Crust Color whereas little effect of WPC-70 was shown on Crust Color. For Crumb Color, HPMC and WPC-70 both had significant increasing effect (Fig 1d). Model Equations for the quality parameters Crust & Crumb Color respectively were:
Crust Color Z3= 6.93+0.37*A+0.23*B-0.075*AB+0.023*A2+0.090*B2
Crumb Color Z4=7.17+0.22*A+0.076*B-0.023*AB-0.062*A2+2.875E-003*B2
Flavor
The ANOVA of second order response surface model fitting for flavor is given in Table 3. The Model F-value of 10.24 implies the model is significant. For flavor, A and B at linear and quadratic levels are significant model terms. As can be seen in the Fig 1e, with the increase in HPMC and WPC-70, there was sharp significant increase in Flavor. The quadratic term of HPMC and WPC-70 had significant increasing effect on Flavor. But the interaction of these two factors did not show much effect on the Flavor score. For quality parameter Flavor, the model equation was:
Flavor Z5= 7.35+0.16*A+0.13*B-0.035*AB+0.089*A2+0.11*B2
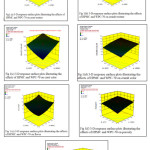 |
Figure 1: Three-dimensional response surface plots illustrating the effects of HPMC and WPC-70 on responses (Crust & Crumb Texture, Crust & Crumb Color, Flavor, Porosity and Overall Acceptability) for GFB Click here to View figure |
Porosity
The ANOVA of second order response surface model fitting for porosity is given in Table 3. The Model F-value of 5.71 implies the model is significant. For porosity, A and B are significant model terms. The significant linear effect of HPMC and WPC-70 on Porosity implies a considerable increase in the porous structure as reflected in the 3-D graph (Fig 1f). The model equation for the quality parameter Porosity was:
Porosity Z6= 7.71+0.13*A+0.087*B-0.035*AB-0.016*A2-0.026*B2
The results showed that the Model F-value for Overall Acceptability is 5.60 which imply the model is significant as seen in Table 3. In this, A and B are significant model terms. With the increase in HPMC and WPC-70, significant effect on the increase on Overall Acceptability of breads was observed as depicted on the surface plot of graph (Fig 1g). For quality parameter Overall Acceptability, the model equation was:
Overall Acceptability Z7= 7.25+0.17*A+0.10*B+0.037*AB-0.020*A2-0.018*B2
For optimization, the independent variables were maximized. Satisfying these conditions at some optimized condition different process parameters, viz. HPMC and WPC-70, crust texture, crumb texture, crust color crumb color, flavor, porosity and overall acceptability were 8.20, 7.74, 7.57, 7.38, 7.81, 7.85 and 7.52 respectively with desirability= 0.945.
Table 3: ANOVA and Regressive Coefficients of second order polynomial models of the various responses
| Parameters | Crust Texture | Crumb Texture | Crust Colour | Crumb Colour | Flavour | Porosity | Regressive Coefficients |
| Intercept | 6.91 | 7.19 | 6.93 | 7.17 | 7.35 | 7.71 | 7.25 |
| Aa | 0.23 | 0.53 | 0.37 | 0.22 | 0.16 | 0.13 | 0.17 |
| Bb | 0.15 | 0.23 | 0.23 | 0.076 | 0.13 | 0.087 | 0.10 |
| AB | 0.16 | -0.16 | -0.075 | -0.023 | -0.035 | -0.035 | 0.037 |
| A2 | 0.34 | -0.054 | 0.023 | -0.062 | 0.089 | -0.016 | -0.020 |
| B2 | -0.018 | ||||||
| ANOVA | 0.8064 | 0.8042 | 0.8006 | 0.8045 | 0.8797 | 0.8031 | |
| R2 | 0.8064 | 0.8042 | 0.8006 | 0.8045 | 0.8797 | 0.8031 | 0.8001 |
| Model F-value | 5.83 | 5.75 | 5.62 | 5.76 | 10.24 | 5.71 | 5.60 |
| Lack of Fit (p value) | 0.0194* | 0.0201* | 0.0213* | 0.0200* | 0.0040* | 0.0205* | 0.0215* |
a Coded HPMC Level; b Coded WPC-70 Level; *Significant at 5% (P<0.05); **Significant at 1% (P<0.01)
Effect of HPMC and WPC-70 on Texture of Gluten-free Bread
During the preparation of Control and Experimental Breads of different treatment levels, it was observed that Control Bread was marked with various textural defects like cracks and grooves whereas Breads with different HPMC and WPC-70 concentrations were devoid of these textural defects (Fig 2a). The cracks in the control bread can be attributed to the absence of HPMC as it is an emulsifying agent. Due to its absence, batter is more prone to separation during proofing. Without HPMC, the Control Bread was not able to hold gases during proofing and thus, showed low rise in the volume as compared to optimized bread (Fig 2b). The effectiveness of HPMC on toast bread volume has been reported by.24 The control and optimized gluten-free bread were subjected to texture analysis (Table I). Significant differences were recorded for hardness of bread slices ranging from 4228.2 g (Optimized Bread) to 5504.89 g (Control Bread). The decrease in the hardness of the optimized bread can be due to addition of HPMC and WPC-70 as both act as textural improver.
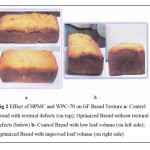 |
Figure 2: Effect of HPMC and WPC-70 on GF Bread Texture a- Control Bread with textural defects (on top); Optimized Bread without textural defects (below) b- Control Bread with low loaf volume (on left side); Optimized Bread with improved loaf volume (on right side) Click here to View figure |
Effect of HPMC and WPC-70 on color of gluten-free bread
The Crust and Crumb color of the Optimized Bread are presented in Table 4. Considering the color of the crust, parameter *a indicated that it lies on the red-axis while parameter *b indicated that it was towards brownish yellow hue. Regarding the brightness, it was found that crust was near the centre of black-white axis. Considering the color of the crumb, parameter *a was slightly towards red tint while the *b parameter showed that the crumb was slightly yellow in color. The L value was towards the greater side of white and revealed high brightness.
Physico-chemical Analysis
The results of the physico-chemical analysis are summarized in Table 4. The results were found to be in range with the standards. The gluten content in the Sorghum Flour was found to be “Nil”. Therefore, according to the standards lay down by Codex10 it is placed under “Non-gluten cereal flour”. Hence, it can be claimed that the product formulated is gluten-free. The protein content of Sorghum Flour, Control Bread and Optimized Bread was recorded as 11.46g, 4.83g and 10.48g respectively. From the result, it is evident that there is a significant increase in the Protein Content of Optimized Bread as compared to Control Bread. This sharp rise in the protein content is due to the addition of WPC-70. As per Codex9 any product can be claimed as “Protein-rich” if the protein content is “2 times the value of source” Therefore, it can be stated that the Optimized Bread is a High Protein source.
Microbiological Analysis
The results of the Microbiological Analysis of optimized gluten-free bread for TPC, Yeast & Mould count and Coliform count were <10 cfu/g, <10 cfu/g and NIL respectively (Table 4).
Table 4: Analytical Output of Optimized Bread
| S.No. | Physico-chemical Parameters | Result (g/100g) | ||
| 1. | Gluten Content (DB) | NIL | ||
| 2. | Protein Content | Flour | Control | Optimized |
| 11.46 | 4.83 | 10.48 (DB) | ||
| 3. | Moisture Content | 38.73 | ||
| 4. | Fat Content | 8.97 | ||
| 5. | Crude Fiber | 2.80 | ||
| 6. | Acid Insoluble Ash | 0.134 | ||
| 7. | pH | 6.1 | ||
| 8. | Texture (Hardness) | 4228.2 5504.8 | ||
| 9. | Crust Color | L= 52.3; a= +15.21; b= +31.59 | ||
| 10. | Crumb Color | L= 64.68; a= +7.77; b= +21.29 | ||
| Microbiological Parameters | Result (cfu/g) | |||
| 11. | Total Plate Count | <10 | ||
| 12. | Yeast & Mould | <10 | ||
| 13. | Coliform | NIL | ||
Conclusion
From the present study, we can conclude that hydrocolloids like HPMC and Whey Protein Concentrate can be used to prepare gluten-free Bread. They improved the overall quality of gluten-free bread in terms of texture, color, porosity and overall acceptability. With the addition of WPC-70, it can be recognized as Protein-rich Bread. Of all other compositions, 3% HPMC and 15% WPC-70 were chosen as best process parameters.
Although all the quality parameters improved with the addition of HPMC and WPC-70, the characteristic taste of sorghum was not much liked. Different properties of HPMC and WPC-70 need to be investigated as they present immense technological interest.
Acknowledgements
Author acknowledges Student Training Dairy, SHUATS, Angel Starch and Food Pvt. Ltd., Perundurai, Mahaan Proteins Ltd., New Delhi, Colorcon Asia Pvt. Ltd., Goa and Best India Bakery, Allahabad for their assistance in the work.
References
- Barcenas M.E, Rosell C.M. Effect of HPMC Addition on the Microstructure, Quality and Aging of White Bread. Food Hydrocolloids; 19(6): 1037-1043: (2005).
CrossRef - BeMiller J.N. Hydrocolloids. In: Hamaker BR (eds.) Technology of Functional Cereal Products, CCRC Press, New York, 203-215: (2011).
- Bureau of Indian Standards. Specification for Wheat Atta. IS 1155:1968 (Re 2010). New Delhi: BIS: (1968).
- Bureau of Indian Standards. Bakery Products- Methods of Analysis. IS 12711:1989 (Re 1994). New Delhi: BIS: (1989).
- Bureau of Indian Standards. Biscuits Specification. IS 1011:2002 (Re 2009). New Delhi: BIS: (2002).
- Bureau of Indian Standards. Microbiology- General Guidance for the Enumeration of Coliforms. IS 5401 (Part 1): 2012. New Delhi: BIS: (2012).
- Bureau of Indian Standards. Microbiology of Food and Animal Feeding Stuffs- Horizontal Method for the Enumeration of Micro-Organisms- Colony Count Technique at 30ºC. IS 5402: 2012. New Delhi: BIS: (2012).
- Catassi C, Fasano A. Celiac Disease. Current Opinion in Gastroenterology; 24: 687-691: (2008).
CrossRef - Codex Alimentarius Commission. Guidelines for Use of Nutrition and Health Claims (CAC/GL 23-1997). CAC: (1997).
- Codex Alimentarius Commission. Codex Standard for Foods or Special Dietary Use for Person Intolerant to Gluten (Codex Stan 118-1979): (2008). Retrieved from http://www.codexalimentarius.net/input/download/standards/291/cxs_118e.pdf
- Engleson J, Atwell B. Gluten-free Product Development. Cereal Foods World; 53(4): 180-184: (2008).
CrossRef - Guarda A, Rosell C. M, Benedito C, Galotto M. J. Different Hydrocolloids as Bread Improvers and Antistaling Agents. Food Hydrocolloids; 18; 241-247: (2004).
CrossRef - Hoffman J. R, Falvo M. J. Protein- Which is Best? Journal of Sports Science and Medicine; 3: 118-130: (2004).
- Kinsella J. E. Physical Properties of Food and Milk Components, Research Needs Extend Uses. Journal of Dairy Sciences; 70: 2419- 2424: (1987).
CrossRef - Kirk S, Sawyer R. Pearson’s Composition and Analysis of Foods, 9th Longman, U.K. (1991).
- Mariani P, Grazia VM, Montouri M, La Vecchia A, Cipolleta E, Calvani L. The Gluten-free Diet: A Nutritional Risk Factor for Adolescents with Celiac Disease. Journal of Pediatric Gastroenterology and Nutrition; 27: 519-523: (1998).
CrossRef - Marston K, Khouryieh H, Aramouni F. Evaluation of Sorghum Flour Functionality and Quality Characteristics of Gluten-free Bread and Cake as Influenced by Ozone Treatment. Food Science and Technology International; 218(8): 631-640: (2014).
- Meyer C. Meyers Bageri, 1st Lindhardt & Ringhof Forlag, Copenhagen: (2009).
- Ministry of Health and Family Welfare Manual Methods of Analysis of Foods- Cereal and Cereal Products. Lab Manual 3. New Delhi: FSSAI (2012).
- Mondal A, Datta A. K. Bread Baking- A Review. Journal of Food Engineering; 86: 465-474: (2007).
CrossRef - Morr C. V, Foegeding E. A. Composition and Functionality of Commercial Whey and Milk Protein Concentrates and Isolates- A Status Report. Food Technology; 44: 100- 112: (1990).
- Ranganna S. Handbook of Analysis and Quality Control for Fruits and Vegetable Products, 2nd Tata McGraw-Hill, New Delhi: (1986).
- Rooney L. W, Waniska R. D. Sorghum Food and Industrial Utilization. In: Smith CW, Frederiksen RA (eds.) Sorghum: Origin, History, Technology and Production. Wiley, Canada, 689-729: (2000).
- Rosell C. M, Rojas J. A, Benedito de Barber C. Influence of Hydrocolloids on Dough Rheology and Bread Quality. Food Hydrocolloid 21;: 452- 462: (2001).
CrossRef - Sabanis D, Tzia C. Effect of Hydrocolloids on Selected Properties of Gluten-free Dough and Bread. Food Science and Technology International; 4: 279: 291: (2011).
- Schober T. J, Bean S. R, Boyle D. L. Gluten-free Sorghum Bread Improved by Sourdough Fermentation: Biochemical, Rheological and Microstructural Background. Journal of Agriculture and Food Chemistry; 55: 5137-5146: (2007).
CrossRef - Schober T. J, Messerschmidt M, Bean S. R, Park S. H, Arendt E. K. Gluten-free Bread from Sorghum: Quality Differences among Hybrids. Cereal Chemistry; 82: 394-404: (2005).
CrossRef - Serena-Saldivar S, Rooney L. W. Structure and Chemistry of Sorghum and Millets. In: Dendy DAV (eds.) Sorghum and Millets: Chemistry and Technology, AACCI, St. Paul, USA, 69-124: (1995).
- Suhendro E. L, Kunetz C. F, Mcdonough C. M, Rooney L. W, Waniska R. D. Cooking Characteristics and Quality of Noodles from Food Sorghum. Cereal Chemistry; 77: 96- 100: (2000).
CrossRef - Trappey E. F, Khouryieh H, Aramouni F, Herald T. J. Effect of Sorghum Flour Composition and Particle Size on Quality Properties of Gluten-free Bread. Food Science and Technology International; 21: 188- 202: (2015).
CrossRef - Winger M, Khouryieh H, Aramouni F, Herald T. J. Sorghum Flour Characterization and Evaluation in Gluten-free Tortilla. Journal of Food Quality; 37: 95- 106: (2014).
CrossRef - Youssif FS, I. Supplementation of Fermented Sorghum Dough with Whey Protein: Sensory and Biochemical Evaluation. Dissertation, University of Khartoum: (2004).
Accepted on: 14-03-2018
Final Approval by: Prof. Rajesh Jeewon


Web of Science Coverage
Emerging Sources Citation Index (ESCI)
2024 Journal Impact Factor: 1.1
Scopus Journal Metrics
CiteScore 2025: 2.6
CiteScore Details
Sustainable Nutrition: Food Systems, Nutrient Retention, and Public Health Impact
![]()
This journal is a member of, and subscribes to the principles of, the Committee on Publication Ethics (COPE)


