Cyanogenic Content, Aflatoxin Level and Quality of Dried Cassava Chips and Flour Sold in Nairobi and Coastal Regions of Kenya
1Dept. of Food Science, Nutrition and Technology, University of Nairobi, P. O .Box 29053-00625, Nairobi, Kenya
2Kenya Agricultural and Livestock Research Organization (KALRO), Mtwapa, Kenya.
Corresponding Author Email: georkoyo@yahoo.com
DOI : http://dx.doi.org/10.12944/CRNFSJ.3.3.03
Download this article as:
![]()
Cassava is a staple food for approximately 800 million people in the world. However, it poses food safety risks to the consumers due to naturally occurring cyanogenic glucosides. Thirty six samples of cassava products from Nairobi and Mombasa markets were evaluated for hydrogen cyanide (HCN), aflatoxin, moisture content, and colour. The HCN content was in the range 27.20-42.92 mg/kg and 21.45-37.77 mg/kg in cassava chips; 21.53-64.63 mg/kg and 21.70-70.03 mg/kg in flour from Nairobi and Mombasa respectively. The HCN was significantly different (p≤0.05) among samples in both the dried cassava chips and cassava flour. Aflatoxin levels detected in two flour samples from Nairobi were 6.60 and 8.89 µg/kg respectively, and one sample from Mombasa; 2.84 µg/kg. Moisture content was in the range of 8.62-9.98% and 8.85-11.57% in cassava chips; 8.50- 12.51% and 7.30-11.0% in cassava flour samples from Nairobi and Mombasa, respectively. The L* values were in the range of 83.9-92.0 and 69.0-81.7 and the colour difference from the standard white paper (ΔE*) were in the range of 14.5-22.7 and 25.6-37.1 in cassava chips samples from Nairobi and Mombasa markets respectively indicating dried cassava chips sold in the markets were less white. The L* values for cassava flour was in the range of 95.3-100.0 and 94.7-100.0 with ΔE* of 4.6-9.6 and 0.9-11.5 for Nairobi and Mombasa markets respectively indicating very white flours were sold in the market. These results show that the flour in the market may be of good aesthetic quality but unsafe for consumption. Effect of processing on safety could be evaluated.
KEYWORDS:Cassava flour; Cassava chips; Hydrogen Cyanide; Moisture Content; Colour
Introduction
Cassava (Manihot esculenta Crantz) is an important food crop due to the high carbohydrate content it provides to the diet; it is a staple food for approximately 800 million people.1 The main food sources are starchy tuberous roots but the young leaves which are high in protein are also consumed.2,3 However, Cassava contains two cyanogenic glucosides, linamarin and lotaustralin (methyl linamarin) which are normally produced as a defence mechanism against predators as well as when the cassava tissue is crushed. These chemicals (cyanogens) are distributed widely throughout the plant, with the highest amounts occurring in the leaves and the root skin layer (root cortex), with lower amounts in the interior of the root (root parenchyma).4 Cyanide inhibits cellular respiration of all aerobic organisms by blocking mitochondrial electron transport and preventing oxygen uptake.5 High exposure in humans leads to several symptoms such as nausea, vomiting, diarrhoea, dizziness, weakness and sometimes death.6 The maximum safe level of cyanogens in cassava products including, dried cassava chips and flour set by the World Health Organization (WHO) is 10 mg/kg,7 with the limits in Indonesia set at 40 mg/kg.8,9 The East African Standards EAS 739:2010; 740:2010 sets the hydrogen cyanide limit at 10 mg/kg.10,11 Mycotoxin contamination is one of the factors that are a threat to food safety and quality. Tropical African climate is conducive for the growth of fungi and subsequent toxin production.12 The greatest risk to health in tropical Africa is posed by aflatoxins, due to their widespread prevalence and toxicity.13 According to a study by Williams et al.,14 mycotoxin exposure contributes to more than 40% of the global disease burden. The reduction of the average human life span in Africa has been correlated with exposure to mycotoxins.15 In Kenya, there was an incident where more than 125 deaths were attributed to acute aflatoxin poisoning.16 Colour is a very important attribute of food, many consumers check on colour as a measure of quality and it often affects judgment on the safety and it may be affected by the Many processes used in producing cassava products (dried cassava chips/flour). In Africa, the low quality and safety of foods have a significant impact on human and animal health, as well as being a major constraint to growers who need access to more remunerating markets.13 The aim of this study was to assess the safety and quality of commercial cassava products (dried chips and flour) in terms of hydrogen cyanide content, aflatoxins, moisture content and colour in Nairobi and Coastal (Mombasa) regions of Kenya.
Materials And Methods
Sampling of dried cassava chips and flour
Markets were identified in Coastal (Mombasa) and Nairobi regions and dried cassava chips and flour were sampled exhaustively from retailers who operated in these markets. In Mombasa region, three (3) markets were identified: Majengo (MJ), Kongowea (KON), and Marikiti (MA). In Nairobi region, five (5) markets were identified: Uthiru (UT), Kawangware (KAW), Gikomba (GIK), Githurai (GIT), and Muthurwa (MUT). Supermarkets were also visited for any available stocks. A total of thirty six (36) samples of both dried cassava chips and cassava flour were purchased in duplicate; of which, thirteen were dried cassava chips and twenty three were cassava flours from the different markets identified in the study regions. The samples were then packed in airtight sample bags and transported to the University of Nairobi, chemistry and toxicology laboratories for analysis.
Determination of Hydrogen Cyanide content
The hydrogen cyanide (HCN) content of dried cassava chips and cassava flour were analysed according to method described byAOAC.17 Approximately 10 g of the sample was mixed with approximately 100 ml distilled water in a distillation flask; the mixture was distilled and approximately 200 ml of the distillate collected in a volumetric flask containing 25 ml of 2.5% NaOH solution. A portion of 8 ml of 5% KI solution was then added to 100 ml of distillate and titrated against 0.02N silver nitrate (AgNO3) solution. The end point was indicated by a faint but permanent turbidity. The HCN content was calculated as: 1 ml of 0.02 N Silver Nitrate being equivalent to 1.08 mg of HCN per 10 g and then expressed as HCN mg/kg of sample. Analysis was done in duplicates.
Determination of Aflatoxin levels
Aflatoxin was determined by ELISA Method according to method described by.13 About 20 g of sample was extracted using 100 ml of 70 % methanol. The samples were filtered through Whatman filter paper and 15 ml of the extract collected. The filtrate tested using the Helica total Aflatoxin Enzyme-Linked Immunoassay (ELISA) assay kit. The limit of detection was 1 µg/kg. Samples were run in duplicates.
Determination Moisture Content
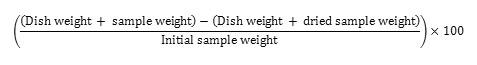
The dried cassava chips were ground into powder using a grinder (Ramtons, model: RM /161 China) while the cassava flour was analyzed as it was. Moisture dishes weights were recorded, then approximately 2 grams of the samples were used. All measurements were in duplicates. The moisture dishes plus the samples were dried in an electric oven at 1050 C for 3 hours, and weights after drying and cooling recorded; this was done according to a method as described by AOAC.18 The calculation for the moisture was then done as per below formulae.
Colour Determination
Colour was measured by colorimeter (MINOLTA CHROMA METER CR-200b) using CIELAB L*a*b* colour scale. L* indicates lightness and when closer to 100 is considered whiter, a* denotes the red/green with a positive (+) value showing a shift towards red and b* denotes the yellow/blue value with a positive (+) b* indicates a shift towards yellow. Colour readings were taken at different locations on the samples of dried cassava chips and flour. The meter was calibrated using a standard white paper (L* = 102.0 a*=+0.7 b* = +0.7). ΔE value which defines the change of the total colour difference from the standard was determined. ΔE is defined by the following equation: ΔE = √ ((ΔL) 2+ (Δa) 2+ (Δb) 2). ΔL (lightness) = Colour difference is calculated as the sample L* value minus standard; Δa = Colour difference is calculated as the sample a* value minus standard; Δb = Colour difference is calculated as the sample b* value minus standard.19
Statistical Analysis
All data was then subjected to analysis of variance (ANOVA) and the means and LSD separated by Duncan Multiple Range Test p=0.05 using Genstat 15th Edition.
Results and Discussion
The East African Standard EAS 739:2010 stipulates the compositional requirements for dried cassava chips that need to be conformed to for the dried chips to be considered safe for consumption. It requires that dried cassava chips have a maximum HCN content of 10 mg/kg and moisture content of 12%. The Codex Alimentarius Commission requires that aflatoxin in foods should not be more than 10 µg/kg.20
Hydrogen cyanide, aflatoxin and moisture content of dried cassava chips and cassava flour
Table 1 shows the results of hydrogen cyanide (HCN), aflatoxin and moisture content of the 13 dried cassava chips samples obtained from markets in Nairobi and Mombasa. The HCN content ranged from 27.20 to 42.92 mg/kg and from 21.45 to 37.77 mg/kg in samples of dried cassava chips from Nairobi and Mombasa markets respectively. There was a significant difference (p≤0.05) in HCN among the dried cassava chips from both Nairobi and Mombasa markets. All the samples of dried cassava chips had HCN levels that were more than 10 mg/kg. These quantities are above the recommended acceptable limits with the least amounts in samples from Nairobi and Mombasa being 21.45 and 27.20 mg/kg respectively. The high levels of HCN in the cassava chips may be due to the improper processing of the cassava roots or high amounts of total cyanide levels in the raw cassava.4 The high levels of HCN found in the present study are in agreement with what21 found in a study carried out in Nigeria. Similarly22 reported that cassava chips contained as high as 262 mg/kg and an overall mean of 91 mg/kg HCN
Table 1: Hydrogen Cyanide, Aflatoxin, Moisture Content of Dried Cassava Chips from Nairobi and Mombasa Markets.
| Sample/Market | Source | HCN (mg/kg) | Aflatoxin(µg/kg) |
MC (%) |
| GIK 1 | Nairobi | 37.62 ± 0.04d | nd | 9.18 ± 0.49ab |
| GIK 2 | Nairobi | 27.20 ± 0.04a | nd | 9.35 ± 0.27ab |
| GIK 3 | Nairobi | 36.92 ± 0.28c | nd | 9.43 ± 0.25ab |
| GIK 4 | Nairobi | 32.30 ± 0.04b | nd | 9.98 ± 0.29b |
| GIK 6 | Nairobi | 42.92 ± 0.28e | nd | 8.91 ± 0.45ab |
| GIK 8 | Nairobi | 27.20 ± 0.14a | nd | 8.62 ± 0.42a |
| KAW 1 | Nairobi | 42.75 ± 0.21e | nd | 9.60 ± 0.55ab |
| KAW 2 | Nairobi | 26.92 ± 0.04a | nd | 9.68 ± 0.79ab |
| KON1 | Mombasa | 21.45 ± 0.07a | nd | 11.57 ± 1.07c |
| KON2 | Mombasa | 37.62 ± 0.04b | nd | 10.65 ± 0.14bc |
| KON3 | Mombasa | 37.62 ± 0.18b | nd | 8.85 ± 0.01a |
| KON4 | Mombasa | 21.55 ± 0.21a | nd | 9.21 ± 0.48ab |
| MAJ1 | Mombasa | 37.77 ± 0.18b | nd | 10.15 ± 0.14abc |
Values=Means ± Standard deviation;
Means in the same column with different superscripts are significantly different (P≤ 0.05); Nd= Not detectable within the assay used which had a maximum detectability level of 1µg/kg; HCN= Hydrogen Cyanide (mg/kg); MC= Moisture Content (%) Even though cassava chips are usually processed further, the high HCN content shows that there is need for better or higher intensity in processing methods to have a safe end product for human consumption as well as the need of coming up with cassava varieties that have relatively lower cyanogenic glucosides content. All the samples of dried cassava chips from markets in both study sites showed no detectable (nd) levels of total aflatoxin thus were within the limits set by the CAC.20 The low quantities of aflatoxin in the present study may be attributed to the fact that dried chips not being a good substrate for aflatoxin biosynthesis. The low aflatoxin content may also be attributed to shorter storage period of cassava chips as well as proper storage conditions as shown by the moisture content observed in the samples collected. According to Setamou et al.,23 poor storage coupled with inappropriate handling methods contribute to accumulation of mycotoxins. The low or no incidences of aflatoxin contamination have also been reported in Ghana24 and Benin, where a report showed no aflatoxin contamination of cassava chips.25 The results are also in agreement with those of studies done by other authors.26 27,21 They however are not in agreement with those in a report by13 that indicated that all cassava chip samples collected in Tanzania contained aflatoxin though in low quantities. The moisture content (wwb) of the dried cassava chips collected ranged from 8.62 to 9.98% in Nairobi and 8.85 to 11.57% in Mombasa markets. There was no significant difference (p>0.05) in moisture content between most of the samples from both study sites. Moisture content of cassava chips was below 12% as recommended in the standards. Low moisture content observed in the dried cassava chips from Nairobi and Mombasa may be attributed to effective drying methods employed by the processors, as cassava is perishable and needs to be dried optimally to keep longer; thus the processors and traders avoid making losses by ensuring proper drying. The lower the moisture content, the better it would be for storage to prevent growth of microorganisms, undesirable fermentation and caking28; high moisture content is also a prerequisite for growth and proliferation of mould and eventual mycotoxin production. Effective drying is also preferred as water activity may be increased by moisture uptake during storage and this may lead to change in certain chemical and organoleptic properties.29
Table 2 shows the hydrogen cyanide, aflatoxin and moisture content of the 23 flour samples obtained from markets in Nairobi and Mombasa. There was a significant difference (p≤0.05) in the HCN content of flour among the different markets and traders in both the study sites. The range for the HCN content in flour samples was 21.53-64.63 mg/kg in Nairobi markets and 21.70-70.03 mg/kg in Mombasa; these levels are higher than the maximum acceptable recommended level of 10 mg/kg. The results in the present study are in agreement with reports by.4,30 In Indonesia, the mean cyanide content for flour was found to be 54 mg/kg.9 The high HCN levels may be attributed to poor processing methods for the cassava flour. A report by4 showed that areas of eastern, central and southern Africa, where flour is produced after sun drying, the cyanide content is high on a normal year and gets worse in low rainfall years. A report by31 intimated that total cyanide levels in roots increased when there was low rainfall due to water stress on the cassava plant. A study by32 showed the effect of low rainfall of greatly increasing total cyanide content of cassava flour; hence may also be an explanation for the high levels reported in the present study.
Table 2: Hydrogen Cyanide, Aflatoxin and Moisture Content of Cassava Flour from Nairobi and Mombasa Markets.
| Sample | Source | HCN (mg/kg) | Aflatoxin (µg/kg) |
MC (%) |
| GIK1 | Nairobi | 32.48 ± 0.18c | nd | 10.55 ± 0.35ab |
| GIK2 | Nairobi | 27.18 ± 0.32b | nd | 10.15 ± 0.07ab |
| GIK3 | Nairobi | 27.28 ± 0.32b | nd | 10.57 ± 0.35ab |
| GIK4 | Nairobi | 43.28 ± 0.18e | nd | 9.06 ± 0.37ab |
| GIK5 | Nairobi | 53.93 ± 0.04g | nd | 10.55 ± 0.07ab |
| GIK6 | Nairobi | 21.53 ± 0.04a | 6.60 ± 0.00 | 10.33 ± 0.04ab |
| GIT1 | Nairobi | 43.13 ± 0.04e | nd | 10.15 ± 0.49ab |
| KAW1 | Nairobi | 43.15 ± 0.00e | nd | 12.51 ± 3.20b |
| KAW3 | Nairobi | 48.60 ± 0.00f | 8.89 ± 0.00 | 10.75 ± 0.07ab |
| KAW4 | Nairobi | 48.60 ± 0.00f | nd | 8.50 ± 3.10a |
| KAW5 | Nairobi | 37.75 ± 0.00d | nd | 10.83 ± 0.52ab |
| KAW6 | Nairobi | 27.00 ± 0.00b | nd | 10.75 ± 0.13ab |
| MUT1 | Nairobi | 37.73 ± 0.04d | nd | 11.85 ± 3.61ab |
| UT1 | Nairobi | 43.13 ± 0.04e | nd | 9.20 ± 0.28ab |
| UT2 | Nairobi | 54.10 ± 0.14g | nd | 10.55 ± 0.07ab |
| UT3 | Nairobi | 48.60 ± 0.14f | nd | 11.05 ± 0.35ab |
| UT4 | Nairobi | 64.63 ± 0.18h | nd | 10.45 ± 0.07ab |
| MA1 | Mombasa | 21.70 ± 0.14a | nd | 7.30 ± 0.14a |
| MJ1 | Mombasa | 64.75 ± 0.07e | 2.84 ± 0.00 | 10.95 ± 0.07d |
| MJ2 | Mombasa | 58.42 ± 0.04d | nd | 9.72 ± 0.06c |
| MJ3 | Mombasa | 32.65 ± 0.35b | nd | 8.53 ± 0.74b |
| MJ4 | Mombasa | 70.03 ± 0.11f | nd | 11.00 ± 0.14d |
| MJ5 | Mombasa | 37.83 ± 0.11c | nd | 7.85 ± 0.07ab |
Values=Means ± Standard deviation; means in the same column with different superscripts are significantly different (P≤ 0.05); nd= Not detectable within the assay used which had a maximum detectability level of 1µg/kg; HCN= Hydrogen Cyanide (mg/Kg); MC= Moisture Content (%)
In a study by33 where flour samples were collected in November 1998 and in July 1999, many cases of acute intoxication and occurrence of Konzo in the communities were attributed to the high cyanide level in flour samples. It is also important to note that the HCN contents that were recorded in this study are acceptable in some countries, for instance the limit that is acceptable in Indonesia is 40 mg/kg.4,34 High HCN may lead to acute cyanide poisoning or a chronic sickness that is associated with extended use of monotonous diets of high HCN foods, Konzo or tropical ataxic neuropathy (TAN).35 It is clear that better cultivars of cassava should be developed and the information communicated to farmers and more effective processing protocols should be developed and the information communicated to processors to ensure the HCN levels are reduced to acceptable values. Aflatoxin was detected in two flour samples in Nairobi; 6.60 µg/kg (GIK6) and 8.89 µg/kg (KAW3), representing 11.76% of the samples from Nairobi. In Mombasa only one flour sample MJ1 had 2.84 µg/kg of total aflatoxin. The levels reported are lower than the maximum levels set by the CAC20; this indicates that the cassava flours are not good substrates for aflatoxin biosynthesis. The results in the present study are in agreement with those reported by25,36 that revealed no aflatoxin contamination in flours in studies in Malawi, Zambia and Benin. A study in Uganda that was carried out on 10 samples of cassava flour also showed no aflatoxin contamination.37 There was no significant difference (p>0.05) in the moisture content (MC) of flour samples from Nairobi but there was a significant difference (p≤0.05) between MC of flour samples from Mombasa markets. The MC range was 8.50- 12.51 %, with 17.6% of the samples having below 10% in Nairobi markets; and the MC range in samples from Mombasa markets was 7.30-11.0% and were all below the limits recommended in the standards. Low MC of cassava flour samples from Nairobi and Mombasa markets may be attributed to effective drying processes used; moisture content of flour is influenced by extent of drying and relative humidity during the period of sun-drying.38 Flour samples from Mombasa were relatively lower in MC than those from Nairobi region; this may be attributed to higher temperatures that are usually recorded in the Coastal areas. Transportation conditions and distances from areas of production may also play a role in the difference of the moisture content between Mombasa and Nairobi; mainly because cassava flour found in Nairobi markets is often from the coastal or western regions of Kenya, moreover, the storage conditions of the flour in the markets in both sites of study may also play a role in the different moisture contents recorded. The results in the present study are in agreement with those reported by.29,38,39 Low moistures lead to longer shelf lives of cassava products as they reduce microbial growth and proliferation.
Colour of Dried Cassava Chips and Flour
Standards EAS 739:2010 and EAS 740:2010 on dried cassava chips and cassava flour respectively state that the colour of these products should be white, creamy or yellow.
Table 3 shows colour parameters in terms of CIE L*a*b* for 13 dried cassava chips samples that were obtained from Nairobi and Mombasa markets. There was no significant difference (p>0.05) in L* values of Cassava chips sampled from markets in both study sites with values ranging from 83.9 to 92 in Nairobi markets and from 69.0 to 81.7 in Mombasa markets.
Table 3: Colour Parameters for Dried Cassava Chips from Nairobi and Mombasa Markets
| Sample | Source | L* | a* | b* | ΔE* |
| GIK1 | Nairobi | 92.0 ± 3.4a | 1.2 ± 0.6ab | 11.9 ± 2.7ab | 15.0 |
| GIK2 | Nairobi | 90.0 ± 4.0a | 1.1 ± 0.3ab | 10.0 ± 1.9a | 15.2 |
| GIK3 | Nairobi | 91.8 ± 1.8a | 1.2 ± 0.1ab | 11.1 ± 2.1ab | 14.5 |
| GIK4 | Nairobi | 88.9 ± 2.2a | 1.4 ± 0.3ab | 16.5 ± 3.6b | 20.5 |
| GIK6 | Nairobi | 87.5 ± 8.1a | 1.0 ± 0.6a | 11.0 ± 2.6ab | 17.8 |
| GIK8 | Nairobi | 91.2 ± 3.3a | 1.3 ± 0.8ab | 13.5 ± 2.5ab | 16.8 |
| KAW1 | Nairobi | 83.9 ± 5.9a | 2.2 ± 0.8b | 14.4 ± 3.2ab | 22.7 |
| KAW2 | Nairobi | 88.6 ± 1.4a | 1.8 ± 0.5ab | 12.6 ± 3.7ab | 18.0 |
| KON1 | Mombasa | 81.7 ± 7.1a | 2.6 ± 1.1a | 21.2 ± 3.1b | 28.9 |
| KON2 | Mombasa | 71.0 ± 12.9a | 3.2 ± 0.6a | 20.8 ± 1.4ab | 37.1 |
| KON3 | Mombasa | 69.0 ± 3.8a | 2.3 ± 0.4a | 16.1 ± 1.1ab | 36.6 |
| KON4 | Mombasa | 80.7 ± 4.4a | 2.1 ± 0.8a | 16.9 ± 2.9ab | 26.8 |
| MAJ1 | Mombasa | 81.4 ± 12.7a | 3.4 ± 2.2a | 15.6 ± 4.1a | 25.6 |
Values=Means ± Standard deviation, means in the same column with same superscript are not significantly different (p≥0.05); L*= Lightness (≥100); a*= (-) red/green (+); b*= (-) blue/Yellow (+); ΔE*= Difference in colour change from the standard white background
There was no significant difference (p>0.05) in the a* values between the dried cassava chips sampled from markets in Nairobi and Mombasa, with values that ranged from +1.0 to +2.2 in Nairobi and from +2.1 to +3.4 in Mombasa markets. The b* values of the samples from markets in Nairobi and Mombasa had no significant difference (p>0.05) and ranged from +10.0 to +16.5 in Nairobi and from +15.6 to +21.2 in Mombasa markets. The total colour difference (ΔE*) between the samples from markets in both study sites and a white paper used as a standard, were found to be high and were in the range 14.5-22.7 in Nairobi and 25.6-37.1 in Mombasa. Cassava chips sampled from Nairobi were generally white, with GIK4, GIK6, KAW1 and KAW2, showing the greatest ΔE* thus indicating they were less white compared to the white standard paper, with samples from Mombasa having large ΔE*, low L* and higher +b* values. The less whiteness observed in some samples of dried cassava chips, particularly ones obtained from Mombasa markets, could be attributed to the variety, age40 as well as processing procedure which could include lack of thorough peeling, since natural pigments from peels may affect colour.41
Table 4 shows the colour parameters for the 23 cassava flour samples from Nairobi and Mombasa markets. There was no significant difference (p>0.05) in the L* values of cassava flour with values that ranged from 95.3 to 100.0 and from 94.7 to 100.0 in cassava flour from Nairobi and Mombasa markets respectively. The a* values of the samples from the study sites were not significantly different (p>0.05) and ranged from +0.3 to+1.3 and from +0.9 to +1.5 in Nairobi and Mombasa respectively, while b* values of the samples obtained were significantly different (p≤0.05) and ranged from +4.7 to +8.2 in Nairobi and from +0.1 to +10.7 in Mombasa markets.
The ΔE* values of the cassava flour samples from Nairobi markets ranged from 4.6 to 9.6 while those from Mombasa markets ranged from 0.9 to 11.5. The cassava flour samples collected from markets in Nairobi and Mombasa had high L* values and low ΔE* indicating that they were very white, compared to the standard white paper. Consumers generally would look at how white flour is, as an indicator of quality and hence better processing procedure should be adopted to ensure the whiteness such as adoption of better drying equipment that may reduce period of drying as well as other factors that affect colour; for instance exposure to dust and direct sunlight .
Table 4: Colour Parameters for Cassava Flour from Nairobi and Mombasa Markets.
|
Sample |
Source | L* | a* | b* |
ΔE |
| GIK1 | Nairobi | 99.6 ± 0.2d | 0.5 ± 0.1bcde | 5.7±0.1b | 5.6 |
| GIK2 | Nairobi | 99.8 ± 0.4d | 0.3 ± 0.2ab | 6.0±0.3bc | 5.8 |
| GIK3 | Nairobi | 99.4 ± 0.7cd | 0.5 ± 0.2bcde | 6.5±0.3cd | 6.4 |
| GIK4 | Nairobi | 97.6 ± 2.2abcd | 0.8 ± 0.3f | 4.7±0.3a | 5.9 |
| GIK5 | Nairobi | 100.0 ± 0.0d | 0.5 ± 0.1abcde | 4.8±0.2a | 4.6 |
| GIK6 | Nairobi | 99.6 ± 0.3d | 0.3 ± 0.2a | 7.1±0.2d | 6.8 |
| GIT1 | Nairobi | 97.6 ± 1.2abcd | 0.4 ± 0.1abc | 6.2±0.2bc | 7.1 |
| KAW1 | Nairobi | 95.9 ± 0.6ab | 0.4 ± 0.1abcd | 8.0±0.3e | 9.5 |
| KAW3 | Nairobi | 95.3 ± 5.1a | 0.5 ± 0.1bcde | 6.3±0.3bc | 8.8 |
| KAW4 | Nairobi | 97.2 ± 1.3abcd | 0.7 ± 0.1def | 6.0±0.5bc | 7.2 |
| KAW5 | Nairobi | 96.1 ± 0.9abc | 0.6 ± 0.2cdef | 8.0±0.6e | 9.3 |
| KAW6 | Nairobi | 96.1 ± 0.4ab | 0.5 ± 0.1abcde | 8.2±0.3e | 9.6 |
| MUT1 | Nairobi | 96.8 ± 3.0abcd | 1.3 ± 0.1g | 6.2±0.6bc | 7.6 |
| UT1 | Nairobi | 98.7 ± 0.4bcd | 0.5 ± 0.0abcde | 7.1±0.3d | 7.2 |
| UT2 | Nairobi | 95.7 ± 0.7ab | 0.8 ± 0.1f | 5.7±0.1b | 8.0 |
| UT3 | Nairobi | 97.6 ± 2.0abcd | 0.7 ± 0.0ef | 5.9±0.7bc | 6.8 |
| UT4 | Nairobi | 98.4 ± 0.3abcd | 0.8 ± 0.1f | 5.8±0.3b | 6.3 |
| MA1 | Mombasa | 102.3 ± 0.6b | 1.3 ± 0.1cd | 0.1 ± 0.1a | 0.9 |
| MJ1 | Mombasa | 96.7 ± 0.4a | 1.2 ± 0.3bc | 8.6 ± 0.1b | 9.6 |
| MJ2 | Mombasa | 97.0 ± 0.3a | 1.0 ± 0.2ab | 9.5 ± 0.1c | 10.1 |
| MJ3 | Mombasa | 96.3 ± 2.9a | 1.5 ± 0.1d | 10.7 ± 1.0d | 11.5 |
| MJ4 | Mombasa | 96.7 ± 0.4a | 0.9 ± 0.1a | 8.4 ± 0.1b | 9.3 |
| MJ5 | Mombasa | 94.7 ± 2.4a | 1.3 ± 0.1cd | 9.6 ± 0.5c | 11.5 |
Values=Means ± Standard deviation, means in the same column with same superscript are not significantly different (p≥0.05); L*= Lightness (≥100); a*= (-) red/green (+); b*= (-) blue/Yellow (+); ΔE*= Difference in colour change from the standard white background
However, since consumers use this parameter as a measure of quality and safety, they purchase products that are white but unsafe due to high residual HCN. Natural pigments from peels may affect the colour of chips/flour; the older the cassava at the time of processing the less white its product appears to be.41 The whiteness of the cassava chips and flour (Table 3; Table 4) could be attributed to the non-fermentation as well as low microbial contamination as intimated in a report by29 which is in agreement with the results in the present study. The results in the present study are also in agreement with the values of colour parameters in a report by42 which also intimated that there was an increase in ΔE and b* for traditionally processed cassava flour, and further processing of flour made it whiter with a significant decrease in ΔE* and b*.
This study revealed that there is a wide range of cyanide concentrations in dried cassava chips and cassava flour available in the markets in Nairobi and Mombasa. The negative impacts of excess cyanide consumption are well documented and known including acute poisoning. Aflatoxin levels in the cassava products are acceptable and within the recommendations of standards, indicating that cassava is not a good substrate for aflatoxin biosynthesis. Moisture content in cassava products is below 12% indicating proper drying processes thus increasing postharvest quality, while the colour of the products is mostly white thus fitting customer demands. Cassava products in this study are of good quality in terms of aflatoxin levels, moisture content and colour but unsafe for consumption due to their high residual hydrogen cyanide.
The recommendations from this study are: for plant breeders to come up with better cassava cultivars and the information, which are relatively low in cyanogenic glucosides in the harvested raw form; better processing methods that would effectively play a part in achieving lower residual hydrogen cyanide in cassava products to acceptable levels as per standard requirements.
Acknowledgments
This study was funded by Eastern Africa Agricultural Productivity Project (EAAPP). Field research facilitation by the District Agricultural Officers in the respective districts, KALRO, Mtwapa as well as facilitation and human resource at by Department of Food Science, Nutrition and Technology at the University of Nairobi is highly appreciated.
References
- FAO/IFAD. The World Cassava Economy: Facts, Trends and Outlooks. Food and Agriculture Organization of the United Nations and International Fund for Agricultural Development. Rome; (2000).
- Achidi A. U., Ajayi O. A., Bokanga M., Maziya-Dixon B. The use of cassava leaves as food in Africa. Ecology of Food and Nutrition; 44: 423-435: (2005).
CrossRef - Montagnac J. A., Davis C. R., Tanumihardjo S. A. Nutritional value of cassava for use as a staple food and recent advances for improvement. Comprehensive Reviews in Food Science and Food Safety; 8: 181-194: (2009).
CrossRef - Cardoso A. P., Mirione E., Ernesto M., Massaza F., Cliff J., Haque M. R., Bradbury J. H. Processing of cassava roots to remove cyanogens. Journal of Food Composition and Analysis; 18: 451-460: (2005).
CrossRef - Solomonson L. P. Cyanide as a metabolic inhibitor. In: Vennesland B., Conn E. E., Knowles C. J., Westley J., Wissing F. (Eds.). Cyanide in Biology. Academic Press London; 11-28: (1981).
- Akintonwa A., Tunwashe O., Onifade A. Fatal and non-fatal acute poisoning attributed to cassava-based meal. Acta Horticulturae; 375: 285-288: (1994).
CrossRef - FAO/WHO. Joint FAO/WHO Food Standards Programme Codex Alimentarius Commission XII. Supplement 4, FAO, Rome, Italy; (1991).
- Damardjati D. S., Widowati S., Rachim A., Cassava flour production and consumers acceptance at village level in Indonesia. Indonesian Agricultural Research and Development Journal; 15: 16-25: (1993).
- Djazuli M., Bradbury J. H., Cyanogen content of cassava roots and flour in Indonesia. Food Chemistry; 65: 523–525: (1999).
CrossRef - EACa. Dried cassava chips; dried cassava chips specification. Arusha: East African Community; (2010).
- EACb. Cassava flour; cassava flour specification. Arusha: East African Community; (2010).
- Bankole S. A., Adebanjo A. Mycotoxins in food in West Africa: Current situation and possibilities of controlling it. African Journal of Biotechnology; 2: 254-263: (2003).
CrossRef - Manjula K., Hell K., Fandohan P., Abass A. Bandyopadhyay R. Aflatoxin and fumonisin contamination.Toxin Reviews; 28(2): 63-69: (2009).
CrossRef - Williams J. H., Philips T. D., Jolly P. E., Stiles J. K., Jolly C. M., Agarwal D. Human aflatoxicosis in developing countrie: a review of toxicology, exposure, potential health consequences, and interventions. American Journcal of Clinical Nutrition; 80: 1106-1122: (2004).
- Miller J. D. Mycotoxins. Cardwell K.F., (Ed.) Proceedings of the workshop on mycotoxins in food in Africa. November 6-10. 1995. Cotnou, Benin. International Institute of Tropical Agriculture; 18-22: (1996).
- Azziz-Baumgartner E., Lindblade K., Gieseker K., Rogers S. H., Kieszak S., Njapau H., Schleicher R., McCoy L. F., Misore A., DeCock K., Rubin C., Slutsker L. The aflatoxin investigative group. Envorinmental Health Perspective; 113: 1779-1783: (2005).
CrossRef - AOAC. Official method of analysis. Association of Official Analytical Chemist 15 Edn. Washington D.C; (1990).
- AOAC. Official methods of analysis. Association of Official Analytical Chemists; 18th edn. Arlington, VA, USA; (2005).
- Morrison W. R., Laignelet B. An improved colorimetric procedure for determining apparent and total amylose in cereal and other starches. Journal of Cereal Science; 1: 9-20: (1983).
CrossRef - CAC. Codex standard for edible cassava flour. Adopted 1989, revision 1995 CODEX STAN 176-1989; (2013): 1-2: (2013)
- Oghenechavwuko U. E., Saka G. O., Adekunbi T. K., Taiwo A. C. Effect of processing on the physico-chemical properties and yield of gari from dried chips. Journal of Food Processing and Technology; 4(8): 01-06: (2013).
- Burns A. E, Bradbury H. J., Cavagnaro R. T, Gleadow M. R. Total cyanide content of cassava food products in Australia. Journal of Food Composition and Analysis; doi:10.1016/j.jfca.2011.06.005: (2011).
CrossRef - Setamou M., Cardwell K. F., Schulthess F., Hell K. Aspergillus flavus infection and aflatoxin contamination of preharvest maize in Benin. Plant Disease Journal; 81: 1323-1327: (1997).
CrossRef - Wareing P. W., Westby A., Gibbs J. A., Allotey L. T., Halm M. Consumer preferences and fungal mycotoxin contamination of dried cassava products. International Journal of Food Science and Technology; 36: 1-10: (2001).
CrossRef - Gnonlonfin G. J. B., Hell K., Fandohan P. Siame A. B. Mycoflora and natural occurrence of aflatoxins and fumonisin B1 in cassava and yam chips from Benin, West Africa. International Journal of Food Microbiology; 122: 140-147: (2008).
CrossRef - Oluwole O. B., Olatunji O. O., Odunfa S. A. A process technology for conversion of dried cassava chips into “Gari”. Nigerian Food Journal; 22: 65-67: (2004).
- Usman-Mohammed A. Size reduction of cassava chips and the drying rate. Journal of Research in National Development; 9(1): 79-87: (2011).
- Maltini E, Torreggiani D, Venir E, Bertolo G. Water activity and the preservation of plant foods. Food Chemistry; 82: 79–86: (2003).
CrossRef - Eriksson E., Koch K., Tortoe C., Akonor P. T., Baidoo E. Physicochemical, functional and pasting characteristics of three varieties of cassava in wheat composite flours. British Journal of Applied Science & Technology; 4(11): 1609-1621: (2014).
CrossRef - Cardoso A. P., Ernesto M., Cliff J., Egan S. V., Bradbury J. H. Cyanogenic potential of cassava flour: field trial in Mozambique of a simple kit. International Journal of Food Sciences and Nutrition; 49: 93-99: (1998).
CrossRef - Bokanga M., Ekanayake I. J., Dixon A. G. O., Porto M. C. M. Genotype-environment interactions for cyanogenic potential in cassava. Acta Horticulturae; 375: 131-139: (1994).
CrossRef - Cardoso A. P., Ernesto M., Cliff J., Bradbury J. H. High levels of total cyanogens in cassava flour related to drought in Mozambique. Roots; 6: 4-6: (1999).
- Ernosto M., Cardoso A. P., Nicala D., Mirione E., Massaza F., Cliff J., Haque M. R., Bradbury J. H. Persistent Konzo and cyanide toxicity from cassava in Northern Mozambique. Acta Tropica; 82: 357-362: (2002b).
CrossRef - Adindu M. N., Olayemi F. F., Nze-Dike O. U. Cyanogenic potential of some cassava products in Port Harcourt markets in Nigeria. Jourrnal of Food Composition and Analysis; 16: 21-24: (2003).
CrossRef - Mckey D., Cavagnaro T. R., Cliff J., Gleadow R. M. Chemical ecology in coupled human and natural systems: people, manioc, multitrophicilnteractions and global change. Chemoecology; 20: 109-133: (2010).
CrossRef - Chiona M., Ntawuruhunga P., Benesi I. R. M., Matumba L., Moyo C. C. Aflatoxins contamination in processed cassava in Malawi and Zambia. African Journal of Food, Agriculture, Nutrition and Development; 14(3): 8809-8820: (2014).
- Essers A. J. A., Ebong C., van der Grift R. M., Nout M. J. R, Otim-Nape G. W. Rosling H. Reducing cassava toxicity by heap-fermentation in Uganda. International Journal of Food Science and Nutrition; 46: 125-136: (1995).
CrossRef - Apea-Bah F. B., Oduro I., Ellis W. O., Safo-Kantanka O. Factor analysis and age at harvest effect on the quality of flour from four cassava varieties. World Journal of Dairy & Food Sciences; 6(1): 43-45: (2011).
- Emmanuel O. A., Clement A., Agnes S. B., Chiwona-Karltun L., Drinah B. N. Chemical composition and cyanogenic potential of traditional and high yielding CMD resistant cassava (Manihot esculenta Crantz) varieties. International Food Research Journal; 19(1): 175-181: (2012).
- Oduro-Yeboah C., Johnson P-N. T., Sakyi-Dawson E. Budu A. Effect of processing procedures on the colorimetry and viscoelastic properties of cassava starch, flour and cassava-plantain fufu flour. International Food Research Journal; 17: 699-709: (2010).
- Van-Hall M. Quality of sweet potato flour during processing and storage. Food ReviewInternational; 16: 1-37: (2000).
CrossRef - Hongbete F., Mestres C., Akissoe N., Nago C. M. Effect of processing conditions on cyanide content and colour of cassava flours from West Africa. African Journal of Food Science; 3(1): 01-06: (2009).


Web of Science Coverage
Emerging Sources Citation Index (ESCI)
2024 Journal Impact Factor: 1.1
Scopus Journal Metrics
CiteScore 2025: 2.6
CiteScore Details
Sustainable Nutrition: Food Systems, Nutrient Retention, and Public Health Impact
![]()
This journal is a member of, and subscribes to the principles of, the Committee on Publication Ethics (COPE)


