Effects of Calcium and Vitamin D-Fortified Diet on Glycemic Profile, Biochemical Parameters and Selected Haemostatic and Haematological Indices in Diabetic Rats
Dept.of.Physiology, Bowen University, Iwo, Osun State, Nigeria.
DOI : http://dx.doi.org/10.12944/CRNFSJ.3.1.02
Download this article as:
![]()
Results obtained from studies on the effect of vitamin D supplementation with or without calcium on glucose homeostasis and hematological parameters have been inconsistent. This experimentally-controlled designed study investigated the combined effects of Ca2+ and Vit.D-fortified diet on body weight, glycemic profile, biochemical, haemostatic and haematological parameters in 2 groups (n=8, each) of experimental male diabetic and healthy albino rats following treatment with Ca2+ and Vit.D-fortified diet for 6 weeks. 2 similar groups of rats (n=8, each) on normal diets served as normal and diabetic controls respectively to allow comparison between groups. Induction of diabetes (100mg/dL, intraperitoneally) was achieved with freshly prepared alloxan monohydrate solution after 15 hours overnight fast while oral glucose tolerance test, biochemical and hematological analysis were performed on blood samples. Fasting blood glucose (FBG) was taken at study baseline and 6 weeks after feeding. Mean weights were significantly (p < 0.05) lower in calcium/vitamin D-fortifed diet-fed diabetic and normal rats compared with their respective controls. Actual percentage numerical weight gain at 6 weeks of study includes: diabetic rats on treatment diet (15.50%); diabetic controlled rats (18.70%); normal rats on treatment diet (20.40%); normal controlled rats (25.10%). At 6 weeks of study, experimental diabetic rats showed significant (p < 0.05) reduction (22.83%) in mean FBG concentration compared with the diabetic control rats. Experimental rats fed on calcium and vitamin D-fortified diet displayed improved glycemic tolerance over their respective controls. Hematological analysis revealed insignificant (p > 0.05) difference in hematological and hemostatic indices between the experimental and controlled rats. In diabetic rats, Ca2+ and Vit.D-fortified diet reduced body weight with beneficial hypoglycemic and remarkable glycemic tolerant effects on glycemic profile without significant impact on hemostatic and hematological indices.
KEYWORDS:Calcium and vitamin D-fortified diet; glycemic profile; hemostatic and hematological indices; diabetic rats
Introduction
Vitamin D deficiency plays an important role in many diseases such as diabetes,1 hypertension,2 cardiovascular disease,3 immune disorders, osteoporosis and cancers.4 Exposure to sunlight, dietary intake and supplementation with vitamin D are the main sources of vitamin D in human.5 Being a fat-soluble vitamin with hormonal functions, Vitamin D helps calcium and phosphorus homeostasis and bone metabolism.6 Calcium and vitamin D supplementation might affect metabolic profiles and oxidative stress through their effects on cell cycle regulation,7 activation of antioxidant enzymes8 and suppression of parathyroid hormone.9 Inappropriate diets and calories intake have been implicated in abnormal hematological parameters, poor glycemic control and profile in diabetics. A few recent studies have shown that supplementation with calcium10 and vitamin D11 might affect glycemic control in diabetic subjects however, the combined effects of calcium and vitamin D supplementation on glycemic profile, hemostatic and hematological indices have not been closely investigated in diabetic animal models. Some studies have reported the effects of single vitamin D supplementation on glycemic profiles while few reports have shown that joint supplementation is much more efficient in influencing glycemic profiles than single calcium or vitamin D supplementation.12 Calcium and vitamin D combination have been reported to improve pancreatic beta cell function in diabetic subjects.13 Thus, insufficient nutritional status might adversely affect the outcome of glycemic control. This study was therefore carried out to investigate the combined effects of fortified dietary calcium and vitamin D on the body weight, glycemic profile, biochemical parameters, hemostatic and hematological indices in diabetic rats in order to establish the correlation between combined dietary calcium and vitamin D consumption and glycemic control and also to assess the impact of such combination on weight and hematological parameters.
Materials and Methods
Experimental Animals and Diets
Thirty two male albino rats weighing 200-250g were purchased from the disease-free stock of the animal house of the Department of Biochemistry, Bowen University, Iwo, Osun state, Nigeria. The rats were kept in polypropylene plastic cages and maintained at normal and standard laboratory conditions of temperature (28 ± 2 oC) and relative humidity (46 ± 6%) with 12-hour light-dark cycle and adequate ventilation for two weeks to allow for acclimatization to their environment. The rats were weighed twice weekly to ensure that no rat outside the initial weight range of 200g-250g was used. The rats were initially fed with commercially available standard rat feed (Ladokun feeds Nig. Ltd.) purchased from a commercial branch depot and water ad libitum during the period of acclimatization and thereafter were grouped into four groups: two groups (n=8, each) containing diabetic rats and other two groups (n=8, each) containing healthy rats. One of the healthy and diabetic groups respectively were fed with normal diet as controls while the remaining groups were fed with calcium and vitamin D – fortified diet as experimental groups according to the experimental design for a period of 6 weeks. The weights of the rats were recorded for the six weeks period of the study prior to laboratory investigations. This study using experimental animals was conducted in accordance with the internationally accepted principles for laboratory animals.13
Induction of Diabetes
After 15 hour overnight fast, rats in two groups were injected intraperitoneally with freshly prepared alloxan monohydrate (Sigma chemicals, USA) dissolved in sterile normal saline at a dose of 100 mg/kg body weight. Diabetes was confirmed 4-7 days later by use of glucometer (On Call Plus Blood Glucose Monitoring System, ACON Laboratories, Inc. San Diego, USA.). Rats with Fasting Blood Glucose (FBG) level > 150mg/dl were considered diabetic and used for this study.
Test Diets
The normal and the calcium and vitamin D-fortified diets as shown in Table 1 constitute the test diets for this study. The normal diet served as the control diet while the calcium and vitamin D-fortified diet served as the treatment diet. Both were formulated by an animal science nutritionist in the department of Animal Science and Nutrition, Bowen University, Iwo, Osun State, Nigeria with the following feed compositions (% per 100g of feed):
Table 1: COMPOSITION OF TEST DIETS (g/100g of feed)
|
NUTRIENT COMPONENTS |
INGREDIENTS USED |
NORMAL (CONTROL) DIET
|
CALCIUM AND VIT. D-FORTIFIED DIET |
|
Carbohydrates |
Maize, wheat offal |
15 |
15 |
|
Fibres |
Rice thusk |
0.1 |
0.1 |
|
Fat and oil |
Soya bean, Palm kernel and groundnut cake |
25 |
25 |
|
Protein |
Fish meal |
50 |
46.55 |
|
Calcium |
Oyster shell, Bone meal |
4.0 |
7.0 |
|
Premix (Vitamins) |
Vitamins B, C, D |
0.45 |
0.9 |
|
Mineral salt |
Salt |
0.25 |
0.25 |
|
Amino acids |
Lysine, Methionine |
0.2 |
0.2 |
|
Water |
Water |
5 |
5 |
Experimental Design
The animals after 2 weeks acclimatization period and induction were randomly divided into 4 broad categories of 8 rats each:
GROUP A: Diabetic rats on calcium and vitamin D – fortified diet (DTD group)
GROUP B: Diabetic rats on normal diet (DCD group) – Diabetic control
GROUP C: Non-diabetic rats on calcium and vitamin D – fortified diet (NTD group)
GROUP D: Non-diabetic rats on normal diet (NCD group) – Normal control
Biochemical Assays
Fasting blood glucose (FBG) and oral glucose tolerance (OGTT) tests: The mean FBG level was taken at study baseline and 6 weeks after feeding for all groups by use of glucometer (On Call Plus Blood Glucose Monitoring System, ACON Laboratories, Inc. San Diego, USA.). The OGTT was conducted at the end of the 6 weeks of study. Animals in all groups after 15 hour overnight fast with free access to water were treated with an oral D‐glucose load of 2 gm kg‐1 (dissolved in distilled water) administered by means of cannula. Blood samples were withdrawn from the cordal (tail) vein of each animal (tail snipping) to determine the fasting blood sugar concentrations at time 0 minute (before ingestion of glucose) and subsequently at intervals of 30, 60, 90, 120 and 150 minutes after oral glucose administration.
Haematological Assays
After 6 weeks of feeding, rats were fasted overnight and thereafter weighed to determine their final body weights prior to collection of blood samples. To avoid variation due to circadian rhythm, all samples were collected in the morning hours between 7am and 9am. By conventional method,15 whole blood samples were collected via a slow puncture of the retro-orbital sinus with the tip of the microhaematocrit (70 ml heparinized microcapillary tubes haematocrit) inserted in the medial angle of the eye into tubes (vacutainer tubes; Becton Dickson, Franklin lakes NJ) containing EDTA (ethylene diamine tetra-acetic acid 8.5%) anticoagulant for hematological analysis. Hematological parameters analyzed include: white blood cell (WBC) and differential counts, packed cell volume (PCV), hemoglobin concentration (Hb), mean corpuscular hemoglobin (MCH), mean corpuscular volume (MCV), mean corpuscular hemoglobin concentration (MCHC), platelets count (PL), prothrombin time (PT) and activated partial thromboplastin time (APTT). All haematological parameters were analyzed in the Hematology Department of the University College Hospital (UCH) Ibadan, Oyo State, Nigeria using the automated method with hematology auto analyzer (SYSMEX KX21-N, JAPAN).
Statistical Analysis
Data was analyzed using appropriate statistical methods and program of Microsoft Excel and SPSS. Values are expressed as group mean ± SEM (Standard Error of Mean) while results were analyzed using Student’s t-test with one way ANOVA followed by Duncan’s multiple range tests. Significance level was set to P < 0.05.
Results
Body Weight
As shown in Table 2 below, the mean body weights of the rats in all groups were almost the same (~200 g) at the onset of the study while the final weights at the end of 6 weeks of feeding show some differences: NTD group (240.83±1.66g); NCD group (250.17±2.96g), DTD group (231.33±1.14g) and DCD group (237.33±1.23g). Mean weights of the experimental rats were significantly (p< 0.05) lower than that of their respective controls.
Table 2: Effects of normal and calcium-vit. D-fortified diets on body weights of experimental rats (n=8)
|
Experimental Animal Categories |
||||
| NCD | NTD | DTD | DCD | |
| Body Weight (g) | ||||
| Initial | 200.00±0.12a | 200.05±1.00a | 200.25±0.05a | 200.00±0.01a |
| Final | 250.17±2.96b | 240.83±1.66c | 231.33±1.14d | 237.33±1.23c |
| % increase | 25.1% | 20.4% | 15.5% | 18.7% |
Means with different superscript letters within the same row are significant at P value < .05. NTD = Normal rats on treatment diet; NCD = Normal rats on normal diet (normal control); DTD = Diabetic rats on treatment diet; DCD = Diabetic rats on normal diet (diabetic control).
Fasting Blood Glucose and Glycemic Tolerance
The effects of the test diets on the fasting blood glucose levels (FBG) taken at the onset of study and 6 weeks thereafter is depicted in Table 3 as shown below. A significant (p < 0.05) reduction (22.83%) in FBG level was observed in experimental diabetic rats (DTD) compared with the diabetic control (DCD) while no significant difference was observed between NTD and NCD groups. The postprandial glycemic response to calcium and Vitamin D-fortified diet during oral glucose challenge showed improved glycemic tolerance in both experimental rat groups over that of their respective controls with lower incremental areas under the glycemic response curves of DTD and NTD compared with that of DCD and NCD respectively. Controlled diet-fed rats displayed quicker and higher glycemic responses compared to slower and delayed glycemic responses observed in calcium-vit.D-fortified diet-fed rats. This observed positive impact of combined calcium and vitamin D on the glycemic profiles was more marked in the non-diabetic healthy rats compared with the diabetic rats. Figure 1 below shows the glycemic profiles of the experimental and control rats.
Table 3: Effects of normal and calcium-vit. D-fortified diets on fbg of experimental rats (n=8)
|
Experimental Animal Categories |
||||
| NTD | NCD | DTD | DCD | |
| Fasting Blood Glucose Concs. (mg/dL) | ||||
| 0 week | 90.00±1.00a | 85.50±0.10b | 150.36±0.05c | 152.40±1.20c |
| 6 weeks | 88.60±1.20a | 84.20±0.20b | 116.00±2.00d | 163.20±0.04e |
| % Change in FBG | 0.02% | 0.01% | 22.83% | 7.09% |
Means with different superscript letters within the same column are significant at P value < 0.05. NTD = Normal rats on treatment diet; NCD = Normal rats on normal diet (normal control); DTD = Diabetic rats on treatment diet; DCD = Diabetic rats on normal diet (diabetic control), FBG = Fasting blood glucose concentration
Haematological Parameters
Effects of the test diets on the haematological parameters were investigated and the results are shown in Table 4 below:
Packed Cell Volume (Hematocrit) and Haemoglobin Count
No significant difference in PCV and Hb count observed between the experimental rats and their respective controls (p > 0.05). Values of the hematocrit and hemoglobin concentrations are shown in Table 4 below.
Mean Corpuscular Hemoglobin (MCH), Mean Corpuscular Volume (MCV) and Mean Corpuscular Hemoglobin Concentration (MCHC)
No significant difference was observed in MCV, MCH and MCHC values (Table 4) obtained between the experimental rats and their controls (p > 0.05). Combined calcium and vitamin D-fortified diet had no significant effect on the above parameters in both healthy and diabetic rats.
Total White Cell and Differential Counts
Values of the WBC and the differential (neutrophils, eosinophils, basophils, lymphocytes and monocytes) counts are shown in Table 4. No significant difference observed in white cells hematological parameters between the experimental rats and their respective controls (p > 0.05).
Platelets count, Prothrobim Time (PT) and Activated Partial Thromboplastin Time (APTT)
The platelets count, prothrombin time and activated partial thromboplastin time were insignificantly (p > 0.05) different when compare between the experimental rats and their respective controls as shown In Table 4.
Table 4: Effects of test diets on haematological parameters of experimental and control rats fed (n = 8)
| Experimental Animal Categories | ||||
| Parameters | NTD | NCD | DTD | DCD |
| PCV (%) | 46.2±1.74 | 44.4±0.87 | 42.8±0.92 | 43.2±1.19 |
| Hb (g/dL) | 12.34±0.55 | 13.14±0.49 | 11.8±0.33 | 12.7±0.42 |
| MCV (fL) | 58.20±1.40 | 57.00±1,20 | 55.40±1.00 | 57..20±0.40 |
| MCH (pg) | 17.40±0.10 | 17.80±.008 | 16.80±1.20 | 16.40±0.02 |
| MCHC (g/dL) | 30.60±0.01 | 30.60±0.01 | 30.20±0.01 | 30.00±0.02 |
| WBC (x 109/L) | 10.64±0.11 | 11.34±0.24 | 10.62±0.08 | 10.32±0.42 |
| Neutrophils (%) | 32.40±0.04 | 33.20±0.12 | 31.80±0.24 | 33.60±1.28 |
| Eosinophils (%) | 1.40±0.00 | 1.20±0.01 | 1.00±0.02 | 1.60±0.01 |
| Basophils (%) | 0.00±0.00 | 0.00±0.00 | 0.00±0.00 | 0.00±0.00 |
| Lymphocytes (%) | 46.60±0.42 | 47.20±0.18 | 50.24±0.22 | 49.20±0.48 |
| Monocytes (%) | 9.60±0.80 | 9.40±0.02 | 9.00±0.02 | 10.60±0.18 |
| Platelets (x 109/L) | 641.20±2.44 | 644.60±1.86 | 672.80±1.20 | 670.40±2.26 |
| PT (sec.) | 11.60±0.02 | 10.60±0.01 | 12.00±0.04 | 11.40±0.16 |
| APTT (sec.) | 38.60±0.10 | 40.20±0.08 | 40.60±0.02 | 40.00±0.24 |
Values are expressed in mean ± SD. NTD = Normal rats on treatment diet; NCD = Normal rats on normal diet (normal control); DTD = Diabetic rats on treatment diet; DCD = Diabetic rats on normal diet (diabetic control).
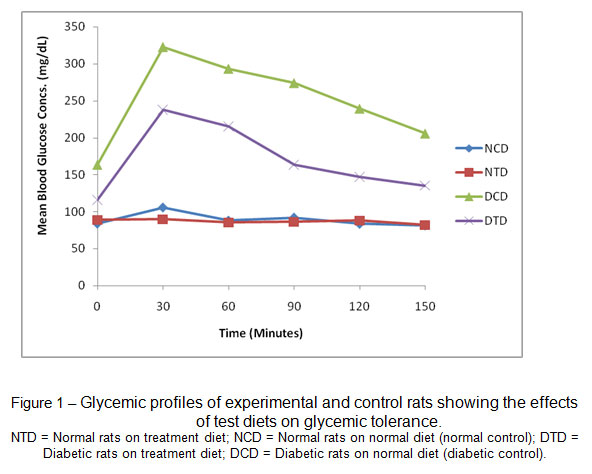 |
Figure 1: – Glycemic profiles of experimental and control rats showing the effects of test diets on glycemic tolerance. Click here to View figure |
Discussion
This study determined the combined effects of fortified dietary calcium and vitamin D on body weight, glycemic profile, biochemical parameters, hemostatic and hematological indices in diabetic rats. The findings obtained from the study revealed the beneficial hypoglycemic and weight reducing effects of calcium and vitamin D combination on glycemic control and profile in diabetic rats without adverse impact on the hematological parameters.
Consumption of calcium and vitamin D – fortified diet in this study significantly enhanced weight reduction in diabetic rats. At the end of 6 weeks of feeding, mean body weight of diabetic experimental rats was significantly reduced (p < 0.05) in the experimental rats compared with their respective controls. However, an increased weight gain was observed in rats fed with control diet. This observed effect on body weight agrees with the findings of few studies which suggested that combined calcium and vitamin D supplementation enhances weight reduction especially in obese individuals.16,17 while a diet low in calcium and vitamin D or their deficiency state predisposes to weight gain.18,19
Hypoglycemic effect of calcium and vitamin D on blood glucose level (Table 3) was investigated in this study which revealed a significant reduction in FBG level in experimental diabetic rats on treatment diet 6 weeks after feeding compared with the diabetic control with elevated blood glucose level. This finding agrees with the study of Asemi et al.,20 which reported a significant reduction in fasting plasma glucose following combined calcium and vitamin D supplementations in women with gestational diabetes. Beneficial effects of vitamin D supplementation on improved insulin action might result from its effect on calcium and phosphorus metabolism and through upregulation of the insulin receptor genes.21 Furthermore, vitamin D via the 1, 25-dihydroxyvitamin D3-mediated Ca2+ signaling pathway may be involved in the regulation of insulin secretion from the pancreatic beta cell.22 The beneficial hypoglycemic effect of combined calcium and vitamin D manifested in the observed improved glycemic profiles in the experimental rats following oral glucose challenge as depicted in Figure 1 above. Calcium and vitamin D – fortified diet caused improved glycemic tolerance in both experimental rat groups over that of their respective controls. However, the effect was more marked in the healthy experimental rats than the diabetic counterpart. This observational difference may be explained by the different glucose handling capacity in both experimental rats.
No significant difference observed in hematological and hemostatic indices between the experimental and the controlled rats. This finding comply with the results of other studies.23,24
In conclusion, Ca2+ and Vit.D-fortified diet reduced body weight with beneficial hypoglycemic and remarkable glycemic tolerant effects on glycemic control and profile without significant impact on hemostatic and hematological indices. This study therefore suggests the recommendation of combined calcium and vitamin D – fortified diets to diabetics and obese individuals to improve glycemic control and weight reduction.
Acknowledgements
We thank Alabi Femi of the department of Nutrition and Animal Science for assisting in the preparation of the test diets.
References
- Maxwell CS, Wood RJ: Update on vitamin D and type 2 diabetes. Nutr. Rev., 69(5):291-295 (2011)
CrossRef - Scragg R, Sowers MF and Bell C. Serum 25-hydroxyvitamin D, ethnicity, and blood pressure in the Third National Health and Nutrition Examination Survey. Am. J. Hypertens., 20(7):713-719 (2007)
CrossRef - Wang TJ, Pencina MJ, Booth SL, Jacques PF, Ingelsson E, Lanier K, et al. Vitamin D deficiency and risk of cardiovascular disease. Circulation, 117(4):503 (2008)
CrossRef - Holick MF. High prevalence of vitamin D inadequacy and implications for health. Mayo Clin. Proc., 81(3):353-373 (2006)
CrossRef - Holick MF. Vitamin D deficiency. N. Engl. J. Med., 357(3):266-281(2007)
CrossRef - Heaney RP. Functional indices of vitamin D status and ramifications of vitamin D deficiency. Am. J. Clin. Nutr., 80(6):1706 (2004)
- Nair-Shalliker V, Armstrong BK and Fenech M. Does vitamin D protect against DNA damage? Mutat Res., 733:50–57 (2012)
CrossRef - Kallay E, Bareis P, Bajna E et al. Vitamin D receptor activity and prevention of colonic hyperproliferation and oxidative stress. Food Chem. Toxicol., 40:1191–1196 (2002)
CrossRef - Zemel MB. Regulation of adiposity and obesity risk by dietary calcium:mechanisms and implications. J Am Coll Nutr, 21:146S–151S (2002)
CrossRef - Park HJ, Lee J, Kim JM, Lee HA, Kim SH and Kim Y. A study of snack consumption, night-eating habits, and nutrient intake in gestational diabetes mellitus. Clin Nutr. Res., 2:42–51(2013)
CrossRef - Jelsma JG, Van Poppel MN, Galjaard S et al. DALI: Vitamin D and lifestyle intervention for gestational diabetes mellitus (GDM) prevention: An European multicentre, randomised trial – study protocol. BMC Pregnancy Childbirth., 13:142 (2013)
CrossRef - Asemi Z, Hashemi T, Karamali M, Samimi M, Esmaillzadeh A. Effects of vitamin D supplementation on glucose metabolism, lipid concentrations, inflammation, and oxidative stress in gestational diabetes: a double-blind randomized controlled clinical trial. Am. J. Clin. Nutr., 98:1425–1432 (2013)
CrossRef - Harinarayan CV, Arvind S, Joshi S, Thennarasu K, Vedavyas V, Baindur A. Improvement in pancreatic beta cell function with vitamin D and calcium supplementation in vitamin D deficient nondiabetic subjects. Endocr. Pract. 2013; doi: 10.4158/EP13273.
- National Institutes of Health. The guide for the care and use of laboratory animals. NIH. Publication., No. 85-23 (1985)
- Boussarie D., Hématologie des Rongeurs et al. Lagomorphes de Compagnie, Bull. Acad. Vét., 72, 209-216 (1999)
- Major G.C Alarie F, Doré J, Phouttama S, Tremblay A. Supplementation with calcium + vitamin D enhances the beneficial effect of weight loss on plasma lipid and lipoprotein concentrations. Am. J. Clin. Nutr., 85(1):54-9 (2007)
- Zhu W, Cai D, Wang Y et al. Calcium plus vitamin D3 supplementation facilitated fat loss in overweight and obese college students with very-low calcium consumption: a randomized controlled trial. Nutr. Journal., 12:8 (2013)
CrossRef - Holick MF. The vitamin D epidemic and its health consequences. The Journal of Nutrition., 135 (11): 2739S–48S (2005)
CrossRef - Holick MF. Vitamin D Deficiency. New England Journal of Medicine., 357 (3): 266–81(2007)
- Asemi Z, Karamali M, Esmaillzadeh A. Effects of calcium–vitamin D co-supplementation on glycaemic control, inflammation and oxidative stress in gestational diabetes: a randomised placebo-controlled trial. Diabetologia croatica., 57(9):1746-8 (2014)
CrossRef - Maestro B, Molero S, Bajo S, Davila N, Calle C. Transcriptional activation of the human insulin receptor gene by 1,25-dihydroxyvitamin D(3). Cell Biochem Funct., 20:227–232 (2000)
CrossRef - Sergeev I.N, Rhoten WB. 1, 25-Dihydroxyvitamin D3 evokes oscillations of intracellular calcium in a pancreatic beta-cell line. Endocrinology., 136:2852–2861 (1995)
CrossRef - Soliman A.T, Eldabbagh M, Elawwa A, Saleem W. Does Vitamin D therapy affect hematological indices in adolescents with vitamin D deficiency? Indian J. Endocrinol .Metab., 16(4): 659–660 (2012)
CrossRef - Witham M.D, Nadir M.A, Struthers A.D. Effect of vitamin D on blood pressure: A systematic review and meta-analysis. J. Hypertens., 27: 1948–54 (2009)
CrossRef.


Web of Science Coverage
Emerging Sources Citation Index (ESCI)
2024 Journal Impact Factor: 1.1
Scopus Journal Metrics
CiteScore 2025: 2.6
CiteScore Details
Sustainable Nutrition: Food Systems, Nutrient Retention, and Public Health Impact
![]()
This journal is a member of, and subscribes to the principles of, the Committee on Publication Ethics (COPE)


