Introduction
Wild plants play very significant roles in the diet of people in the developing world (Okello, 2010); wild plants as a food is in the increase because most developing countries continue to suffer from drought and other weather related calamities, which tend to decrease the yield of their traditional grain staples, such as millet, maize and sorghum (Glew et al., 1997). Wild food plants are particularly most important during periods of food scarcity (Aline et al., 2008). A report by NRC (2008) indicated that wild fruits are useful for adding culinary variety, flavour, nutrient and energy to the diet.
Tamarind (Tamarindus indica) is grown throughout the tropics as an ornamental tree and an important legume (Bhattacharya et al., 1994). Tamarind is indigenous to tropical Africa but it has been introduced and spread worldwide in over 50 countries (Okello, 2010). The major production areas are in the Asian countries, India and Thailand, but also in Bangladesh, Sri Lanka and Indonesia (Okello, 2010). In America, Mexico and Costa Rica are the biggest producers (De Caluwe et al., 2009). Africa on the whole does not produce tamarind on a commercial scale, though it is widely used by the local people. Minor producing countries in Africa are Senegal, Gambia, Kenya, Tanzania, and Zambia (El-siddig et al., 2006). It is widely distributed in Nigeria across different ecological zones (Keay and Onochie, 1964).
In Arabic, it is called Tami Hindi; in Ghana, it is called dawadawa, in Malawi it is called bwemba, in Zambia (Nyanja) it is called viwawasha, in the Kiswahili language of east and central Africa, it is called kwaju while its common names in Nigeria include tsamiya (Hausa), jetami (Fulani), ajagbon (Yoruba), ichekun oyibo (Igbo), tamsugu (Kanuri) and the nupes calls it darachi (Keay et al., 1989). It thrives in practically all soil types and could be found virtually everywhere growing wild. According to NRC (2008), the adaptability of T.indica to various climatic zones and environmental condition is the key factor contributing to its importance in the tropics.
The fruit of T. indica are bean like irregular curved pods; the pods contain 1-10 seeds which are irregular shaped, flattened or rhomboid. The seeds are very hard, shinny, reddish or purplish brown. The pods also contain a green, highly acidic pulp that turns brown as they mature. The fruit pulp is most acidic and has an uncommon plant acid, tartaric acid. The seeds are good source of protein, crude fibre and carbohydrate. The mineral concentrations are high especially those of magnesium (Ajayi et al., 2006). The presence of tannin, phytic acid, hydrogen cyanide, trypsin inhibitor activity and phytohaemaglutinations activity in the seed testa makes the whole seed unsuitable for consumption. The testa which produces some side effect such as depression, constipation and gastro intestinal disorder has to be removed by soaking or boiling in water and roasting (El-siddig et al., 2006).
The pulp of the fruit can be eaten fresh or used in the preparation of beverage and to flavour confections, curries, sauces (Siddhuraju et al., 1995a). In northern Nigeria, the T. indica is used as spice for “Kunun Gyada” a recipe that some people use to break their fast. The sour taste makes Kunun Gyada very tasty (Victoria, 2012). The seeds are used as feed for cattle and pigs, as a valuable remedy in diarhoea and dysentery, as a base in cosmetics, in pharmaceutical industry as a curative against rheumatism and as a soil stabilizer (Pugalenthi et al., 2004).
The ever increasing commercial potential of tamarind products has sparked a keen interest in selected varieties of the tree. T. indicia are generally diverse as reflected primarily in the variability of its fruit in terms of size and taste (Schabel, 2004). Tamarind with its numerous uses, long lasting nature and abundance, add it to the long list of Nigeria endowment, still hiding in plain sight. Hence, the objectives of this work are:
- To determine the proximate, mineral and anti- nutritient composition of tamarind (Tamarindus indicia) seed nut.
- To identify the best processing treatment that will give the product the most acceptable characteristics.
The success of this research work will provide information on nutritional composition of this underutilized crop; which will be a step forward in the industrial production of tamarind (Tamarindus indicia) seed nut flour as a component in food formulations; thus, preventing the crop from going into extinction.
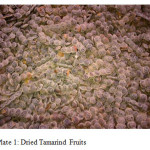 |
Plate 1: Dried Tamarind Fruits Click here to View plate |
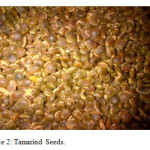 |
Plate 2: Tamarind Seeds. Click here to View plate |
Materials and Methods
The Tamarind (Tamarindus indica) seed nuts used were purchased from Boode market in Ibadan, Oyo State. The equipment and chemicals used in this work were obtained from the laboratory of the Department of Food Science and Technology, Federal University of Technology Owerri, Nigeria and New Concept Laboratory, Obinze in Imo State, Nigeria.
Sample preparation
Tamarind seeds were sorted to remove dirt and the bad seeds; weighed and divided into two portions. Different processing treatment was adopted for each. The treatments were soaking and roasting.
Soaking
500 g of tamarind seeds was soaked for 14 days to facilitate easy removal of the seed coats. The seed kernels were then dried and milled into flour using attrition mill. The milled flour was sundried for 72h and was sifted through a 1mm mesh size sieve and packaged in an air tight container.
Roasting
500 g of tamarind seeds was roasted in an open pan at a temperature of 100oC for 15min and dehulled. The roasted seeds were milled into flour using attrition mill and was oven dried at a temperature of 60oC and further dried under the sun. The sample was sieved to obtain fine flour and packaged in an air tight container for further analysis.
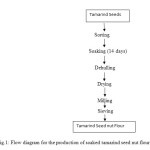 |
Figure 1: Flow diagram for the production of soaked tamarind seed nut flour. Click here to View figure |
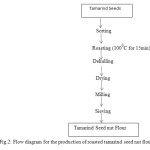 |
Figure 2: Flow diagram for the production of roasted tamarind seed nut flour. Click here to View figure |
Proximate Analysis of Tamarind Seed Nut Flour
The proximate analysis was determined using the Association of Official Analytical Chemist procedures (A.O.A.C., 2000) for fat, Ash, crude protein, moisture and crude fibre. Carbohydrate content was determined by difference; thus the sum of measured moisture (% M.C); ash (% wash); protein (%N); crude fiber (%C.F) and fat (%F) deducted from 100 (i.e. 100 – %M.C + %A+%N + %C.F + %F).
Determination of Mineral Contents of Tamarind Seed Nuts
The dry ash obtained by dry ash method was used to measure Ca, Mg, K, Fe, Mn, Cd, Cr, p and Zn. The ash after cooling was digested with 100 ml 0.5 m HCL on a hot plate until the volume reduced to about 10 – 15 ml. It was then filtered using Whatman No 1 filter paper and the volume of the filtrate was made up to the 100 ml mark. The filtrate was transferred into a polythene bottle for analysis using H 183200 multi parameter Bench Photometer.
Determination of Anti-Nutrients in Tamarind Seed Nut
Tannin Determination by Titration
The Follin Dennis titration method as described by Pearson (1976) was used. 20g of the processed sample in a cornical flask was added with 100ml of petroleum ether and covered for 24 h. The sample was then filtered and the filtrate was allowed to stand for 15min allowing petroleum ether to evaporate. It was then re-extracted by soaking in 100ml of 10% acetic acid in ethanol for 4h. The sample was then filtered and the filtrate was collected. 25 ml of NH4OH was added to the filtrate to precipitate the alkaloid. The alkaloid was heated with hot plate to remove some of the NH4OH still in solution. The remaining volume was measured to be 3 ml. 5 ml of this was taken and 20 ml of ethanol was added to it. It was titrated with 0.1M NaOH using phenolphthalein as indicator until pink end point was reached. Tannin content was then calculated in % (C1V1=C2V2) Molarity.
Calculation
C1– concentration of tannin acid
C2– concentration of the base = 0.1
V1– volume of the tannin = 5ml
V2– volume of the base = titer
Therefore C1 =C2V2

Determination of Hydrogen Cyanide Content
1g of each of the samples was homogenized in 25ml water with 3- 4 drops of Chloroform. The homogenate was placed in 500ml conical flask, saturated filter paper was placed in the hanging position with the help of a cork stopper inside the conical flask and was allowed to incubate at room temperature (20oC) for 20 – 24 h. The sodium picrate present in the filter paper was reduced to reddish compound in proportion to the amount of hydrocyanic acid evolved. The colour was eluded by placing the paper in a clean test tube containing 10ml distilled water and was compared with standards at 625 nm. Preparation of the standard curve was done by placing 5ml of the alkaline picrate solution and 5 ml of potassium cyanide solution in a test tube. The mixture was heated for 5 min in boiling water and the KCN alkaline picrate was delivered in the following volume into six test tubes 0.1, 0.2, 0.4, 0.6, 0.8 and 1.0 ml by adding distilled water press stopper to the tubes which was kept in a cool place. Measurement of the absorbance at 625nm was done. The amount of hydrogen cyanide in the above test tube was equal to 5, 10, 20, 30, 40 and 50 mg respectively. The hydrogen cyanide content was calculated from the standard graph.
Determination of Trypsin Inhibitor
1g of each of the sample was weighed and 50ml of NaOH was measured. The sample was dissolved in the 50ml of 0.5 m NaOH solution in the conical flask. The mixture was stirred for 30 min and then centrifuged at 3,600 rpm. 2ml of the standard trypsin was filtered and 10ml of aliquot was added into the test tube which was allowed to stand for 5 min. The aliquot was then measured in a spectrophotometer at 410 nm. The blank analysis was also done simultaneously. One trypsin unit inhibitor is equal to an increase of 0.01 absorbance unit from the blank.
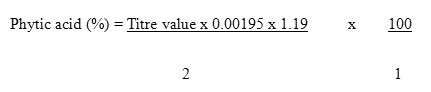
Determination of Phytate
Phytate content was determined using the method of A.O.A.C. (1990). 0.2g of each of the different processed sample was weighed into different 250ml conical flask. Each sample was soaked in 100ml of 2% concentrated HCL for 3h. The sample was then filtered. 500 ml of each of filtrate was placed in 250 ml beaker and 100 ml distilled water was added to each sample. 10 ml of 0.3% Ammonium thiocyanate solution was added as indicator and titrated with standard Iron (iii) Chloride solution which contained 0.00195 g Iron per ml. The percentage phytic acid was calculated by the formular.
Determination of Alkaloids
5 g of the sample was weighed into 250 ml beaker and 200 ml of 20% acetic acid in ethanol was added and covered and allowed to stand for 4 h at 25oC. This was filtered with paper no 42 and the filtrate was concentrated using a water bath to one quarter of the original volume. Concentrated ammonium hydroxide was added drop wise to the extract until the precipitate was collected and washed with dilute NH4OH (1% Ammonia solution); then filtered with pre-weighed filter paper. The residue on the filter paper is the alkaloid which was dried in the oven (precision Electro thermal model BMP9052 England) at 80oC. The alkaloid content was calculated and expressed as percentage of the sample analysed.
Calculation

Determination of Saponin
5 g of the sample was put in 20% acetic acid ethanol and allowed to stand in a water bath at 50oC for 24 h. This was filtered and the extract was concentrated using a water bath to one quarter of the original volume. Concentrated ammonium hydroxide (NH4OH) was added drop wise to the extract until the precipitate was complete. The whole solution was allowed to settle and the precipitate was collected by filtration and weighed. The saponin content was weighed and calculated in percentage.

The data obtained were analysed using analysis of variance (ANOVA); where the variance ratio was found significant. The LSD was used to separate the means. Significant difference was considered at p<0.05.
Result and Discussion
Proximate Composition of Tamarind Seed Nut
The results of proximate composition of roasted and soaked samples are shown in Table 1.
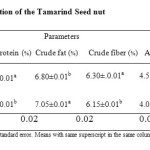 |
Table 1: Proximate Composition of the Tamarind Seed nut |
Key
RTS – Roasted Tamarind Seednut
STS – Soaked Tamarind Seednut
Moisture Content
The values from table 1 for moisture content of the samples ranged from 8.0% – 10.5%. Sample STS had the highest value (10.5%) and sample RTS having the least value (8.0%) significant difference (p<0.05) existed between the sample. This variation in the moisture content could be due to the variation in processing treatments.
Protein Content
Table 1 showed that the protein content of the samples ranged from 22.57%- 22.16%. Sample STS had the least value (22.16%) while sample RTS have the highest value (22.57%). There was significant (p<0.05) difference between the two samples. The crude protein values obtained were within the ranged of (20 – 37%) reported by Glew et al., (1997) for indigenous plants of Burkina Faso. Also the values were higher than the protein content of wheat flour (13.4%) as reported by Nwosu (2013) and thus can be used as a component in baking flours. The protein content of the tamarind seednut has nutritional significance, and as such intake of the seeds will greatly increase the total dietary intake of consumers.
Crude Fat Content
In table 1, the values of the fat content of the samples ranged from 6.8% –7.05%, with sample STS having the highest value (7.05%) while sample RTS had the least value (6.8%). Significant difference (p<0.05) existed between the two samples. The fat content of the samples were found to be in correspondence with an earlier report on the same specie (Siddhuraju et al., 1995). However, these values were lower than the range of (22.8 – 23.5%) reported in soya beans (Salunkhe et al., 1985) and 75mg/g for T.indica seeds reported in (Glew et al., 1997).
Crude Fibre Content
From table 1, crude fibre content ranged from 6.15% – 6.3%. Sample STS had the least crude fibre content (6.15%) while the sample RTS had the highest crude fibre content (6.30%). There was significant difference (p<0.05) between the two samples. The values for crude fibre content were lower than an earlier report on the same species (Siddhuraju et al., (1995), Lockett et al. (2000), and Ajayi et al., 2006). This variation in crude fibre percentage could be influenced by environmental factors. Fibre is an important part of diet, which decreases serum cholesterol levels, risk of coronary heart disease, hypertension, diabetics, colon and breast cancer (Ishola et al., 1990). However, the values for the fibre content are below the RDA for fibre in children and lactating mothers, which are 19 – 25% and 29% respectively (Ishola et al., 1990).
Ash Content
Table 1 showed that the ash contents of the samples ranged from 4.05% – 4.55%. Sample STS had the least ash content (4.05%), while sample RTS had the highest ash content (4.55%) and differed (p<0.05) significantly from samples STS. The reduction of the ash content in the sample STS could be due to leaching of both minor and major elements during soaking treatment (Vijayakumari et al., 2007). However the values obtained for ash were within the range of 3.2 – 4.6g/100g reported in Nigeria underutilized legumes flour (Aremu et al., 2001).
Carbohydrate Content
The total carbohydrate contents of the samples ranged from 56.24% – 58.08% in table 1. Sample STS had the least carbohydrate content (56.24%) while sample RTS had the highest carbohydrate content (58.08%). Significant (p<0.05) differences existed between the samples. The carbohydrate values obtained were found to be higher than that of some earlier investigation of wild pulses like Afzelia africana (Madubuike et al., 1994). However these values are much lower than carbohydrates value of 87.62 0.04 in G. africanum seeds (Ekpo 2007). The carbohydrates were also closely related to an earlier report on the same species (Siddhuraju et al., 1995; Lockett et al., 2000).
Mineral Composition of Tamarind Seed Nuts
The results of mineral composition of roasted and soaked samples are shown in Table 2.
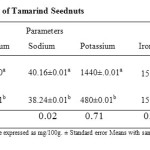 |
Table 2: Mineral Composition of Tamarind Seednuts Click here to View table |
Key
RTS – Roasted Tamarind Seednut
STS – Soaked Tamarind Seednut
ND – Not Detected.
Magnesium Content
In table 2, the magnesium content ranged from 220% – 268%. Sample RTS had the highest value (268%) than sample STS (220%). There was significant (p<0.05) difference between the two samples. The magnesium content of both samples were higher that of an earlier report on the same species (Siddhuraju et al., 1995).
Sodium Content
The result in table 2 showed that the sodium content ranged from 38.24% – 40.16 with sample RTS having the highest sodium content (40.16%), while sample STS had the least sodium content (38.24%). Significant difference (p<0.05) existed between the two samples. The sodium content obtained from both treatments seems to be higher when compared to an earlier report in the same species (Ishola et al., 1990; Siddhuraju et al., 1995) but when compared to Recommended Dietary Allowance (RDA) of NRC/NAS (1980) both sample were deficient in sodium content.
Potassium Content
From table 2, potassium was the highest mineral element in both samples. Sample STS had the least potassium content (480%) while sample RTS had the highest potassium content (1440%). There was significant (p<0.05) difference between the two samples. An earlier report on all the minerals by studied by Siddhuraju et al., 1995; Ajayi et al., (2006), K is the highest element with the highest concentration. The high concentration of potassium is nutritionally significant considering the fact that potassium plays a principal role in neuro- muscular function (Ajayi et al., 2006). T. indica seednut is found to contain more than adequate level of potassium compared to RDA of NRC/NAS (1980).
Iron Content
The results of the iron content in table 2, showed that the iron content ranged from 15.28% – 15.55% with sample STS having the highest content (15.55%), while sample RTS had the least iron content (15.28%). Significant difference (p<0.05) existed between the two samples. Iron is an important trace element for hemoglobin formation, normal functioning of the central nervous system and in the oxidation of carbohydrate, protein and fats (Adeyeye and Otoki, 1999). The iron content seems to be higher than an earlier report by Siddhuraju et al., 1995; Glew et al., 1997 but lower when compared to that obtained by (Ajayi et al., 2006).
Phosphorus
The phosphorus content of the sample ranged from (94.40% – 99.20%) in table 2. sample STS had the highest phosphorus content (99.40%), while the sample RTS has the least phosphorus (94.4%) and differed (p<0.05) significantly from sample STS. The phosphorus content appears to be higher than that of an earlier report (Ishola et al., 1990) but lower when compared to report by Sidduraju et al., 1995. The phosphorus content is deficient according to RDA of infant NRC/NAS 1980.
Antinutrient Composition of Tamarind Seed Nuts
The results of anti-nutritional composition of roasted and soaked samples are shown in Table 3.
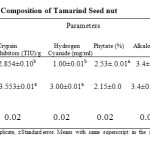 |
Table 3: Anti-nutrient Composition of Tamarind Seed nut Click here to View table |
Key
RTS – Roasted Tamarind Seednut
STS – Soaked Tamarind Seednut
Tannin Content
The tannin content in table 3 ranged 4.84% – 8.34%. Sample STS had the least tannin content (4.84%) while sample RTS had the highest tannin content (8.34%). Significant (P < 0.05) difference existed between the two samples. The lower content of tannin in sample STS can be attributed to the fact that tannin are water soluble compounds which makes them easy to be eliminated by soaking (Siddhuraju et al., 1995).
Trypsin Content
The results of the trypsin content in table 3 showed that the trypsin content ranged from 2.854% – 3.553% with sample STS having the highest content (3.553%), while sample RTS had the least trypsin content (2.854%). There was significant (p<0.05) difference between the two samples. The reduction in trypsin content might be attributed to the heat operation since cooking as a means of processing also helps to reduce 98% trypsin inhibitor activity.
Hydrogen Cyanide Content
The hydrogen cyanide contents of the samples ranged from 1.0% – 3.0% in table 3, Sample RTS had the least hydrogen cyanide content (1.0%) while sample STS had the highest hydrogen cyanide content (3.0%). Significant (P < 0.05) difference existed between the two samples. The reduction in the cyanogen content in sample RTS can be attributed to the heat operation which has been reported to reduce cyanogen’s content significantly (Siddhuraju et al., 1995).
Phytate Content: Table 3 showed that the phytate content of the samples ranged from 2.15% – 2.53%. Sample STS had the least phytate content value (2.15%) while the sample RTS has the highest phytate content (2.53%). There was significant (p<0.05) difference between the two samples. The reduction in phytate acid content for sample STS can be attributed to the soaking operation which have been reported to decrease its content (Siddhuraju et al., 1995).
Alkaloid Content
The results of the alkaloid content in table 3, showed that the alkaloid content of both sample STS and RTS were 3.4% each. There was no significant (P>0.05) difference between the two samples as both means share the same superscript. The presence of alkaloid in the seeds of tamarind is of interest. This is because alkaloids have dual functions. At high concentration most alkaloids are toxic, while having pharmacological effect at low concentration. Seed alkaloids, like colchines and vinca are capable of inhibiting mitotic cell division; phagocytosis and can encourage lymphotoxic activities that are dangerous to health at low concentration (Higuchi and Hassan, 1973). Knowledge about alkaloid content in tamarind seednut is limited and thus should be encourage for phytochemical analysis.
Saponin Content
In table 3, the values of the saponin content of the samples ranged from 1.0% – 0.8%, with sample STS having the least value (0.8%) while sample RTS had the highest value (1.0%). Significant difference (p<0.05) existed between the two samples. T indica seednut contain saponin in small quantity, however these can pose a little danger. Although research on saponin from other legume has a long history; considerably additional research must be carried out on the saponin content of tamarind seed nut.
Conclusion
The result indicated that Tamarind seed nut has good nutritional profile with high level of protein, lipid and other nutrients comparable with that of other common legume grains and can be incorporated into wheat flour as composite flour in bread production. Among the processing methods employed, roasting was observed to be more effective in reducing various anti-nutritional components of T. indica without affecting the nutritional quality. The utilization of Tamarind seed nut as a protein ingredient in food will help reduce the over dependence on conventional protein supplements notably soybean and other common legumes.
Acknowledgements
We are most grateful to the management of Department of Food Science and Technology, Federal University of Technology Owerri, Nigeria and New Concept Laboratory, Obinze in Imo State, Nigeria for availing us the opportunity to use their laboratories and equipment in the course of carrying out the analysis.
References
- Okello, J. (2010). Morphological and nutritional characteristics of Tamarindus indica (Linn) fruits in Uganda. http://hdl.handle.net/10570/2157. pp. 4-16.
- Glew, R.H., VanderJagt, D.J., Lockett, C., Grivetti, L.E., Smith, G.C., Pastuszyn, A., and Millson, M. (1997). Amino Acid, Fatty Acid, and Mineral Composition of 24 Indigenous Plants of Burkina Faso. Journal of Food Composition and Analysis, 10, 205-217.
CrossRef - Aline L.M; Lamien C.E; Compaoré; M.M.Y; Meda; R.N.T.; Kiendrebeogo; M; Jeanne; B.Z; Millogo F., and Nacoulma O.G; (2008). Polyphenol Content and Antioxidant Activity of Fourteen Wild Edible Fruits from Burkina Faso. Molecules 13, pp581-594
CrossRef - NRC, (2008). National Research Council. Lost Crops of Africa: Volume III: Fruits, pp380.
- Bhattacharya, S.; Bal, S.; Mukherjee, R. K.; and Suvendu, B; (1994). Functional and nutritional properties of tamarind (Tamarindus indica) kernel protein, Food chemistry, 49 (1):1-9
CrossRef - De Caluwe E; Halamova K; and Van D.P (2009). Tamarindus indica L. A review of traditional used, photochemistry and pharmacology in: Julian, H.R, Simon J.E, Hoc, editors. African natural plant products, Washington: American Chemical Society. Pp. 85 – 100
- El-Siddig, K., Gunasena, H.P.M., Prasa, B.A., Pushpakumara, D.K.N.G., Ramana, K.V.R., Vijayanand. P., Williams, J.T. (2006). Tamarind – Tamarindus indica L. Fruits for the future 1. Southampton Centre for Underutilized Crops, Southampton, UK, pp.188.
- Keay, R. W. & Onochie, C. F. A. (1964). Nigerian Trees, vol. II, Nigerian National Press Limited, Ibadan, Nigeria. Pp.111.
- Ajayi; I.A., Oderinde; R.A., Kajogbola, D.O., and Uponi, J.I. (2006). Oil content and fatty acid composition of some underutilized legumes from Nigeria. Food Chemistry, 99, 115-120.
CrossRef - Siddhuraju, P., Vijayakumari, K., Janardhanan, K. (1995). Nutritional and Antinutritional Properties of the Underexploited Legumes Cassia laevigata Wild and Tamarindus Indica L. Journal of Food Composition and Analysis, 8, 351-362.
CrossRef - Victoria A; (2012). Nigeria tamarind a priceless jewel in your backyard. (http://www.allaftrica.com/stories/201208110362.html/ Retrieved 18th may, 2014.
- Pugalenthi, M., Vadivel, V., Gurumoorthi, P. and Janardhanan, K. (2004). Comparative nutritional evaluation of little known legumes, Tamarindus indica, Erythrina indica and Sesbania bispinosa. Tropical and Subtropical Agroecosystems, (4): 107 – 123.
- Schabel, G.H., (2004). T. indica L., Species Descriptions. College of Natural Resources, University of Wisconsin, Stevens Point, WI.
- A.O.A.C. (2000). “Official method of Analysis”15th edition, Association of official Analytical Chemists, Washington DC.
- Pearson, D. (1976). The Chemical Analysis of Food. (17th edition). Churchill Living Stone Edumburgh. Pp. 94 – 126.
- Nwosu, J.N. (2013). Production and evaluation of biscuits from blends of Bambara Groundnut (Vigna Subterranae) and Wheat (Triticum Eastrum) flours. International Journal of Food and Nutrition Science. 2(1): 4-9.
- A.O.A.C. (1990). “Official method of Analysis”15th edition, Association of official Analytical Chemists, Washington DC.
- Salunkhe, D.K.; Kadon, S.S. & Charan, J.K. ( 1985). Postharvest Biotechnology of food legumes. Bocaranton, F. L. CRC press.
- Lockett, C.T., Calvert C.C., and Grivetti, L.E. (2000). Energy and micronutrient composition of dietary and medicinal wild plants consumed during drough. Study of rural Fulani, Northeastern Nigeria. International Journal of Food Sciences and Nutrition, 51, 195-208.
CrossRef - Ishola, M.M., Agabaji, E.B and Agbaji, A.S (1990). A Chemical Study of Tamarindus Indica (Tsamiya) Fruits Grown in Nigeria. Journal of Science Food and Agriculture, 51: 141-143
CrossRef - Vijayakumari K, Pigalenthi M and Vadivel V (2007). Effect of soaking and hydrothermal processing methods on levels of antinutrients and in vitro protein digestibility of Bauchinia purpera L. seeds. Food Chem, 103: 968
CrossRef - Aremu, M.O., Olaofe, O. and Akintayo, T. E. ( 2006). A Comparative study on the chemical and amino acid composition of some Nigerian under-utilized legume flours. Pakistan Journal of Nutritio. 5 (1): 34-38
CrossRef - Madubuike, FN, Ojimelukwe, PC. and Ajah, PO. (1994). Proximate composition, energy content and physiochemical properties of Afzelia africana and Brachystegia eurycoma seeds. Plant Foods for Human Nutrition 46: 339 – 344.
CrossRef - Ekpo, A.S. ( 2007). Determination of Chemical Composition of Gnetum africanum (Afang) seeds, Pakistan Journal of Nutrition 6 (1): 37-40.
- Adeyeye; E.I and Otokiti; M.K.O (1999). Proximate composition of some nutritionally valuable minerals of two varieties of Capsicum annun. (Bell and Cherry peppers). Discovery and innovation, 11: 75 – 81
- NRC/NAS, (1980). National Research Council Committee on Dietary Allowances. Recommended Dietary Allowances. 9th edn. National Academy of Science Press, Washington, DC, USA.
- Higuchi; T. and Hassan; B. (1973). Pharmaceutical analysis. Litton educational Publication Inc, New York, pp: 100 – 116.

This work is licensed under a Creative Commons Attribution 4.0 International License.


