Anthropometric Measurements, Dietary Intake and Lipid Profile of Hypertensive Young Adults (25-35 Years): A Comparison Between Vegetarians and Non Vegetarians
Post Graduate Teaching Department of Home Science, Rashtrasant Tukadoji Maharaj Nagpur University, Mahatma Jyotiba Phule Educational Campus, Amravati Road, Nagpur.
DOI : http://dx.doi.org/10.12944/CRNFSJ.2.3.03
Download this article as:
![]()
Increasing prevalence of hypertension is a major health concern.Dietary habits and food choices play an important role in maintaining lipid levels.The aim of this study was to investigate the impact of dietary habits on lipid profile of young adult hypertensive males. Two hundred vegetarians (V) and two hundred non vegetarians (NV) stage I hypertensive young adult men from age group 25-35 yrs. Anthropometric indices like weight, height, waist circumference (WC), hip circumference (HC) and mid-upper-arm circumference (MUAC) were measured. Body mass index (BMI) and waist hip ratio (WHR) were computed using standard equations. 24 hour’s food intake data for each subject was collected for consecutive 3 days and energy and energy yielding nutrients were computed. Total cholesterol (T-C), low density lipoprotein cholesterol (LDL-C), high density lipoprotein cholesterol (HDL-C) and triglyceride (TG) levels were estimated. Very low density lipoprotein cholesterol (VLDL-C) was computed using standard equation.Insignificant difference was noticed between V and NV for BMI, WC and HC. In contrast, MUAC of NV was found to be significantly higher than V. NV had higher mean daily intake of energy, protein and fat but low mean daily consumption of carbohydrate as compared to V.NV had higher mean values of systolic blood pressure (SBP) (p>0.05) and diastolic blood pressure (DBP) (0.01<p<0.05) than V. 30% NV were obese grade II. TC and LDL-C of NV were greater than V but HDL-C and TG of V were greater than NV (p>0.05). TC, LDL-C and VLDL-C among NV correlated positively (p<0.01) with body weight (r 0.5340, 0.4841 and 0.5921, respectively). Stronger relationships existed between HDL-C and body weight among both groups. BP, BMI and MUAC were more among NV than V. V showed better lipid profile than NV. This could be attributed to higher intake of energy and fat among NV.
KEYWORDS:hypertensive adults; anthropometric measurements; lipid profile; dietary intake
Introduction
Hypertension is a common public health problem in developing countries. Untreated hypertension leads to many degenerative diseases, including congestive heart failure, end stage renal disease and peripheral vascular disease.1 It is often called a “silent killer”. Hypertension is an increasingly important medical and public health issue.
Cardiovascular diseases are major causes of mortality in the Indian subcontinent, causing more than 25% of deaths.2 It has been predicted that these diseases will increase rapidly in India and this country will be host to more than half the cases of heart disease in the world within the next 15 years.2 Prevalence of hypertension is increasing day by day in Indian population especially among middle and high socioeconomic groups.3-9 Use of tobacco, obesity with high WHR, high BP, high LDL-C, low HDL-C, low consumption of fruits and vegetables, sedentary lifestyles and psychosocial stress are important determinants of cardiovascular diseases in India. These risk factors have increased substantially over the past 50 years and to control further escalation, it is important to prevent them.9 Elevated BP is a major modifiable risk factor for cardiovascular disease (CVD) and the leading cause of preventable deaths worldwide. One-quarter of the world’s adult population has hypertension, and this is likely to increase to 29 % by 2025. The absolute prevalence of hypertension in economically developed nations is 37.3% compared with 22.9% in developing nations.10
There are indications of an epidemic rise in cerebrovascular diseases in the developing world. This could be because of nutritional transition occurring in the developing world. Diet plays an important role in the primary prevention of hypertension. The dietary approaches to stop hypertension (DASH) trial has shown that a dietary pattern rich in fruits, vegetables and low fat dairy products and with reduced total and saturated fat can be effective in the prevention of hypertension.11 It is a fact that the non vegetarian diet contains cholesterol and saturated fatty acids. These are the root cause of problems like coronary heart diseases and hypertension.Vegetarian diets are usually rich in carbohydrates, n-6 fatty acids and dietary fiber and are more healthful in preventing, treating or reversing heart disease. A low-fat vegetarian diet is the single most effective way to stop the progression of coronary artery disease or prevent it entirely.Lifestyle adjustments in diet are important in determining the outcome for people with hypertension.12
The aim of this research was to assess anthropometric measurements, dietary intake and lipid profile of hypertensive vegetarian and non vegetarian young Indian adult men.
Materials and Methods
Sample population
Young sedentary hypertensive adult males, aged 25-30 yrs. were purposively selected. Subjects were chosen from the outpatient departments of hospitals from Nagpur city, Maharashtra State, India.Subjects categorized under stage I hypertension were selected based on the criteria of Joint National Committee VII.13-15 BP was measured thrice in the right arm in sitting position, at the intervals of 5 minutes, using a standard mercury sphygmomanometer and stethoscope with the help of trained personnel.
Inclusion and exclusion criteria
Only sedentary males from age group 25 to 30 yrs who were free from other medical conditions were chosen. Subjects with primary hypertension (stage I hypertension) were selected. Subjects with secondary hypertension and medical complications were excluded from the study. Only those subjects who were not using any drugs for hypertension and dyslipidemia were chosen. Subjects were undergoing lifestyle modifications like stress management, weight reduction programmes, dietary counseling for the treatment of hypertension.
Rapid changes in diets and lifestyles that have occurred with industrialization, urbanization,economic development and market globalization have accelerated over the past decade. Because of these changes in dietary and lifestyle patterns, chronic diseases like hypertension are becoming increasingly significant causes of disability and premature death.
Sample size
Total four hundred (400) hypertensive young males were purposively selected; out of which two hundred(200) were vegetarian& two hundred(200) were non vegetarian.
Data collection
Anthropometric measurements
Measurements of height, weight, WC, HC and MUAC were taken. BMI and WHR were derived using standard equations.16
Dietary intake
Food intake data of each subject was collected using 24 hour’s dietary recall method. This was done to collect the data for consecutive three days. Energy, carbohydrate, protein and fat content of three day’s diets were calculated using food composition tables.17
Biochemical parameters
Fasting serum lipid test was done by taking blood samples with the help of a trainer. Blood samples were immediately given to the pathologist for the estimations (using Toshiba (Japan) auto analyzer using Roche kits).Total cholesterol (TC), high density lipoprotein cholesterol (HDL-C) and triglyceride (TG) levels were estimated. Low density lipoprotein cholesterol (LDL-C) andvery low density lipoprotein cholesterol (VLDL-C) was computed using Friedewald’s Equation.18 TC: HDL-C, TG: HDL-C, HDL-C: LDL-C and LDL-C: HDL-C ratios were derived.Guidelines given by the National Cholesterol Education Program (2001) were used.
Statistical analysis
Mean (M), standard deviation (SD), range (R) & percentage values were derived. Comparisons among and between the groups were done usingcritical ratio (CR) test. Correlations (r) were derived using Pearson’s Product Moment Coefficient of Correlation. Level of significance was tested at both 5 % & 1 % levels.
Results
Mean age of V was 30.08±4.6 yrs & that of NV was 30.6±5.31 yrs. Duration of hypertension was found to be 5.2±3.38yrs in V&6.3±3.76 yrs in NV.
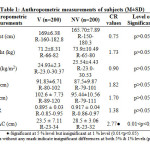 |
Table 1: Anthropometric measurements of subjects (M±SD) |
V were found to be taller but lighter than NV (169±6.38 cm & 165.70±7.89 cm and 71.2±8.31 and 73.9±10.49 kg, respectively, p>0.05). Insignificant difference was noticed between V and NV for BMI. 70% V and 50% NV were with normal BMI. More NV subjects were found obese than V subjects (30% NV were obese grade II).
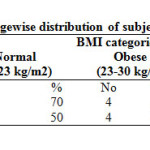 |
Table 2: Percentagewise distribution of subjects based on BMI |
Mean WC and HC of V were higher than NV (p>0.05). However, mean WHR of NV was higher than V (p>0.05).MUAC of NV was significantly higher than V (23.7±7.11 and 28.4±3.06 cm, respectively, CR=2.47, 0.01<p<0.05).
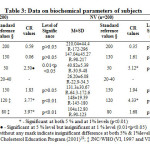 |
Table 3: Data on biochemical parameters of subjects |
TC and LDL-C of NV were greater than V but HDL-C and TG of V were greater than NV (p>0.05). No differences were noticed between V and NV for VLDL-C. NV group had higher mean values of SBP (p>0.05) and DBP (0.01<p<0.05) than V group. SBP and DBP of NV members were as high as 180 and 123 mmHg, respectively.
TC and LDL-C among NV correlated positively (p<0.01) with body weight (r 0.5340 and 0.4841, respectively) and BMI (r 0.5496 and 0.6211, respectively). These correlations however, were insignificant among V (p>0.05). Stronger relationship existed between HDL-C and body weight among V than NV. In contrast, correlation between VLDL-C and body weight was highly significant among NV (r 0.5921, p<0.01).
HDL-C showed direct relationship with BMI in both the groups (p>0.05). VLDL-C and TG showed significant direct correlation with BMI among NV group (r 0.6215 and 0.6223,respectively, p<0.01). WHR showed positive but insignificant correlation with TC among V. Among NV, WHR reflected positive correlation with LDL-C, HDL-C, VLDL-C and TG (r 0.0963 to 0.2975, p>0.05). However, among V, WHR reflected inverse relationship with LDL-C, HDL-C, VLDL-C and TG.
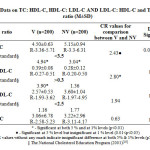 |
Table 4: Data on TC: HDL-C, HDL-C: LDL-C AND LDL-C: HDL-C and TG: HDL-C ratio (M±SD) Click here to View table |
TC: HDL-C ratio among NV was significantly higher than V (CR=2.43, p<0.01); however, both the groups showed this ratio greater than the reference standard. Mean value of HDL-C: LDL-C for V was significantly higher than NV (CR=2.80, p<0.01). NV group showed this ratio below the desirable value of 0.3. Both V and NV groups had LDL-C: HDL-C ratio above 2.5 (CR=1.16 and 1.77, respectively, p>0.05).TG: HDL-C ratio for V was calculated as 3.06 and for NV as 3.22.
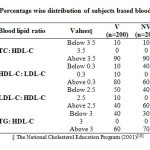 |
Table 5: Percentage wise distribution of subjects based blood lipid ratio |
Only 10 % of both V and NV had TC: HDL-C ratio below 3.5 whereas 90 % of both V and NV had TC: HDL-C ratio above 3.5.10% V and 40% NV had HDL-C: LDL-C below 0.3. More V (80%) had this ratio above 0.3.More of V had LDL-C: HDL-C ratio below 2.5 (50 %) as compared to NV (40 %). 40% V and 60% NV this ratio above 2.5. Only 40% V and 30% NV had TG: HDL-C below 3.0. Majority V and NV had this ratio above 3.0 (60% and 70%, respectively).
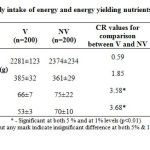 |
Table 6: Data on daily intake of energy and energy yielding nutrients by subjects (M±SD) |
Both V and NV groups had mean daily intake of energy computed above 2200 kcal/day. More strong and significant relationship was found out between intake of energy and SBP among NV as compared to V (r 0.4804, p<0.01 for NV and 0.1922, p>0.05 for V).DBP reflected direct relationship with energy intake among NV (r 0.2715, p<0.01); however, no such trend was noticed for V (r -0.0493, p>0.05).Among NV, energy intake showed positive correlation with TC (r 0.0797, p>0.05) and LDL-C (r 0.2087, p<0.01). No such trend was noticed for V.
V had higher mean daily consumption of carbohydrate as compared to NV (385 and 361 g, respectively, p>0.05). Stronger correlation between carbohydrate intake and TG existed among V than among NV (r 0.2068 and 0.1465, respectively).
In contrast to higher intake of intake of carbohydrate among V, mean daily intake of protein and fat by NV was significantly higher than V (p<0.01).In NV group, protein intake was directly correlated with HDL-C (r 0.3345, p<0.01).Dietary fat intake revealed positive (p<0.01) correlation with TC among both V and NV (r 0.1888 and 0.3476, respectively).
Discussion
Research has demonstrated a close relationship between the diet and chronic degenerative diseases such as obesity, hypercholesterolemia and hypertension.20 Being heavier than V, NV subjects under study exhibited greater mean BMI indicating more risk of cardiovascular diseases as 50% were obese. Several studies have shown association of over nutrition with hypertension and determined cut off values of BMI above which there is increased CVD risk.20,21 This link between hypertension and increased body weight can be explained by the fact that the blood volume increases with excess body fat, and the heart works harder to pump the blood through a longer and constricted network of blood vessels.22 Higher SBP is reported among NV as compared to lacto-ovo vegetarians.23 NV had higher mean SBP and DBP values confirming the fact that being overweight can increase the risk for high blood pressure. BMI, WHR andMUAC were seen to increase as the level of hypertension increased.24
Increased abdominal fat accumulation assessed by WC, HC and WHRhas been extensively documented as independent risk factor across different ethnic groups.25 Interestingly, V showed higher mean values of WC and HC but lower WHR as compared to NV. Sedentary lifestyle and over consumption of refined foods may lead to deposition of body fat even in vegans asSBP and DBP showed positive association with WHR.
Adverse dietary profile is involved in elevation of blood lipids and thus, is a predictor of early and accelerated atherosclerosis.26 As the blood pressure levels of the adults increase, there is also an increase in the TC, TG, LDL-C and VLDL-C levels and a decrease in HDL-C levelindicating that there may be a significant influence between the various lipid parameters and blood pressure levels.NV represents higher TC and LDL-C.23,27 Higher TC and LDL-C levels of NV group indicate positive impact of higher SBP and DBP values as compared to V. Higher levels of blood lipid parameters especially bad cholesterol corresponded with higher levels of blood pressure among NV. It is said that the greater consumption of carbohydrates among Vis reflected in the higher TG level.23,24 Similar findings were obtained among V for the present research.
Being a sensitive and specific index of cardiovascular risk,18,28 majority of V and NV had TC: HDL-C ratio above 3.5 which may be attributed to lower levels of HDL-C. Ideally to keepTC: HDL-C ratio below 3.5, one can follow dietary and lifestyle modification in terms of fatty acid and exercise.
The HDL-C: LDL-C ratio compares “good cholesterol” to “bad cholesterol”. The goal must be to keep it above 0.3 with the ideal being above 0.4.18,28 40% NV showed this ratio below 0.3 indicating higher cardiovascular risk. This fact is confirmed as higher % of NV also had LDL-C: HDL-C above 2.5. LDL-C: HDL-C ratio is used to help predict the changes of developing heart disease. This ratio should ideally be kept below 2.5:14.18,28 Majority ofV had HDL-C: LDL-C above 0.3 and LDL-C: HDL-C ≤2.5 indicating benefits of vegetarian diet rich in fruits, vegetables, whole cereals and legumes.
Studies on vegetarians show that appropriately planned vegetarian diets are healthy and nutritionally adequate.29 No great differences between V and NV were observed for consumption of energy from food; however, both the groups surpassed RDA. Intake of fat and protein among NV exceeded the RDAs of ICMR30 and this can be attributed to the ingestion of animal foods. In contrast, relied on cereals, pulses and milk products, mean protein intake of V was slightly lower than the RDA based on their height and age ICMR.30
Vegans usually consumed more carbohydrate energy than NV.31 For this study, V had higher mean consumption of carbohydrate. Results revealed direct relationship of energy intake with TC and LDL-C among NV and with TG among V.
NV presented higher values of BP, BMI and MUAC than V. Also, V showed better lipid profile than NV. This could be attributed to higher intake of energy and fat among NV.Consumption of more carbohydrates by V may cause increased level of TG. Lifestyle adjustments in diet and exercise are important factors in determining the outcome for young people with hypertension.
Acknowledgements
The author is grateful to Ms. P. Bansijani for her help in data collection.
References
- Deedwania P. and Gupta R., Hypertension in South Asians. In: Izzo, Black (eds). Primer on Hypertension. American Heart Association, Dallas, USA, (2002).
- Rodgers A., Lawes C. and MacMahon S.,Journal of Hypertension.,18(Suppl 1):S3-S6 (2000).
CrossRef - Gupta R. Gupta S. Gupta V.P. and Prakash H.,Journal of Hypertension.,13:1193-1200 (1995).
CrossRef - Gupta P.C. and Gupta R.,Indian Heart Journal., 51:691 (1999)..
- Joseph A., Kutty V.R. and Soman C.R.,Indian Heart Journal., 52:29-35 (2000).
- Anand M.P.,Journal of Association of the Physicians in India.,48:1200-1201 (2000).
- Mohan V., Deepa R., Rani S.S., and Premalatha G.,Journal of the American College of Cardiology.,38: 682-687 (2001).
- Gupta R., Indian Heart Journal.,54:59-66 (2002).
- Gupta R.,Indian Heart Journal., 57:632-638 (2005).
- Kearney P.M., Whelton M., Reynolds K., Muntner P., Whelton P.K., and He J.,Lancet.,365(9455):217-223 (2005).
CrossRef - Nagyova A. and Krajcovicova M.,Annals of Nutrition and Metabolism.,45:148-151 (2001).
CrossRef - Goldstein L.B., Bushnell C.D., Adams R.J., Appel L.J., Braun L.T., and Chaturvedi S.,Stroke.,42:517-84 (2011).
CrossRef - The Sixth Report of the Joint National Committee on Detection, Evaluation and Treatment of High Blood Pressure (JNC VI). Archives of Internal Medicine.,157:2413-2446 (1997). WHO. Available from: http://www.who.int/health_topics/cardiovascular_diseases/en/.
CrossRef - US Dept. of Health and Human Services – The Seventh Report of the Joint National Committee (JNC VII) on Prevention, Detection, Evaluation, and Treatment of Blood Pressure, NIH Publication No. 04: 5230 (2004).
- WHO. World Health Organization- International Society of Hypertension Guideline for the Management of Hypertension (Guideline Sub-Committee). Journal of Hypertension., 151-183 (1999). Available from: http://indiacurrentaffairs.org/average-blood-pressure-fallsglobally-shoots-up-in-india-2/.
- Bamji N.S., Prahalad R.N. and Reddy V., Text Book of Human Nutrition, 2nd edition, Oxford IBH Publishing Co-private Ltd, New Delhi,166 (2004).
- Gopalan C,. Ramasastri B.V. and Balasubramanian S.C., Nutritive Value of Indian Foods. National Institute of Nutrition (NIN)/Indian Council of Medical Research (ICMR), Hyderabad, India,7-95 (2012).
- Friedewald W.T., Levy R.J. and Fredrickson D.S.,Clinical Chemistry., 18:499-502 (1972).
- The National Cholesterol Education Program., Journal of the American Medical Association., (2001).
- Lin W.Y., Lee L.T., Chen C.Y., Lo H., Hsia H.H. and Liu I.L., International Journal of Obesity and Related Metabolic Disorders., 26:1232-1238 (2002).
CrossRef - Wildman R.P., Gu D., Reynolds K., Duan X., Wu X., and He J.,American Journal of Clinical Nutrition.,82(6):1195-1202 (2005).
- Hoeger W.W.K. and Hoeger S.K.,Cengage Learning, 324 (2010).
- Fernandes Dourado. K., de Arruda Camara E., Siqueira Campos. F., Sakugava Shinohara N.K.,Nutr Hosp., 26(5):959-964 (2011).
- Sugasri S. and Lakshmi U.K.,International Journal of Applied Biology and Pharmaceutical technology., 3(1):123-129 (2012).
- Ho S.C., Chen Y.M., Woo J.L.F., Leung S.S.F., Lam T.H. and Janus E.D.,International Journal of Obesity., 25:1689-1697 (2001).
- Lu S.C., Wu W.H., Lee C.A., Chou H.F., Lee H.R. and Huang P.C.,Journal of Nutrition.,130(6):1591-1596 (2000).
CrossRef - De Biase S.G., Fernandes S.F., Gianini R.J. andDuarte J.L.,Diabetes Care., 34:1225-1227 (2011).
- Srivastava M., Arora S., Nigam P.K., Singh R. and Lal A.,Indian Heart Journal., 58:240-245 (2006).
- Key T.J., Appleby P.N. and Rosell M.S.,Proceeding of the Nutritional Society., 65:35-41 (2006).
- Indian Council of Medical Research (ICMR).Nutrient Requirements and Recommended Dietary Allowances for Indians, National Institute of Nutrition (NIN), 7,25-83 (2009).
- Supawan V., Pongpaew P., Tungtrongchitr R., Tawprasert S., Changbumrung S., Migasena P. andSchelp F.P.,International Journal for Vitamin and Nutrition Research., 62(4):324-329 (1992).


Web of Science Coverage
Emerging Sources Citation Index (ESCI)
2024 Journal Impact Factor: 1.1
Scopus Journal Metrics
CiteScore 2025: 2.6
CiteScore Details
Sustainable Nutrition: Food Systems, Nutrient Retention, and Public Health Impact
![]()
This journal is a member of, and subscribes to the principles of, the Committee on Publication Ethics (COPE)


