Present Scenario of Health Status of University Students at Arrah (Bhojpur), Bihar
1Department of Zoology, Veer Kunwar Singh University, Arrah-802 301
2Department of Botany, T. M. Bhagalpur University, Bhagalpur.
DOI : http://dx.doi.org/10.12944/CRNFSJ.2.1.06
Download this article as:
![]()
A cross sectional study was made to know health status of students and research scholars of age group of 20–29 years of Department of different disciplines of Veer Kunwar Singh University, Arrah–802 301 from July 2011 to May 2013. Out of 2428 participants, 1527 (62.89%) participants possessing normal health status followed by 495 (20.39%) of overweight, 235 (9.68%) of underweight and 171 (7.04%) of obese category.
The respective proportion of female participants of normal, overweight, underweight and obese category in relation to age ranges from 3.14 to 14.91%, 8.89 to 34.87%, 7.76 to 50.49% and 9.33 to 28.01%. The statistical analysis indicates that the proportion of normal health status decreases significantly (r=-0.637, p<0.05). Conversely, an insignificant increase was calculated (r=0.159; p>0.05) between overweight and age.
As far as number of male participants is concerned, their respective proportion of health categories varies from 43.13 to 71.06%, 14.21 to 40.00%, 3.03 to 32.88% and 3.61 to 32.84%. Statistically, the proportion of normal health category increases insignificantly (r=0.310; p>0.05) but an insignificant decrease (r=-0.277, p>0.05) was calculated between overweight category and age.
KEYWORDS:University students, body mass index, Health status
Introduction
Rapidly changing lifestyles are fueling the global obesity epidemic. Once considered a problem related to affluence, obesity is now fast growing in many developing countries.1 Even in countries like India, which are typically known for high prevalence of under-nutrition, significant proportions of overweight and obese now coexist with the undernourished.2 But partly due to lack of data, understanding of causes and consequences of this rapidly growing public health threat remains poor. Previous research on obesity in India has found the prevalence of obesity to the higher among women.3 Under nutrition is more prevalent in rural areas, whereas, overweight and obesity are more than three times higher in urban areas. One of the studies puts an alarming 70% of India’s urban population in obese or overweight category. Earlier it was reported that overweight and obesity is highest in (about 33%) the northern states of Delhi and Punjab, followed by about 20% in Goa and Kerala. The prevalence is much lower (4-8%) in Uttar Pradesh, Madhya Pradesh, Rajasthan, Orissa, Assam and Bihar. Such up to date information from Bihar in general4 and Arrah in particular are probably lacking.
Therefore, an attempt was made to establish relationship between age and health status among University students and research scholars of Arrah (= Bhojpur), Bihar as a representative to know the health status of youth of this city.
Materials and Methods
A cross sectional study was made from 2428 students and research scholars of age group 20–29 years of Department of different disciplines of Veer Kunwar Singh University, Arrah–802 301 from July 2011 to May 2013.
For the assessment of body mass index, height and weight measurements were taken using standard protocols.5 Stature was measured by anthropometer to nearest 0.1 cm and weight using portable spring weighing machine with least count of 0.5 kg, in light clothing and without shoes. Body mass index (BMI) is calculated as the weight in kilograms divided by the square of the height in meters (kg/m2). Recently, Health Ministry reduced the diagnostic cut–offs for body mass index to 23 kg/m2. The standards have been set for the first time in the ministry is consensus guidelines for the Prevention and Management of Obesity and Overweight. The guidelines were released in October 2008. The guidelines were released jointly by the Health Ministry, Diabetes Foundation of India (DFI), All-India Institute of Medical Science (AIIMS), Indian Council of Medical Research (ICMR), National Institute of Nutrition (NIN) and 20 other Health Organization.
The classification of health status on the basis of body mass index6 is tabulated below
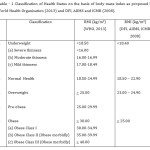 |
Table 1: Classification of Health Status on the basis of body mass index as proposed by World Health Organisation (2013) and DFI, AIIMS and ICMR (2008). Click here to View table |
Results and Discussion
The age standardized distribution of body mass index and nutritional status across various age groups is presented in Tables – 2 to 4. Table – 2 showed nutritional status of University students of age group 20-29 years at Arrah. The nutritional status of female participants is given in Table – 3. Similarly, Table – 4 showed nutritional status of male participants.
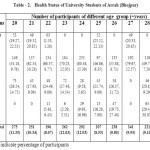 |
Table 2: Nutritional status of University students of age group 20-29 years at Arrah Click here to View table |
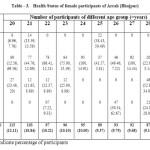 |
Table 3: The nutritional status of female participants Click here to View table |
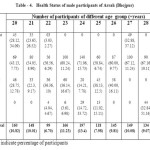 |
Table 4: Nutritional status of male participants Click here to View table |
The study was conducted on 2428 participants having 196-275 (8.07-11.33%) individuals in each age group of 20-29 years (Table 2). The participants share more than one health status. Out of 2428 participants, 1527 were found to be category of normal health status followed by 495 of overweight, 235 of underweight and 171 of obese category. When data were analyzed, it was calculated that 62.89% participants showed normal health status followed by 20.39%, 9.68% and 7.04%, overweight, underweight and obese category. Their respective range varies from 46.86 to 80.48%, 9.59 to 32.65%, 1.53 to 25.12% and 2.29 to 29.41%. As far as the number of participants is concerned, their respective proportion of normal, overweight, underweight and obese category ranges from 7.20 to 15.39%, 5.65 to 16.16%, 1.28 to 22.13% and 3.51 to 38.01%. The statistical analysis indicates that the proportion of participants of normal health status decreases insignificantly (r=-0.199, p>0.05) at the age group of 20 to 29 years. Similarly, the proportion of overweight category also showed an insignificant decrease (r=-0.152, p>0.05).
The gender differentiation indicates that out of total of 950 female participants having 83 to 115 (8.77-12.11%) individuals in each age group (Table 3). Each age group share more than one health status except at age 24. Out of 950 participants, 637 were found under the category of normal health status followed by 135 of overweight, 103 of underweight and 75 of obese category. When data were analyzed, it was calculated that 67.05%, 14.21%, 10.84% and 7.89% participants showed health status of normal, overweight, underweight and obese category. Their respective range of normal, overweight, underweight and obese category varies from 22.99 to 100%, 11.65 to 52.87%, 6.96 to 58.43% and 7.22 to 50.54%. Their respective proportion of normal, overweight, underweight and obese category ranges from 3.14 to 14.91%, 8.89 to 34.87%, 7.76 to 50.49% and 9.33 to 28.01%. The data analysis indicates that the proportion of participants of normal health status decreases significantly (r=-0.637, p<0.05) at the age group of 20 to 29. Conversely, an insignificant increase was calculated (r=0.159; p>0.05) between overweight and age.
Similarly, out of 1478 male participants, 890 were found to show normal health status followed by 360 of overweight, 192 of underweight and 86 of obese categories from 99 to 197 (6.70 to 13.4%) participants in each of 20-29 years age groups. It was analyzed that on an average 60.2% male participants followed by 24.36%, 8.93% and 5.82 % has proportion of normal, overweight, underweight and obese category respectively (Table 3). The respective proportion of these categories varies from 43.13 to 71.06%, 14.21 to 40.00%, 3.03 to 32.88% and 3.61 to 32.84%. Statistical analysis between age and health status infers that proportion of males of normal health status increases insignificantly (r=0.310; p>0.05) but, an insignificant decrease (r=-0.277, p>0.05) was calculated between overweight category and age. The proportion of normal category in relation to number of participants varies from 6.29 to 15.73% followed by 7.78 to 16.67% of overweight, 2.27 to 37.12% of underweight and 4.67 to 51.16%.
The World Health Organization has described obesity as one of today’s most neglected public health problems, affecting every region of the globe.7 Totally 5% of the Indian population has been affected by obesity.8 In another observation, it was reported that on an average 16% females and 12.1% males are obese in India. Further, it was analyzed that Punjab is top scorer of this culprit (37.5% female and 30.30% male obesity) followed by 10.5% and 8.5% female and male obesity in Bihar with a minimum (5.3% female and 5.2% male obesity) in Tripura. The present observation trails both the percentage of female and male obesity in India and Bihar. The difference is probably related with rural/suburban nature of this city and also due to difference of age group, regional variation, living standard etc.
According to the National Family Health Survey (NFHS), percentage of ever married women aged 15-49 years who are overweight or obese increased from 11% in NFHS-2 to 15% in NFHS-3. Under nutrition is more prevalent in rural areas, whereas overweight and obesity are more than three times higher in urban areas. In South India, the percentage of women who are overweight or obese in highest in Kerala (34%), followed by Tamil Nadu (24.4%), Andhra Pradesh (22.7%) and Karnataka (17.3%)10. People in the age group of 24 to 39 years, who have been living in big metros or booming small towns, are at the risk of being obese, a recent study has suggested. The prevalence of obesity was 20% in men and 35% in women using BMI> 30 as the cut-off point but increased to 54% in men and 66% in women when BMI>25 was used. The age standardized prevalence of generalized obesity in South India was 46% (women: 47% men: 43%) compared to 35% in the US.9 In the New Delhi Birth Cohort, the prevalence of obesity was 20% in men and 35% in women using body mass index > 30 as the cutoff point but increased to 54% in men and 66% in women when body mass index > 25 was used.
In this work, it was observed that only 7.89% women and 6.49% men of age group 20-29 years are obese. The work was conducted on the students of age group 20-29 years. At present students of higher studies are rigorously conscious for their physic and health. It may be one of the factors to show normal health status of 62.87% by students (67% female and 60.22% male students).
Despite a high prevalence of obesity and over-weight (one half of men and two-third of women), most Indians do not consider themselves as obese and overweight. Mass education of both medical community and the general public regarding the dangers of obesity as well as the lower cut points for defining it is urgently needed.
It would appear from the earlier and present results that nearly a third of the males and more than half of females are currently overweight (BMI>25). If present trends continue, the situation can get worse within a decade, and overweight could emerge as the single most important public health problem in adults. Overweight/obesity may not be considered as a specific disease but it is certainly the mother of important degenerative diseases in adult life. Prevention and control of this problem must, therefore, claim priority attention.
References
- World Health Organisation. Technical Report Series no. 916. Geneva (2003).
- Popkin B.M., Public Health Nutrition 5(1A), 205-214 (2002).
CrossRef - Misra, A., Pandey, R.M., Dev., J.R., Sharma, R., Vikram, N.K. and Khanna, N., Int J Obes Relate Metab Disord. 25(11): 1722-1729 (2001).
CrossRef - Ghosh, A., Sarkar. D., Mukherji, B. and Pal, R., Ann Trop Med Pub Health 6:71-75 (2013).
CrossRef - Weiner, J.S. and Lourie, J.A., Academic Press, London, UK (1981).
- World Health Organisation http://apps.who.int/bmi/index.jsp?introPage=intro3.html (2013).
- Pednekar, M.S., Gupta, P.C., Shukla, H.C. and Hebert, J.R., BMC Public Health 6:70 (2006).
CrossRef - Kumar, N.V.R.T.P., Mohanta, G.P., Manna, P.K. and Manavalan, R., Indian Journal of Pharmacy practice 2: 81-83 (2008).
- Deepa, M., Farooq, S., Deepa, R., Manjul,a D. and Mohan, V., Eur. J. Clin. Nutr. 63(2):259-267 (2009).
CrossRef - Kalra S, Unnikrishnan A.G., J Med Nutr Nutraceut 1: 37-41 (2012).
CrossRef


Web of Science Coverage
Emerging Sources Citation Index (ESCI)
2024 Journal Impact Factor: 1.1
Scopus Journal Metrics
CiteScore 2025: 2.6
CiteScore Details
Sustainable Nutrition: Food Systems, Nutrient Retention, and Public Health Impact
![]()
This journal is a member of, and subscribes to the principles of, the Committee on Publication Ethics (COPE)


