
Introduction
Rice is a major source of energy intake in East Asia. Koreans have a rice-oriented diet, and according to the Korea National Health and Nutrition Examination Survey, polished rice is the major source of energy intake, supplying an average of 516.9 kcal per day and 25.7% of the total energy intake, and adults aged 19 to 64 years old consume rice more than twice a day.1
Since rice supplies energy through carbohydrates and rice-centered meals vary in nutritional balance depending on the composition of the meals, such as soup and side dishes, the relationship between rice intake and metabolic diseases is controversial.2-5 Rice-centered meals can balance nutrient intake through various side dishes, have lower total fat and saturated fat content than Western meals and are richer in dietary fiber and vitamins, which can have a positive effect on preventing chronic diseases related to vascular diseases.3 Meanwhile, as a result of comparing the relationship between white rice intake and the incidence of type 2 diabetes, the relative risk was 1.55 (95% CI 1.20-2.01) for Asian populations and 1.12 (0.94-1.33) for Western populations, indicating that Asians had a relatively higher risk of diabetes than Westerners.4 In addition, Song et al. (2015) reported that in a study using data from the Korea National Health and Nutrition Examination Survey, the fasting blood glucose levels of subjects in the high white rice intake group (>301.84 g) were higher than those of the subjects in the medium white rice group (>134.64 g~ ≤301.84 g) and the low white rice group (≤134.64 g).5 Also, BMI and waist circumference of the high white rice intake group were also the highest among the three groups. As such, along with the advantages of a rice-oriented diet, the problem of eating excessive rice has been suggested. 5 Therefore, to prevent and manage metabolic diseases such as diabetes and obesity, research on the use and consumption of rice, which is a staple food, is needed.
Due to the development of science and technology, various cooking tools have been developed and used.6 Differences in the cooking methods of rice can affect the properties, digestion and absorption of starch.7 Looking at previous studies on the characteristics of cooked rice according to the cooking method, starch gelatinization was higher in rice cooked in a gas pressure cooker than in rice cooked in an electric cooker.8 In an in vitro digestibility experiment, Park et al. reported that when brown rice was cooked under two different pressure conditions, the digestibility of brown rice cooked at high pressure was improved.9 It has been shown that the moisture content and the degree of change in the volume of rice cooked differ according to the cooking method. In the case of pressure-cooked rice, the volume increase rate was lower than that of non-pressure-cooked rice,10 and the moisture content was also lower.11-12 Therefore, it is assumed that the difference in the degree of the change in volume and the physical and chemical properties of the rice according to the cooking method may affect the nutrient density, digestibility and absorption rate of the cooked rice, thereby affecting the blood glucose response or satiety after ingestion.
Food intake is affected by information from the external environment, and approximately 80% of the food intake is dependent on visual information. Before eating, the amount of food is recognized through visual signals, and the standard for the amount of food one will consume is determined.13 In a study with women in their 20s that examined the effect of the visual perception of rice on satiety, fried rice in an augmented rice bowl with the bottom of the bowl raised and fried rice in a regular rice bowl were provided.14 As a result, rice was consumed less when it was served in an augmented rice bowl than when it was served in a normal rice bowl, but there was no significant difference in satiety.14 Another study in which intake was measured by providing female college students with regular rice bowls, diet rice bowls with the bottom of the bowl raised, and small rice bowls with kimchi fried rice showed that the intake was highest for small rice bowls, followed by diet rice bowls and regular rice bowls.10 In terms of visual recognition, diet rice bowls were perceived as appearing to have the most rice, and those who were provided diet rice bowls showed the highest level of satiety.10 From these results, it can be seen that visual volume is an important factor affecting satiety.
Generally, rice cooking methods at home are divided into pressure cooking and non-pressure cooking, and studies have reported the differences in the moisture content, texture, and gelatinization of pressure-cooked and non-pressure-cooked rice. However, to date, there have been no studies comparing the blood glucose response and satiety after the ingestion of pressure-cooked and non-pressure-cooked rice. Therefore, in this study, pressure-cooked and non-pressure-cooked rice were prepared using a household electric cooker, and the moisture content, volume, and weight of each type of rice were measured. Two different cooking methods of rice (pressure-cooked/non-pressure-cooked) with different energy content and the same volume were provided to healthy adults, and satiety and the blood glucose response were examined before and after intake. This study aimed to provide basic data for a dietary guide for the control of energy intake, the prevention of chronic diseases, and personalized health management.
Materials and Methods
Participants
Twenty-eight healthy adults (6 men and 22 women) were recruited from Kongju National University in Yesan, Korea, through bulletin boards on campus. The study was conducted from April 2020 to June 2020. The subjects were prescreened according to the inclusion and non-inclusion criteria through a questionnaire. The eligibility criteria included the following: 1) subjects aged between 20 and 60 years old and 2) subjects who were nonsmokers and not taking any medication. The non-inclusion criteria included 1) pregnancy, 2) chronic diseases (diabetes, thyroid disease, kidney disease, liver disease, untreated hypertension), 3) smoking, 4) strenuous exercise or weight control, and 5) the use of dietary supplements that could affect appetite (steroids, α-Glucosidase inhibitors, amylin analogs, etc.). If the inclusion criteria were met in the questionnaire, all the study information was provided verbally to the potential subjects. All subjects willing to participate in the study were given the opportunity for screening after providing their written informed consent. Each subject was then individually measured for height and weight without shoes by using a digital scale stadiometer (DS-102, Dong Shan Jenix Co., Ltd, Seoul, Korea). A digital blood pressure monitor (ACCUNIQ BP203, SELVAS Healthcare, Daejeon, Korea) was used to obtain blood pressure readings.
Study design
The study was a randomized, single-blind crossover design study. Subjects were asked to avoid excessive exercise and overeating and to eat as much as possible on the day before the experiment. It also explained that the subjects should not drink alcohol. Water intake was also restricted beginning 1 hour before the experiment. On both trial days, subjects arrived having fasted (8 hours prior) at the testing facility at 09:00 a.m. An experimental meal (non-pressure-cooked rice or pressure-cooked rice + soup + a side dish) was provided. Then, the glucose response was measured, and the subjects were asked to fill out the visual analog scale (VAS) for the assessment of subjective satiety (Figure 1). The subjects were randomized to receive iso-volume amounts of either non-pressure-cooked rice or pressure-cooked rice for breakfast on their first trial day. In the second experiment, at least 7 days apart from the first experiment, subjects were given a meal containing rice crossed with the first experiment. Only the subjects were blinded in this trial, since the sub-investigators prepared the test meals and analyzed all of the data.
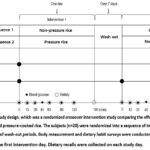 |
Figure 1: Illustration of the study design, which was a randomized crossover intervention study comparing the effects of two interventions: non-pressure-cooked rice, and pressure-cooked rice. |
Test meals
The pressure- and non-pressure-cooked rice were prepared with rice varieties using japonica (Yuchang Nongsan Corp., Gyeonggi, Korea). The experimental cooked rice was prepared as follows. After soaking 900 g of rice in water for 15 min at 25 °C, the rice was placed in an electric rice cooker (Twin-pressure, CRP-JHTS1060FS, CUCKOO, Yangsan, Korea) and cooked under non-pressure or pressure conditions with a standard amount of water (1140 g for non-pressure-cooked rice, 1020 g for pressure-cooked rice). The cooked rice used in the experiment was dried by the air oven moisture content determination methods in a dryer at 105 ℃ for 2 hours and cooled for 30 minutes, and the moisture content was repeatedly measured using an electronic balance (PAG214C, OHAUS, Ohaus, Parsippany, NJ, USA), and the means moisture content was 55.6% for pressure-cooked rice and 58.5% for non-pressure-cooked rice. Table 1 shows the composition of the experimental meals. The pressure-cooked and non-pressure-cooked rice were served in equal volumes and consumed with standardized soup and edible seaweed and kkakdugi (Korean radish kimchi). Women were provided with 200 mL of rice (non-pressure-cooked rice: 156.2 g; pressure-cooked rice: 168.3 g), 160 mL of soup, 5 g of edible seaweed, and 33 g of kkakdugi. Men were provided with 300 mL of rice (non-pressure-cooked rice: 234.3 g; pressure-cooked rice: 252.4 g), 160 mL of soup, 5 g of edible seaweed, and 50 g of kkakdugi. To establish the amount of rice for this experiment, our research team reviewed the previous research data on rice intake. According to a study conducted by Hong et al. on rice intake using data from the Korea National Health and Nutrition Examination Survey 2012-2016, the intake amount of cooked rice varied depending on the place where it was consumed; based on a home diet, men consumed 260-305 mL of rice, and women consumed 200-218 mL of rice.15 Referring to these results, in this study, the amount of rice provided to the women and men was set to 200 mL and 300 mL, respectively. The nutritional contents of the cooked rice and kkakdugi was calculated according to the nutrition composition table,16 and the nutritional content of the seaweed and the soup was obtained from the nutrition label of the products.
Table 1: The composition and energy content of the experimental diets.
| The composition and energy content of the experimental diets | ||||||
|
Gender |
||||||
|
Female |
Male |
|||||
|
Non-pressure |
Pressure |
Non-pressure |
Pressure |
|||
|
Diets component |
Rice |
Volume (mL) |
200.0 |
200.0 |
300.0 |
300.0 |
|
Weight (g) |
156.2 |
168.3 |
234.3 |
252.4 |
||
|
Energy (kcal)† |
258.9 |
295.1 |
388.3 |
442.6 |
||
|
Soup |
Volume (mL) |
160 |
160 |
160 |
160 |
|
|
Energy (kcal)‡ |
25 |
25 |
25 |
25 |
||
|
Edible seaweed |
Weight (g) |
5 |
5 |
5 |
5 |
|
|
Energy (kcal)‡ |
30 |
30 |
30 |
30 |
||
|
Kkakdugi |
Weight (g) |
33 |
33 |
50 |
50 |
|
|
Energy (kcal)† |
12.5 |
12.5 |
19 |
19 |
||
|
Energy nutrient composition of the experimental diets |
Energy (kcal) |
309.5 |
345.7 |
438.8 |
493.1 |
|
|
Carbohydrate (g) |
64.7 |
72.7 |
94.3 |
106.3 |
||
|
Protein (g) |
5.7 |
6.3 |
8.2 |
9.1 |
||
|
Lipid (g) |
3.1 |
3.3 |
3.2 |
3.5 |
||
|
Energy contrition from energy nutrient of the experimental diets |
Carbohydrate (%) |
83.6 |
84.1 |
86.0 |
86.2 |
|
|
Protein (%) |
7.4 |
7.3 |
7.5 |
7.4 |
||
|
Lipid (%) |
9.0 |
8.6 |
6.6 |
6.4 |
||
|
† Data from Food composition database in National Institute of Agricultural Sciences (2021) ‡ Data from nutrition labeling |
||||||
Glycemic Response
The blood glucose concentration was measured with a GlucoDr. S™ (All Medicus Co., Ltd., Anyang, Korea).17 Subjects’ fasting blood glucose levels were measured at the beginning of the study visit (Time 0). Subjects were immediately presented with the test rice and were required to consume the meal within 15 minutes. Blood glucose measurements were taken at 0, 15, 30, 45, 60, 90, and 120 minutes during the 2-hour study visit.18-20 The incremental areas under the curve (iAUCs) includes all areas below the curve and above the fasting concentration level, with any area beneath the fasting level being ignored.21-22
Measurement of Subjective satiety response
Satiety was measured using a 100 mm VAS consisting of three questions anchored at either end with the following statements: ‘How hungry do you feel?’, ‘How full do you feel?’, and ‘How much do you think that you could potentially consume?’ For each question, the participants were asked to mark their relative response on the unmarked visual analog score line (10 cm in length). The participants were asked to rate their satiety using the VAS immediately before breakfast and at 15, 30, 60, 90, 120 and 180 minutes during the 3-hour study visit.10,23-26 The VAS rating for each time was recorded on a separate sheet, and the participants were instructed not to refer back to their earlier ratings. The VAS score was analyzed by measuring the length in cm (± 0.1 cm) from the left end of the scale to the mark. The AUC for satiety was calculated using the trapezoidal rule.22
Statistical Analysis
Data were analyzed with SAS statistical software (Version 9.4, Cary, NC, USA). Baseline characteristics are shown as the mean ± standard deviation and standard error for continuous variables and number and percentage for categorical variables. The effects of the two test meals on glucose response and satiety were tested using paired t-tests when variables were normally distributed and Wilcoxon signed-rank tests when they were not. They were also analyzed using mixed linear models.26 The models for the repeated measurements of the glucose response and satiety sensations included a time-meal interaction and were adjusted for age, BMI, meal order, and fasting value on the given trial day. Statistical significance was declared using a significance level of p<0.05.
Result and discussion
General characteristics of the participants
This study investigated the effect of the physicochemical properties of polished rice cooked by pressure-cooking and non-pressure-cooking methods on satiety and the glycemic response. A total of 28 volunteers completed the two study visits. The baseline characteristics of the participants are shown in Table 2. The participants included 22 females (78.6%), aged 33.1 ± 11.8 years. The mean height and body weight of the participants were 163.6 ± 7.4 cm and 60.2 ± 12.2 kg, respectively. Two-thirds of the participants were normal weight (BMI < 23). In the survey of dietary habits, the proportion of eating twice a day was the highest at 67.8%. For the average meal duration, ‘≥10 ∼ <15 minutes’ was the highest at 46.4%, and the amount of rice consumed per meal was more than ½ bowl to less than 1 bowl and was the highest at 53.6%. The main type of rice cooker used at home was an electronic pressure cooker, and if a gas pressure cooker was included, approximately 80% of the participants were using pressure-cooked rice cookers.
Table 2: General characteristics of the subjects
|
Variables |
|
n=28 |
|
|
Gender |
Male |
6(21.4)† |
|
|
Female |
22(78.6) |
||
|
Age (years) |
33.1±11.8‡ |
||
|
Height (cm) |
163.6±7.4 |
||
|
Weight (kg) |
60.2±12.2 |
||
|
Percent body fat (%) |
27.8±6.0 |
||
|
Body mass index (BMI)(kg/m2) |
<23 |
18(67.8) |
|
|
≧23~<25 |
4(14.3) |
||
|
≧25 |
5(17.9) |
||
|
Means score |
22.6±3.1 |
||
|
Blood pressure |
Maximal blood pressure |
117.6±12.7 |
|
|
Minimal blood pressure |
71.3±7.6 |
||
|
Frequency of meal per day |
2 times |
19(67.8)1) |
|
|
3 times |
8(28.6) |
||
|
≧4 times |
1(3.6) |
||
|
Means |
2.4±0.6 |
||
|
Mealtime (min) |
≧5~<10 |
7(25.0) |
|
|
≧10~<15 |
13(46.4) |
||
|
≧15~>20 |
5(17.9) |
||
|
≧20 |
3(10.7) |
||
|
Usual amount of rice (1 bowls=210 g) |
≤½ bowls |
4(14.3) |
|
|
>½~≤1 bowls |
15(53.6) |
||
|
>1~≤1½ bowls |
9(32.1) |
||
|
Mainly used rice cooker at home |
Electric cooker |
6(21.4) |
|
|
Electric pressured cooker |
21(75.0) |
||
|
Gas pressured cooker |
1(3.6) |
||
|
†n(%) ‡M±SD |
|||
Comparison of glycemic response and the incremental area under the blood glucose response curve (iAUC)
The glycemic response of the participants are shown in Table 3. Among the two experimental meals, the fasting blood glucose concentrations were similar prior to the consumption of each of the two rice diets (non-pressure-cooked rice, 100.04 ± 7.08 mg/dL; pressure-cooked rice, 98.00 ± 8.48 mg/dL) and were not significantly different (p = 0.261). The repeated measurement analyses of the blood glucose concentration showed no significant difference in the rice-time interaction (p = 0.987) or rice effect (p = 0.333) between the two rice diets (Figure 2A). Furthermore, no significant difference between the two rice diets was found in the iAUC for the blood glucose response (Figure 2B).
Table 3: Means of the blood glucose response at each time point before and after the subjects consumed the experimental diets
|
Incremental blood glucose |
Mixed linear |
|||||||||
|
Time |
Baseline |
15 |
30 |
45 |
60 |
90 |
120 |
Rice |
Time |
Rice* |
|
Non-pressure |
100.04 |
128.89 |
169.07 |
174.39 |
157.36 |
137.39 |
128.43 |
0.333 |
p<0.001 |
0.987 |
|
Pressure |
98.00 |
124.18 |
169.07 |
169.64 |
151.04 |
133.21 |
126.29 |
|||
|
P-value§ |
0.261 |
0.184 |
1.000 |
0.426 |
0.263 |
0.364 |
0.491 |
|||
†M±SE
‡Interaction between rice and time
§Paired-test if the variable has a normal distribution, Wilcoxon signed-rank test if it has no normal distribution.
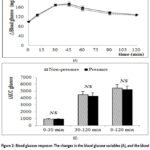 |
Figure 2: Blood glucose response: The changes in the blood glucose variables (A), and the blood glucose variables iAUC (B). Data are shown as the means ± SE. |
In general, the amount of water added for cooking is different for each type of cooking device due to the difference in the amount of moisture that evaporates during cooking. The electric rice cooker used in this study was a household electric rice cooker that can cook in both pressure and non-pressure modes. The standard for the amount of water added during cooking for the rice cooker used in the study was presented differently depending on the pressure and non-pressure modes, and the research team set the amount of added water according to the guide method. However, it has been shown that the degree of change in the moisture content and volume of rice differs according to the type of cooking equipment. In a recently reported study on the quality of rice according to the cooking method, when comparing the volume of the finished rice with the initial volume, the degree of the volume increase of hot plate rice cookers (3.3 times), induction heating rice cookers (3 times), and pressure cookers (2.7 times) was investigated.26 Therefore, the volume increase rate of the pressure cooker was lower than that of the non-pressure cooker. Finally, the energetic value of 200 mL of cooked rice was 1083.2 kJ (258.9 kcal) for non-pressure-cooked rice, which was 14% lower than the value of 1234.7 kJ (295.1 kcal) for pressure-cooked rice.
Although pressure-cooked and non-pressure-cooked rice provided in the same volume had differences in moisture, energy, and especially carbohydrate content, there was no significant difference between the two experimental diets in the blood glucose response over time after ingestion. To our knowledge, there are no previous studies examining changes in blood glucose after the ingestion of pressure-cooked and non-pressure-cooked rice under conditions similar to those of this study, so direct comparison of the results of this study is not available. When Chiu & Stewart analyzed the content of resistant starch by using different cooking devices for each rice variety, it was found that the resistant starch content of jasmine rice was significantly reduced when it was cooked in a pressure cooker compared to when it was cooked in conventional rice cookers or the oven.25 However, no significant difference was found in the blood glucose response. This was explained by the possibility that the difference in the content of resistant starch was small enough to show a difference in blood glucose in a short period of time. Our results did not show that the consumption of pressure cooked rice, which had a higher carbohydrate content and expected to have a greater disruption in the starch structure due to the high-pressure cooking process, induced a significantly increased glycemic response compared to the consumption of non-pressure cooked rice. As mentioned in previous studies, there is a possibility that the difference in content is small enough to show a short-term difference. In addition to the moisture and carbohydrate contents and nutrient density analyzed by this research team, various other unknown factors, such as resistant starch content by pressure and non-pressure cooking methods, are also likely to be involved, and further research is needed on this topic.
Subjective satiety response
The subjective satiety response of the participants are shown in Table 4. There were no significant differences in hunger, prospective food consumption or fullness between the two diets at each measured time point except for hunger 30 minutes after eating. The repeated measurement analyses of the subjective satiety sensation showed no significant difference in the rice-time interaction or rice effect between the two rice diets (Figure 3). Furthermore, no significant differences between the two rice diets were found in the AUC for hunger, fullness or prospective food consumption (Figure 4).
Table 4: Means of the satiety response at each time point before and after the subjects consumed the experimental diets
|
Incremental satiety |
Mixed linear model |
|||||||||
|
Time |
Baseline |
15 min |
30 min |
60 min |
90 min |
120 min |
180 min |
Rice |
Time |
Rice* |
|
Hunger |
||||||||||
|
Non- |
47.18 |
15.46 |
17.96 |
27.61 |
32.39 |
40.36 |
61.61 |
0.7712 |
P<0.0001 |
0.2438 |
|
Pressure |
59.04 |
18.54 |
23.43 |
31.79 |
34.86 |
43.29 |
55.11 |
|||
|
P-value§ |
0.148 |
0.289 |
0.01 |
0.062 |
0.482 |
0.371 |
0.212 |
|||
|
Prospective food consumption |
||||||||||
|
Non- |
57.68 |
22.89 |
27.18 |
33.75 |
39.79 |
48.07 |
63.54 |
0.9163 |
P<0.0001 |
0.8418 |
|
Pressure |
58.61 |
24.25 |
29.43 |
36.50 |
38.07 |
47.79 |
58.96 |
|||
|
P-value§ |
0.840 |
0.689 |
0.454 |
0.248 |
0.824 |
0.942 |
0.216 |
|||
|
Fullness |
||||||||||
|
Non-pressure |
26.25 |
75.71 |
72.93 |
61.50 |
52.82 |
45.54 |
28.04 |
0.1201 |
P<0.0001 |
0.1054 |
|
Pressure |
18.68 |
74.61 |
69.46 |
65.11 |
60.50 |
51.25 |
34.75 |
|||
|
P-value§ |
0.159 |
0.882 |
0.569 |
0.197 |
0.065 |
0.614 |
0.155 |
|||
†M±SE
‡Interaction between rice and time
§Paired-test if the variable has a normal distribution, Wilcoxon signed-rank test if it has no normal distribution.
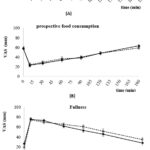 |
Figure 3: Unadjusted mean curves for satiety of the subjects (n=28) using a visual analog scale (VAS) during 180 min, before and after the consumption of the experimental diets. |
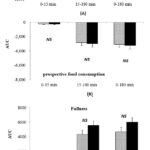 |
Figure 4: Area under the curve (AUC) for hunger of the subjects (n=28) after the experimental diets. Data are shown as the means ± SE. |
Based on the results of previous studies showing that visual perception affects satiety, this study evaluated satiety before, immediately after, and by time after ingestion by serving non-pressure-cooked rice and pressure-cooked rice in the same volume and with the same food. There was no significant difference between the non-pressure-cooked and pressure-cooked rice regarding satiety. Our study results are supported by previous research results that showed that even if the actual amount of food was small, when a large amount of food was perceived visually, a higher satiety was felt.10,14 Additionally, a recent study comparing the satiety of female college students by placing the same amount of food on plates with the same volume, with one plate that was visually narrow and deep and another that was wide and shallow, was reported.28 In another study in which healthy women in their 20s and 30s with normal weight consumed white rice and side dishes at lunch with the same content and volume, in the form of a mixed meal (rice mixed with vegetables and beef) and a separated form, the satiety of the subjects who consumed a separated meal (244 g, 492 kcal) was found to be significantly higher than that of subjects who consumed a mixed meal (285 g, 575 kcal).29 A study was conducted to compare the effects of milkshakes (300, 450, and 600 mL) with different volumes, but the same nutrient density by varying the amount of added air, on subsequent lunch intake. A 12% decrease in lunch intake was found after subjects consumed a 600 mL shake compared to those who consumed a 300 mL shake. Subjects consumed the 450 mL and 600 mL shakes also reported greater satiety than those who consumed a 300 mL shake.30 Combining the above research results, it can be seen that the effect of visual or physical volume on satiety is greater than the amount of energy contained in rice or the actual intake weight.
According to the results of this study, which did not show a significant effect on the blood glucose response and satiety when non-pressure-cooked and pressure-cooked rice with the same volume but different nutrient densities were consumed, the pressure and non-pressure rice cooking methods could be applicable for diet therapy for diabetes, weight control, nutritional supplementation and so on. However, this study has limitations. This study was a short-term study, and additional research is needed regarding the differences in the blood glucose response, satiety, and subsequent diet intake during long-term ingestion of pressure-cooked and non-pressure-cooked rice. Second, the number of subjects was small, and the sex and age groups were not evenly distributed. Third, the nutritional and energy content of our experimental meal were lower than those of a commonly consumed meal. This is because, to clarify the effect of the differences in rice by the cooking method and to reduce the effect of the previous meal, the experiment was conducted with breakfast, and the side dishes provided with the rice were limited. Despite these limitations, this study is the first to investigate the short-term effect of cooked rice, a staple food for Koreans, on the blood glucose response and satiety when ingesting the same volume of pressure-cooked and non-pressure-cooked rice.
Conclusion
In this study, when pressure cooked rice and non-pressure cooked rice were consumed in the same volume, there was no difference in the subjects’ blood glycemic response and perceived satiety, despite the difference in the actual weight of the cooked rice served and the amount of raw rice. Although the energy difference between a serving of pressure-cooked rice and non-pressure-cooked rice in this study is only about 40 to 60 kcal, depending on the serving size, a significant energy reduction or increase of about 100 kcal or more per day could be expected if rice is the staple food for almost every meal. Therefore, when it is necessary to reduce energy intake, such as for weight loss, non-pressure-cooked rice, which has a large volume and relatively low nutrient density, may be recommended. Conversely, when it is difficult to consume a large quantity, but higher energy value need to be consumed, pressure-cooked rice may be recommended. Based on this study, it is considered that continuous research is needed for energy intake control, chronic disease prevention, and personalized health management through long-term studies on the effects of the intake of pressure-cooked and non-pressure-cooked rice on blood glucose control and energy intake.
Acknowledgment
The authors would like to thank Kongju National University, South Korea for their support in completing this article.
Funding Sources
The authors received no financial support for the research, and/or publication of this article.
Conflict of Interest
The authors do not have any conflict of interest.
Authors’ Contribution
Each author mentioned has significantly and directly contributed intellectually to the project and has given their approval for its publication.
Data Availability
The manuscript incorporates all datasets produced or examined throughout this research study.
Ethics Statement
The research protocol conformed to the 1975 Declaration of Helsinki and was approved by the Ethics Committee of Kongju National University on Human Studies (IRB_2019-93).
References
- Ministry of Health and Welfare & Korea Centers for Disease Control and Prevention. Korea Health Statistics 2016: Korea National Health and Nutrition Examination Survey (KNHANES VII-1). Chungju, Korea: Korea Centers for Disease Control and Prevention. 2017. 42, 169/ Ministry of Health and Welfare/ISSN 2005-3662.
- Ryu H. K. A Comparative Study on the Nutrient Content of Rice-based and Wheat-based Meals in Miryang and Daegue. Korean J Community Living Sci. 2003;14(3):47-57. DOI: https://koreascience.kr/article/ JAKO200311922049011.pdf
- Seo J. S., Cho S. H. Rice-based Traditional Meal and Prevention of Chronic Diseases. Food Industry and Nutrition. 2008;13(2):27-33. DOI: https://koreascience.kr/article/JAKO200804748553130.pdf
- Hu E. A., Pan A., Malik V., Sun Q. White Rice Consumption and Risk of Type 2 Diabetes: Meta-analysis and Systematic Review. BMJ. 2012; 344(e1454):1-9. https://doi.org/10.1136/bmj.e1454
CrossRef - Song F. F., Jang J. A., Kim Y. S., Yoon H. R., Cho M. S. Analysis of Dietary Intake Status and Risk of Metabolic Syndrome According to White Rice Consumption in Korea: Based on Data 1st (1998), 4th (2007∼2009), 6th (2013) Korean National Health and Nutrition Examination Survey (KNHANES). Korean J Food Culture. 2015;30(5):682-694. DOI : https://doi.org/10.7318/KJFC/2015.30.5.682.
CrossRef - Han G. J., Lee H. Y., Park H. J., Park Y. H., Cho Y. S., Han G. J. Cooking Technique Development to Improve the Taste of Cooked Rice:-A Consumer Survey on Purchasing Rice and Cooked Rice Consumption. Korean J Food Cook Sci. 2007;23(4):452-460.
- Kim D. Y., Lee H., Choi E. Y., Lim H. Analysis and Evaluation of Glycemic Indices and Glycemic Loads of Frequently Consumed Carbohydrate-rich Snacks According to Variety and Cooking Method. J Korean Soc Food Sci Nutr. 2015;44(1):14-23. DOI : https://doi.org/10.3746/jkfn.2015.44.1.014.
CrossRef - Kim H. Y., Kim K. O. Sensory Characteristics of Rice Cooked with Pressure Cookers and Electric Cookers. Korean J Food Sci Technol. 1986;18(4): 319-24. https://www.kjfst.or.kr/journal/view.html?uid=4275&page=6&sort=&scale=10&all_ k=&s_t=&s_a=&s_k=&s_v= 18&s _n=&spage =&pn=search&year=&vmd=Full
- Park J. W., Chae S. H., Yoon S. The Effects of Steeping and Cooking Pressure on Qualities of Cooked Brown Rice. Korean J Food Culture. 2009;24(1):69-76. DOI: https://doi.org/10.7318/KJFC.2009.24.1.069
CrossRef - Kim S. S., Chung H.Y. Quality Comparison of Rice Cooked on Heat Plate, Induction Heat, and Heat Plate with Pressure. Korean J Food and Nutr. 2017;30(3):464-472. DOI: https://doi.org/10.9799/ksfan.2017.30.3.464.
- Han G. J., Park H. J., Lee H. Y., Park Y. H., Cho Y. S. The Quality of Cooked Rice Prepared by Both an Electric Cooker and Electric Pressure Cooker, with Different Storage Conditions. Korean J Food Cook Sci. 2007;23(5):635-643. https://koreascience.kr/article/ JAKO200706414140218.pdf.
- Kim D. H., Kim H. S. Descriptive Sensory Profiles for Cooked Rice by Various Rice Cookers. Korean J Food Cook Sci. 2007;23(5):777-784. https://koreascience.kr/article/JAKO200706414140841.pdf
- Raghubir P., Krishna A. Vital Dimensions in Volume Perception: Can the Eye Fool the Stomach?. JMR. 1999;36(3):313-26. DOI : http://doi.org/10.1177/002224379903600302.
CrossRef - Jung E. J., Kim D. G., Chang U. J. Comparative Analysis of the Intake Volume , Perception Volume, and Satiety Rate of an Augmented Rice Bowl with Elemated Bottom. J Korean Diet Assoc. 2022;28(1): 19-29.
- Hong H. S., Park S. J., Lee D. K., Lee H. J. Comparison of the Portion Sizes of Korean Adults across Eating Places: Korea National Health and Nutrition Examination Survey (2012–2016). JNH. 2020;53(6):676-87. DOI : http://doi.org/10.4163/jnh.2020.53.6.676.
CrossRef - National Institute of Agricultural Sciences. Korean Food Composition Database ver. 10.1. Wanju, Korea: National Institute of Agricultural Sciences, Rural Development Administration; 2023.
https://koreanfood.rda.go.kr/kfi/fct/ fctFoodSrch/list?menuId=PS03563. Updated May 2023. Accessed Jan 2020. - Kim N., Kim B. G., Jun S. H., Lee K., Oh T. J., Choi S. H., Lim S., Song S. H., Song W. H., Jang H.C. Evaluation of the Self-testing Blood Glucose Monitoring System GlucoDr.S according to ISO 15197:2013 Guidelines. LMO. 2018;8(3):77-86. DOI : http://doi.org/10.3343/lmo.2018.8.3.77.
CrossRef - Gunathilaka M. D., Ekanayake S. Effect of Different Cooking Methods on Glycemic Index of Indian and Pakistani Basmati Rice Varieties. Ceylon Med J. 2015;60(2):57-61. DOI : http://doi.org/10.4038/ cmj.v60i2.7545.
CrossRef - Akilen R., Deljoomanesh N., Hunschede S., Smith C. E., Arshad M. U., Kubant R., Anderson G. H. The Effects of Potatoes and Other Carbohydrate Side Dishes Consumed with Meat on Food Intake, Glycemia and Satiety Response in Children. Nutr Diabetes. 2016;6(2):e195. DOI: http://doi.org/10.1038/nutd.2016.1.
CrossRef - Park M. H., Chung S. J., Shim J. E., Jang S. H., Nam K. S. Effects of Macronutrients in Mixed Meals on Postprandial Glycemic Response. JNH. 2018;51(1):31-39. DOI: http://doi.org/10.4163/jnh.2018.51.1.31.
CrossRef - Jenkins D. J., Wolever T. M., Taylor R. H., Barker H., Fielden H., Baldwin J. M., Bowling A. C., Newman H. C., Goff D. V. Glycemic Index of Foods: A Physiological Basis for Carbohydrate Exchange. Am J Clin Nutr. 1981;34(3):362-326. DOI: http://doi.org/10.1093/ajcn/34.3.362.
CrossRef - Wolever T. M. Effect of Blood Sampling Schedule and Method of Calculating the Area under the Curve on Validity and Precision of Glycaemic Index Values. Br J Nutr. 2004;91(2):295-301. DOI: http://doi.org/10.1079/bjn20031054.
CrossRef - Flint A., Raben A., Blundell J. E., Astrup A. Reproducibility, Power and Validity of Visual Analogue Scales in Assessment of Appetite Sensations in Single Test Meal Studies. Int J Obes Relat Metab Disord. 2000;24(1):38-48. DOI: http://doi.org/10.1038/sj.ijo.0801083.
CrossRef - Jung E. Y., Suh H. J., Hong Y. H., Lee I. Y., Kim D. G., Kim M. O., Chang U. J. Effects of Glycemic Index for Boiled White Rice and Boiled White Rice Mixed with Grains on Food Consumption and Satiety Rate. J Korean Diet Assoc. 2009;15(2):179-187.
- Chiu Y. T., Stewart M. L. Effect of Variety and Cooking Method on Resistant Starch Content of White Rice and Subsequent Postprandial Glucose Response and Appetite in Humans. Asia Pac J Clin Nutr. 2013;22(3):372-379. DOI: http://doi.org/10.6133/apjcn.2013.22.3.08.
- Andersen S. S., Heller J. M., Hansen T. T., Raben A. Comparison of Low Glycaemic Index and High Glycaemic Index Potatoes in Relation to Satiety: a Single-Blinded, Randomised Crossover Study in Humans. Nutrients. 2018;10(11):1-15. DOI: http://dx.doi.org/10.3390/nu10111726.
CrossRef - Kim S. S., Chung H. Y. Quality Comparison of Rice Cooked on Heat Plate, Induction Heat, and Heat Plate with Pressure. Korean J Food Nutr. 2017;30(3):464-472. DOI: https://doi.org/10.9799/ ksfan.2017.30.3.464.
- Jung E. J., Chang U. J. Comparative Analysis of Perception Volume, Intake Volume, and Satiety Rate of Rice, Soup and Side Dishes using Tableware and Food Tray. J Korean Diet Assoc. 2020;26(4):269-277. DOI: https://doi.org/10.14373/JKDA.2020.26.4.269.
- Suh H. J., Jung E. Y. Effect of Food Service Form on Eating Rate: Meal Served in a Separated Form Might Lower Eating Rate. Asia Pac J Clin Nutr. 2016;25(1):85-8. DOI: http://doi.org/10.6133/apjcn.2016.25.1.12.
- Rolls B. J., Castellanos V. H., Halford J. C., Kilara A., Panyam D., Pelkman C. L., Smith G. P., Thorwart M. L. Volume of Food Consumed Affects Satiety in Men. Am J Clin Nutr. 1998;67(6):1170-1177. DOI: https://doi.org/10.1093/ajcn/67.6.1170.
CrossRef

This work is licensed under a Creative Commons Attribution 4.0 International License.


