Effect of Cooking and In Vivo Glycemic Response of Sri Lankan Traditional Rice: A Source of Sustainable and Underutilized Functional Food
Dona Lakmini Bhagya Kalugampitiya Arachchilage and Sagarika Ekanayake*
Department of Biochemistry, Faculty of Medical Sciences, University of Sri Jayewardenepura, Gangodawila, Nugegoda, Sri Lanka.
Corresponding Author E-mail: sagarikae@sjp.ac.lk
DOI : http://dx.doi.org/10.12944/CRNFSJ.12.1.32
Download this article as:
![]()
The availability of scientific information on the nutrient composition of cooked rice and glycemic responses of Sri Lankan traditional rice varieties with a high export potential is scarce. This study determined the nutrient composition (moisture, ash, crude fat, and protein, digestible (DC) and total carbohydrate (TC), resistant starch (RS), insoluble (IDF), soluble (SDF), and total dietary fiber (TDF)), amylose, amylopectin, and glycemic indices (GI) of sixteen cooked unpolished traditional rice varieties with standard methods. Cooked rice and rice flour contained 55.9-70.6% (fresh weight) and 6.2-9.5% (dry basis) moisture respectively. Ash, crude fat and protein contents were 1.1-1.6%, 4.1-6.0% and 4.8-9.5% respectively. Digestible carbohydrates comprised 73.8-83.8% with over 80% TC. Cooking increased the RS (1.3-5.5%) while IDF, SDF and TDF of cooked rice were 3.8-6.4%, 0.4-4.8%, and 5.4-9.8% respectively. All varieties contained high amylose (24.2-35.7%) except for one variety and elicited either low or medium GI (49-67). GI and amylose of cooked rice showed a significant (P=0.04) negative correlation. Significant (P≤0.05) positive correlation between moisture and rice portions containing 50g of carbohydrate allows the selection of rice that provides low glycemic loads. Unpolished traditional rice, rich in nutrients eliciting low or medium GI are highly suitable in diet plans for controlling the glycemic response and in achieving sustainable health benefits.
KEYWORDS:Cooked rice; Glycemic index; High amylose rice; Nutrient composition; Resistant starch; Traditional Sri Lankan rice
Introduction
Rice, the dietary staple plays a major role in providing a substantial proportion of energy and protein for Sri Lankans like other rice-consuming nations. In ancient times, Sri Lanka was known as ‘The granary of the East’ due to the existence and cultivation of over 1000 indigenous varieties of rice with an unparalleled irrigation system supporting rice cultivation.1 These traditional rice varieties had unique nutritional and functional properties as evidenced by folklores, indigenous and ayurvedic medicine practices where these have been used as a remedy for several diseases including malnutrition. Traditional rice varieties are components in remedies such as functional drinks (Peyawa), gruels made out of only water, rice, and salt (Lunu kenda), and gruel made with rice and green leafy vegetables (Kola kenda) with the knowledge handed down from generation to generation or according to directions of indigenous doctors.2 However, traditional rice had been replaced from regular farmer fields due to the introduction of new improved varieties following the green revolution in 1960s. These varieties produce higher yields and require comparatively lesser time to seed, grow and harvest, than the traditional varieties.1 Compared to newly improved varieties producing higher yields, traditional rice varieties could withstand extreme weather conditions, diseases, and pests which are major problems associated with sustainable rice cultivation.3
Rice, the dietary staple, is the primary source of carbohydrates for Sri Lankans as well as other Asians and the increased consumption of highly refined newly improved rice consumption is identified as one reason for the increased prevalence of non-communicable diseases (NCDs).4 Digestibility of starch depends on inherent properties such as amylose: amylopectin ratio, other nutrients, and dietary fiber in addition to extrinsic factors such as storage, processing method, and interaction with components of a meal.5
Glycemic index (GI) which reflects the quality of carbohydrates and thus the postprandial glycemic response is important in identifying starchy foods suitable for consumption for lowering the intake of glycemic load (GL) and energy. However, the glycemic indices (GI) of rice differ widely from as low as 59 to high as 109.6 GI range of improved Sri Lankan varieties was between 56-737, and parboiled Nadu, samba and basmati varieties available in the market elicited low, medium, and high GI respectively.8
An upward trend in health-conscious diet consumption among Sri Lankans due to the high prevalence of NCDs9 has increased the demand for traditional rice varieties during the past decade. In addition, these varieties have a high export potential due to the many health benefits attributed. However, the availability of scientific data on cooked traditional rice in terms of nutritional quality and GI is not satisfactory. The present study is an attempt to address the shortage of scientific data on nutritional quality, glycemic responses, and some factors that contributes to the variation in GI of less commonly consumed sixteen Sri Lankan traditional rice varieties.
Material and methods
Materials
Less commonly consumed paddy varieties harvested in the Yala season (2018), i:e, Pokkali, Murugakayan, Rathdel, Madathawalu, Kuruluthuda, Pachchaperumal, Suduheenati, Suwadel, Kaluheenati were obtained through Rice Research Institute (RRI), Bathalegoda, Sri Lanka and Mavee, Masuran, Gonabaru, Kahamala, Kahawanu, Hetadawee, Behethheenati (Figure 1) were collected from an authentic traditional rice supply center (Paramparika Govi Urumayan Rekime Wyaparaya, Circular Rd, Homagama, Sri Lanka). Thus, collected paddy, were stored under temperature-controlled conditions and dehulled (Satake THU 35B), and used for the study.
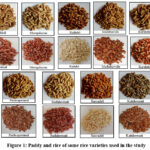 |
Figure 1: Paddy and rice of some rice varieties used in the study. |
Methods
Rice and flour preparation
Cleaned dehusked, unpolished rice was washed, and cooked for 30 to 60 minutes (350-500 mL water /100g rice) as required for each variety and used for glycemic index determination. For chemical analyses cooked rice was sun dried (2-3 days) and dried at 50oC (3-4 hours; Memmert, Germany). Dried cooked rice was milled (IKA ® A11 basic, New Zealand), sieved (100 mesh sieve), stored (-20 oC) in tightly closed containers until analyses.
Coconut gravy preparation
For GI determination portions of rice containing 50g of digestible carbohydrate were offered with coconut gravy. Coconut gravy was prepared by mixing and extracting scraped coconut (100 g) with water (100 mL) to obtain the first extraction (100 mL) and the residue with 125 mL of water to obtain the second extraction of coconut milk (125 mL). Both extractions were mixed with onions (10 g), curry leaves (5 g), garlic (5 g), fenugreek (1 g), turmeric powder (2.5 g), and 3 g of salt and cooked with continuous stirring until boiling and continued for five minutes and prepared freshly on each day of GI studies.
Proximate composition
Moisture, ash, crude protein10, and crude fat11 contents were analyzed by standard methods. Digestible carbohydrate, total carbohydrate, and resistant starch were determined by enzymatic gravimetric methods (Megazyme assay kit, Ireland). Insoluble and soluble dietary fiber were analyzed by total dietary fiber assay kit (TDF 100A-1KT, Sigma-Aldrich).
Amylose and amylopectin
The method described by Juliano12 was used in determining the amylose content. Amylopectin content was obtained by subtracting amylose percentage by 100 for each variety.
In vivo glycemic response
Glycemic index (GI) was determined using FAO/WHO13 procedure using glucose as the reference food (gsk Glaxo Wellcome Ceylon Ltd, Sri Lanka). Apparently healthy (n=30, age 20-30 years), consenting volunteers (BMI range of 18.5-23 kg/m2) not on medical treatment were enrolled for the study. The day before the test, subjects were advised to maintain their usual diet and other habits but refrain from vigorous exercise, smoking, or consuming diets high in fat or carbohydrate.14 Subjects were requested to report to the laboratory after an 8-10 hr fast and on arrival fasting blood glucose was determined. Subjects were given a portion of 50 g of standard with 250 mL of water to be ingested within 15 min and blood glucose was determined at 30, 45, 60, and 120 min (GOD-PAP, Biolabo, France) using capillary blood drawn by finger prick (100 µL; Accu Check pricking device). The standard was administered twice during the study. The procedure was repeated on subsequent days following ingestion of portions of 50g available carbohydrate of cooked traditional rice with approximately 70 mL of coconut gravy. GI was obtained by percentage ratio of IAUC of blood glucose for the standard (glucose) and each rice variety and by averaging the GI of 10 participants. Glycemic loads of traditional rice were calculated with available digestible carbohydrates in the given portion and the GI of each rice variety.
Statistical analyses
Data are presented as mean±SD for measured chemical parameters and GI as mean±SEM. Significances were expressed at 95% confidence interval with ANOVA Tukey’s posthoc test. Pearson’s correlation coefficient was used for correlation analysis. Data were analyzed using statistical software (SPSS 24, 2016) and Microsoft office Excel 2010.
Ethical clearance
Ethical clearance for the in vivo study was acquired from the Ethics Review Committee, Faculty of Medical Sciences, University of Sri Jayewardenepura (ERC no: 10/17), Sri Lanka. Informed written consent was obtained from the volunteers before the study commenced. The volunteers were informed that they could withdraw from the study at any time.
Results and Discussion
Proximate composition (moisture, crude protein, crude fat, ash, digestible and total carbohydrate), dietary fiber (soluble, insoluble, total dietary fiber), glycemic indices, and the contributions of amylose and resistant starch in addition to other nutrients to the GI of 16 not commonly available whole grain rice were studied. Whole grains were studied as consumption of whole grains is widely known to confer many health benefits compared to polished rice15. The moisture content of cooked rice and cooked rice flour, ash, crude fat, and protein of cooked rice flour are stated in Table 1.
Table 1: Moisture (cooked rice and cooked rice flour), ash, crude fat, and protein of traditional rice flour (mean±SD; g/100g dry basis).
|
Rice varieties |
Moisture (cooked rice; WB) |
Moisture (cooked rice flour)
|
Ash
|
*Crude fat
|
**Crude protein |
|
Pokkali |
60.3± 0.6a |
8.8± 0.0a |
1.2± 0.0a |
4.6± 0.2a |
9.3± 0.2a |
|
Murugakayan |
66.0± 1.3bd |
8.0± 0.1b |
1.4± 0.1bd |
4.1± 0.4bc |
6.9± 0.2c |
|
Rathdel |
64.8± 0.8bd |
8.6± 0.2c |
1.5± 0.0c |
4.4± 0.3c |
8.5± 0.2b |
|
Madathawalu |
62.2± 2.3ac |
6.2± 0.2j |
1.5± 0.1ce |
4.3± 0.4c |
7.8± 0.1b |
|
Kuruluthuda |
61.9± 2.2ac |
8.6± 0.2c |
1.4± 0.0bd |
5.1± 0.2d |
8.7± 0.1b |
|
Pachchaperumal |
61.8± 2.4a |
8.0± 0.2b |
1.5± 0.1ce |
4.2± 0.4bc |
8.2± 0.2b |
|
Suduheenati |
67.7± 1.0d |
8.9± 0.1ad |
1.5± 0.0c |
5.5± 0.2e |
9.2± 0.2ab |
|
Suwadel |
55.9± 1.1i |
9.5± 0.7e |
1.6± 0.0e |
5.5± 0.1e |
9.5± 0.1a |
|
Kaluheenati |
70.5± 0.3e |
8.6± 0.3c |
1.4± 0.1bd |
4.5± 0.3a |
8.5± 0.2b |
|
Mavee |
65.2± 2.2bd |
7.5± 0.1f |
1.3± 0.0b |
4.9± 0.2ade |
9.2± 0.3a |
|
Masuran |
70.6± 0.3e |
7.6± 0.1f |
1.5± 0.0c |
6.0± 0.3f |
7.4± 0.1c |
|
Gonabaru |
66.3± 1.0bd |
9.3± 0.1e |
1.1±0.1a |
4.4± 0.1c |
5.9± 0.3e |
|
Kahawanu |
67.4± 0.7d |
8.2± 0.3bc |
1.5± 0.1ce |
4.7± 0.2a |
8.2± 0.1b |
|
Kahamala |
65.6± 0.5bd |
9.4± 0.2e |
1.7± 0.2e |
5.2± 0.1d |
4.8± 0.1f |
|
Hetadawee |
62.4± 1.9ac |
9.1± 0.1a |
1.6± 0.1e |
5.4± 0.3e |
7.2± 0.2d |
|
Behethheenati |
63.9± 0.9c |
9.4± 0.5e |
2.0± 0.1f |
5.3± 0.2e |
7.4± 0.6d |
n= 6; *n= 5; **n= 3; SD: Standard deviation ; WB: Wet basis; Different superscripts in each column indicate significances at 95% confidence interval
The moisture of cooked rice varied between 55.9- 70.6% where both Masuran and Kaluheenati varieties retained the highest (P≤0.05) amount. Except Suwadel (56%), the cooked rice comprised moisture over 60% of their weight. The moisture and ash contents of cooked rice flour varied between 6.2-9.5% and 1.1-2% respectively. Cooked polished varieties had less than 0.6% of ash16 where removal of outer layers had contributed to a significant decline in mineral content.
The crude fat content of cooked varieties was 4.1-6.0% whereas Masuran (6.0%) contained significantly (P≤ 0.05) high fat. The crude fat of uncooked traditional rice was 1.5- 3.5% 17-19 except in a few varieties.20 Some cooked traditional varieties contained lower fat 0.6-2.5%.16,21 In the present study, the fat content was determined without heating compared to methods used in other studies. In addition, unpolished rice as in the present study retains both the bran and the germ that accommodate fat in the grain.21
The amount of protein in uncooked and cooked rice flour varied between 4.8-9.5%. Out of the analyzed varieties Pokkali, Suduheenati, Suwadel, and Mavee had significantly high (P≤0.05) crude protein. According to many studies17-20 uncooked traditional rice flour consists of 7-13% protein which is higher than found in improved varieties which had lower protein (5.9-9.2%).8,23-24 Thus consumption of traditional rice or foods made with such rice flour could contribute to a sustainable increase in protein intake.
Digestible carbohydrates, resistant starch, total carbohydrate, insoluble, soluble, and total fiber of traditional rice flour are stated in Table 2. Digestible and total carbohydrate contents varied between 73.8-83.8% and 78.3-86.5% respectively. Carbohydrate, being the prominent nutrient comprised more than 70% of the weight in cooked rice flour and contributes to glycemic response and energy. The contents compared well with reported values for other traditional rice varieties.17-18,20
The resistant starch (RS) content of cooked flour of 16 varieties varied between 1.2-5.5% and this is the first report on resistant starch of cooked Sri Lankan traditional rice. An apparent increase in RS was observed in rice varieties following cooking compared to raw rice flour thus proving their probiotic potential. Cooked Pokkali, Gonabaru, and Kahamala contained more than 5% resistant starch (P≤0.05). Elevated levels of resistant starch in foods reduce caloric density due to minimal digestibility. The combination of temperature, moisture, and time decreases the digestibility of starch and increases the resistant starch in foods.25
Insoluble and soluble fiber contents of rice varied between 3.3-6.4% and 0.4-4.8% respectively. The total fiber content of the varieties was between 5.4-9.8%. Varieties Rathdel, Kuruluthuda, Mavee, and Kaluheenati had significantly (P≤0.05) high insoluble dietary fiber (>6%) whereas Madathawalu and Pachchaperumal had significantly (P≤0.05) high soluble fiber (>4.8%). The total dietary fiber content was highest in Kuruluthuda (9.8%) and Madathawalu (8.6%) varieties. Cooked rice flour had high (P≤0.05) dietary fiber compared to uncooked (unpublished data) which could be due to the contribution of increased resistant starch following cooking (Table 2). Foods containing resistant starch have lower digestible carbohydrate contents and relatively increased dietary fiber content.25
Table 2: Digestible carbohydrate, resistant starch, total carbohydrate, insoluble, soluble, and total fiber contents of traditional rice flour (mean±SD; g/100g dry weight).
|
Rice varieties |
Digestible carbohydrate |
Resistant starch |
Total carbohydrate |
Insoluble fiber |
Soluble fiber |
Total fiber |
|
Pokkali |
77.2± 1.7a |
5.3± 1.2a |
82.5± 1.1a |
4.7± 0.4ae |
1.7± 0.3a |
6.4± 0.7a |
|
Murugakayan |
83.2± 1.1b |
3.2± 1.2c |
86.3± 1.0b |
4.3± 0.1a |
1.1± 0.2b |
5.4± 0.2b |
|
Rathdel |
79.6± 1.1c |
4.1± 1.1b |
83.7± 1.0ci |
6.4± 0.2b |
1.1± 0.1b |
7.4± 0.3d |
|
Madathawalu |
73.8± 1.2f |
4.6± 1.6ab |
78.3± 1.4gh |
3.8± 0.1c |
4.8± 0.5c |
8.6± 0.4ce |
|
Kuruluthuda |
78.8± 0.1c |
2.6± 0.6c |
81.5± 0.6g |
6.3± 0.6b |
2.7± 0.6d |
9.8± 0.9e |
|
Pachchaperumal |
79.4± 0.9c |
3.9± 0.4b |
83.3± 0.3d |
3.3± 0.2c |
5.1± 1.7c |
8.4± 1.9c |
|
Suduheenati |
80.4± 1.7g |
3.9± 0.5b |
84.3± 1.1d |
4.6± 0.3ae |
1.8± 0.3a |
6.3± 0.9b |
|
Suwadel |
77.0± 1.3a |
4.4± 0.9ab |
81.4± 0.9f |
4.5± 0.2ae |
2.9± 0.2d |
7.4± 0.3d |
|
Kaluheenati |
81.6± 1.2b |
1.3± 0.5d |
82.9± 0.5c |
6.0± 0.8b |
1.2± 0.2e |
7.3± 0.7d |
|
Mavee |
83.8± 0.7b |
1.2± 0.2d |
84.9± 1.1e |
6.1± 0.8b |
0.7± 0.2f |
6.4± 0.7a |
|
Masuran |
78.2± 1.8ac |
2.9± 0.9c |
81.1± 0.9a |
5.0± 0.2e |
0.4± 0.2f |
5.4± 0.8b |
|
Gonabaru |
81.4± 0.6e |
5.1± 0.6a |
86.5± 0.5e |
5.3± 0.5e |
2.1± 0.4g |
7.4± 1.0d |
|
Kahawanu |
79.1± 1.1g |
1.6± 0.2d |
80.7± 0.9fg |
4.9± 0.8ae |
1.0± 0.4e |
6.0± 1.0ab |
|
Kahamala |
80.4± 1.0e |
5.5± 0.4a |
85.9± 0.4b |
4.9± 0.2ae |
1.5± 0.3a |
6.3± 0.4ab |
|
Hetadawee |
83.4± 0.6b |
2.3± 0.8cd |
85.6± 0.7b |
5.2± 0.5e |
0.8± 0.2e |
6.0± 0.4ab |
|
Behethheenati |
83.4± 0.6b |
1.3± 0.6d |
84.7± 0.5i |
4.8± 0.2d |
1.9± 0.3g |
6.7± 0.2a |
n= 4, SD: Standard deviation ; Different superscripts in columns indicate significances at 95% confidence interval
Thus, these data prove that unpolished Sri Lankan traditional rice varieties are relatively better sustainable sources of energy, minerals, proteins, and fat than improved polished varieties and may impact to augment the nutrient intake as the portion of rice consumed is large in rice-eating populations.
The amylose content of cooked rice flour varied between 24.2-35.7 µg/mL with amylose/amylopectin ratios between 0.32-0.56 (Table 3). Varieties Pachchaperumal and Rathdel had the highest amylose and amylose/ amylopectin ratio (P≤0.05). Except for the variety Kahawanu, all other varieties were categorized as high amylose varieties as cooked rice flour contained more than 25% of amylose.26
Table 3: Amylose and amylopectin of cooked traditional rice flour (mean± SD; µg/mL)
|
Varieties |
Amylose |
Amylopectin |
Amylose/ Amylopectin |
Category on |
|
Pokkali |
32.3± 0.4a |
67.7± 0.4a |
0.48± 0.01a |
High |
|
Murugakayan |
29.1± 0.6d |
70.9± 0.6d |
0.41±0.01 d |
High |
|
Rathdel |
34.5± 0.2ae |
65.5± 0.2ae |
0.53± 0.01be |
High |
|
Madathawalu |
33.6± 0.8b |
66.4± 0.8b |
0.51± 0.01b |
High |
|
Kuruluthuda |
27.4± 0.5c |
72.6± 0.5c |
0.38± 0.01c |
High |
|
Pachchaperumal |
35.7± 0.4e |
62.3± 0.4e |
0.56± 0.01e |
High |
|
Suduheenati |
33.3± 0.9b |
66.7± 0.9b |
0.50± 0.02b |
High |
|
Suwadel |
26.2± 0.3c |
73.8± 0.3c |
0.35± 0.01c |
High |
|
Kaluheenati |
33.5± 0.2b |
66.± 0.2b |
0.50± 0.01b |
High |
|
Mavee |
32.6± 0.6b |
67.4± 0.6b |
0.48± 0.01a |
High |
|
Masuran |
30.2± 0.5d |
69.8± 0.5d |
0.43± 0.01d |
High |
|
Gonabaru |
27.2± 0.5c |
72.8± 0.5c |
0.37± 0.01c |
High |
|
Kahawanu |
24.2± 0.6f |
75.8± 0.6f |
0.32± 0.01f |
Intermediate |
|
Kahamala |
32.9± 0.4b |
67.1± 0.4b |
0.49± 0.01a |
High |
|
Hetadawee |
31.5± 0.8a |
68.4± 0.8a |
0.46± 0.02a |
High |
|
Behethheenati |
27.0± 0.7c |
73.0± 0.7c |
0.37± 0.01c |
High |
n= 4; SD: Standard deviation; Different superscripts in columns indicate significances at 95% confidence interval
Cooking has contributed to increasing the amylose content in all varieties which had intermediate amylose contents in the uncooked state (unpublished data). Further, a non-significant positive correlation (P=0.36) was observed between amylose and resistant starch in cooked rice. Thus, increased amylose in cooked rice is a reflection of the resistant starch content. The increase in resistant starch was higher than that of amylose following cooking due to some amylose being converted to RS thus reducing the significance when compared with uncooked rice flour (unpublished data).
Portion sizes of rice given to determine the GI, peak reduction relative to glucose, glycemic index, and glycemic load data are stated in Table 4. Glycemic indices (GI) of the studied 16 varieties varied from 49-67 and were categorized as either medium or low despite the same amount of carbohydrate being ingested indicating differences in digestibility and availability in contrast to commonly consumed raw (Kekulu) varieties with high GI.27
Table 4: Portion size, incremental area under the curve (IAUC), glycemic index (GI), and glycemic load (GL) of traditional rice
|
Traditional rice |
Portion size (g) |
IAUC |
GI± SEM |
GL for a given portion |
Edible portion (g) |
GL for edible portion |
|
Pokkali |
163 |
2059 |
53± 5 |
27 |
122 |
20 |
|
Murugakayan |
177 |
2717 |
63± 5 |
32 |
118 |
21 |
|
Rathdel |
179 |
2588 |
51± 4 |
26 |
119 |
17 |
|
Madathawalu |
179 |
2147 |
56± 5 |
28 |
119 |
19 |
|
Kuruluthuda |
166 |
2539 |
64± 5 |
32 |
125 |
24 |
|
Pachchaperumal |
165 |
1806 |
49± 3 |
25 |
124 |
18 |
|
Suduheenati |
193 |
1912 |
55± 6 |
28 |
129 |
18 |
|
Suwadel |
147 |
2183 |
60± 6 |
30 |
110 |
23 |
|
Kaluheenati |
208 |
2068 |
61± 5 |
30 |
139 |
20 |
|
Mavee |
171 |
3009 |
60± 6 |
30 |
114 |
20 |
|
Masuran |
218 |
2734 |
67± 5 |
34 |
145 |
22 |
|
Gonabaru |
183 |
2330 |
63± 7 |
32 |
122 |
21 |
|
Kahawanu |
194 |
2609 |
56± 6 |
28 |
129 |
19 |
|
Kahamala |
181 |
2499 |
54± 4 |
27 |
121 |
18 |
|
Hetadawee |
160 |
2221 |
51± 5 |
26 |
120 |
17 |
|
Behethheenati |
166 |
2733 |
58± 5 |
29 |
125 |
19 |
n= 10; SEM – Standard Error Mean; Glucose IAUC =3050-5495
Present study included both red and white traditional rice varieties and no correlation was observed between glycemic index and the color of the pericarp as reported for improved7 and other traditional rice.16 These results further prove the glycemic indices of rice are not dependent on the pericarp color in contrast to popular belief among people.
The average blood glucose peaks of standard and rice were observed at 30 min (Figure 2: a and b). Blood glucose peak reduction following consumption varied between 3.2-14.7% compared to glucose. The highest reduction in peak glucose was observed in Pachchaperumal which had the highest soluble dietary fiber (5.1%). Glycemic response curves of all the varieties indicated an increase followed by a rapid decline compared to glucose demonstrating that the blood glucose after consuming all these rice varieties even when given without accompaniments could remain low. Lower peaking and rapid decline of blood glucose could be due to slower digestion of carbohydrates due to the nature of starch (high or intermediate amylose), protein, dietary fiber, and resistant starch.
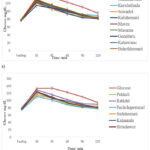 |
Figure 2: Average (±SEM) glucose responses of a) medium GI rice varieties and glucose b) low glycemic index rice varieties and glucose |
A significant (P≤0.05) negative association between GI and amylose content of cooked rice was apparent (Figure 3). High amylose ensures less glucose release by α-amylase. However, despite having high amylose, rice elicits different GI (low to medium) which could be due to the chemical structure, particularly the ratio of amylose to amylopectin, the constituent fractions, as well as functionality of starches. The nature of type 3 RS varies with molecular weight, dispersibility, and crystallinity and affects the rate of digestibility. High molecular weight, narrow dispersion, and A-type crystals resist digestion.28
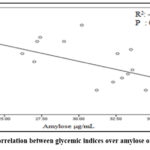 |
Figure 3: Correlation between glycemic indices over amylose of cooked rice |
Glycemic indices of examined varieties had insignificant (P≥0.05) negative correlations with ash, protein, and total dietary fiber in 50g available carbohydrate portion. Rice grains that comprised more than 5.5% protein were considered as low glycemic index with a reduction of 6.44% in glycemic index per 1% increase in grain protein.21 All studied rice were unpolished and except Kahamala other varieties had more than 5.5% of protein. Thus, protein content could also have contributed to the lower glycemic index of these varieties in comparison to commonly consumed raw rice8 which contained lower protein (<5%).
The rate of digestion and blood glucose response were lower with under-milled rice compared to highly milled rice due to the inability of digestive enzymes to act upon starch of under-milled rice. Bran, a rich source of phytic acid and polyphenols, contributes to decreasing the rate of starch digestion and lowers the blood glucose response.29 Epidemiological and clinical trials have related the intake of grains without milling to reduced risk of chronic diseases such as diabetes.15 Thus, consumption of traditional under-milled rice with low or medium GI is recommended for individuals with diabetes and other NCDs.
A negative correlation (P≥0.05) was observed between resistant starch of cooked flour and glycemic indices. The cooking process also contributed to increasing the resistant starch content which may have partly contributed to decreasing the glycemic indices of the rice. Amylose retrogrades during processing and become less susceptible to digestion. Thus, the high amylose in these varieties may have contributed to the RS and lowered the GI.
The carbohydrate load or the glycemic load depends on the portion size of the rice sample one consumes. High glycemic load (GL) values were obtained for all the tested portions of rice. When portion size was reduced to the preferred edible portion size the glycemic load of Rathdel, Madathawalu, Pachchaperumal, Suduheenati, Kahawanu, Kahamala, Hetadawee, and Behethheenati had medium glycemic loads. The volume of rice containing 50 g of digestible carbohydrate increased significantly (P=0.000) when rice contained high moisture (Figure 4). Therefore, the actual portion that could be consumed and thus the carbohydrate load of varieties that absorb a high amount of moisture during cooking is less. Consequently, the moisture content of cooked rice will be an important determinant in determining the edible portion and thus the glycemic load.
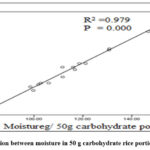 |
Figure 4: Correlation between moisture in 50 g carbohydrate rice portion vs. portion size. |
The glycemic load had a negative correlation (P≥0.05) with total dietary fiber in the consumed rice portion. Thus, further reduction of glycemic index and glycemic load of rice could be achieved with the addition of accompaniments such as vegetables, legumes, and green leafy vegetables to the meal. Glycemic index and GL of rice mixed meals when incorporated with increasing proportions of dietary fiber reduced significantly.27 Low glycemic index and high fiber meals support reducing post-prandial glycemic response and increase satiety.30 The studied traditional rice all of which elicited either low or medium GI will elicit further reduced glycemic response when consumed with other accompaniments.
Conclusion
The varieties of traditional rice analyzed in this study were dehulled retaining the aleurone and germ, conserving most of the nutrients. Thus, the varieties contained high protein with cooked rice varieties Suwadel, Mavee, Pokkali, and Suduheenati having more than 9% of protein. Mineral, crude fat, and dietary fiber contents were also relatively higher than in polished improved varieties. Glycemic indices of the varieties were either low (Pokkali, Rathdel, Pachchaperumal, Suduheenati, Kahamala, and Hetadawee) or medium (Murugakayan, Madathawalu, Kuruluthuda, Suwadel, Kaluheenati, Mavee, Masuran, Gonabaru, Kahawanu, and Behethheenati) independent of the pericarp color. Fifteen rice varieties were of high amylose rice and the increase in resistant starch following cooking contributed significantly to decreasing the glycemic indices of these rice varieties which may confer probiotic potential. Glycemic loads for all varieties were high for the portion given to study the glycemic index (glycemic load ≥20) which declined when actual edible portions were considered. The moisture in cooked rice contributes significantly to increasing the volume of rice and thus decreases the carbohydrate load of a rice portion. A further decrease in GL could be achieved when these varieties are consumed as part of a meal. The high nutrient content, high RS, high amylose, and suitability as a staple with low available calories giving rise to low glycemic response, these Sri Lankan traditional rice varieties can be highly suitable in diet plans for controlling the glycemic response and in achieving sustainable health benefits. In addition, such benefits make these varieties to have a high export potential.
Acknowledgment
The authors acknowledge the volunteers who participated in the glycemic index study.
Funding Sources
This work was supported by the University of Sri Jayewardenepura, Sri Lanka [ASP/01/RE/MED/2016/51].
Conflict of Interest
The authors declare no conflict of interest.
Authors’ Contribution
DLBKA: Investigation, Data curation, Methodology, Project administration; Writing – Original draft; SE: Conceptualization; Funding acquisition; Methodology; Project administration; Supervision; Writing- Reviewing and Editing
Data Availability
The manuscript incorporates all data sets produced throughout the research study.
References
- Rambukwella, R., Priyankara, E.A.C., 2016. Production and Marketing of Traditional Rice Varieties in Selected Districts in Sri Lanka: Present Status and Future Prospects Research; Report No: 195, Hector Kobbekaduwa Agrarian Research and Training Institute 114, Wijerama Mawatha Colombo 7, Sri Lanka.
- Withanawasam, M.D., 2017. Heritage of Heirloom Rice varieties of Sri Lanka. Regional Rice Research Centre Bombuwela, pp 1-14. RRDI_Downloads_Leaflets – Department of Agriculture Sri Lanka (doa.gov.lk) [Accessed on July 2022]
- Sharma, G., Rai, L.K., 2010. Climate change and sustainability of agro diversity in traditional farming of the Sikkim Himalaya. Mountain Institute of India, United Nations University, Tokyo and Mac Arthur Foundation.
- Golozar, A., Khalili, D., Etemadi, A., Poustchi, H., Fazeltabar, A., Hosseini, F., Kamangar, F., Farhadislami, M. K., Hadaegh, F., Brennan, P., Boffetta, P., Abnet, C.C., Dawsey, S. M., Azizi, F., Malekzadeh, R., Danaei, G. White rice intake and incidence of type-2 diabetes : analysis of two prospective cohort studies from Iran. BMC Public Health. 2017;17:133. https://doi.org/10.1186/s12889-016-3999-4.
CrossRef - M. R., Farahnaky, A., Santhakumar, A. B., Vito, P. O., Butardo M. Jr., Blanchard C. L. Intrinsic and extrinsic factors affecting rice starch digestibility. Trends Food Sci. Technol. 2019;88:10-22. https://doi.org/10.1016/j.tifs.2019.02.012
CrossRef - Frei, M., Siddhuraju, P., Becker, K. Studies on the in vitro starch digestibility and the glycemic index of six different indigenous rice cultivars from the Philippines. Food Chem. 2003;83:395-402. https://doi.org/10.1016/S0308-8146(03)00101-8
CrossRef - Hettiarachchi, P., Jiffry, M., Jansz, E., Wickramasinghe, A., Fernando, D., 2001. Glycaemic indices of different varieties of rice grown in Sri Lanka. Ceylon Medical Journal (CMJ). 2001;46:11-14. https://doi.org/10.4038/cmj.v46i1.6516
CrossRef - Nisanka, T. U. S., Ekanayake, S. Rice variety and processing: contribution to glycaemic response. Ceylon Medical Journal (CMJ). 2016;61:159-162. http://doi.org/10.4038/cmj.v61i4.8381
CrossRef - World Health Organization. Non-communicable diseases Sri Lanka 2018 country profile. Non-communicable diseases country profiles. 2018. https://www.who.int/news-room/fact-sheets/detail/ noncommunicable-diseases. [Accessed on September 2020]
- Association of Official Analytical Chemists. Official Methods of Analysis. The Association of Official Analytical Chemists. 18th ed., Gaithersburg, MD, USA; 2005.
- Croon, L.B., Fuchs, G. Fatthaltsbestamning I mjol och mjolprodketer (Crude fat analysis of different flours and flour products). Var Foda. 1980;32:425-427.
- Juliano, B.O., Criteria and tests for rice grain qualities. In: Juliano Bienvenido O. (Ed), Rice Chemistry and Technology. 2nd Edition. AACC, St. Paul, Minn., USA. 1985:443-524.
- FAO/WHO. Carbohydrates in human nutrition: report of a joint FAO/WHO expert consultation. Rome. FAO Food Nutr. Pap. 1998;66:1-140. [Accessed on March, 2020].
- Brouns, F., Bjorck, I., Frayn, K. N., Gibbs, A. L., Lang, V., Slama, G., Wolever, T. M. Glycaemic index methodology. Nutr. Res. Rev. 2005;18:145-71. DOI: 10.1079/NRR2005100
CrossRef - Pereira, E. V., Costa, J. de A., Alfenas, R. de C. G. Effect of glycemic index on obesity control. Arch. Endocrinol. Metab. 2015;59:245–251. 10.1590/2359-3997000000045
CrossRef - Pathiraje, P., Madhujith, W., Chandrasekara, A., Nissanka, S. The effect of rice variety and parboiling on in vivo glycemic response. Trop. Agric. Res. 2010;22:26-33.
CrossRef - Kulasinghe, A., Samarasinghe, G., Wimalasiri, S., Silva, R., Madhujith, T. Macronutrient and mineral composition of selected traditional rice varieties in Sri Lanka. Proceedings of the International Conference on Food Quality, Safety and Security. 2017;1:1-8. https://doi.org/10.17501/ foodqualss.2017.1201
CrossRef - Kariyawasam, T. I., Godakumbura, P. I., Prashantha, M. A. B., Premakumara, G. A. S. Proximate composition, calorie content and heavy metals (As, Cd, Pb) of selected Sri Lankan traditional rice (Oryza sativa L.) varieties. Procedia Food Sci. 2016;6:253–256.
CrossRef - Samaranayake, M. D. W., Yathursan, S., Abeysekera, W.K.S.M., Herath, H. M. T. Nutritional and antioxidant properties of selected traditional rice (Oryza sativa L.) varieties of Sri Lanka. Sri Lankan Journal of Biology (SLJB). 2017;2:25-35.
CrossRef - Abeysekera, W.K.S.M., Arachchige, S.P.G., Ratnasooriya, W. D., Chandrasekharan, N.V., Bentota, A.P. Physicochemical and nutritional properties of twenty three traditional rice (Oryza sativa L.) varieties of Sri Lanka. J. Coastal Life Med. 2017;5:343–349. http://dx.doi.org/10.12980/jclm.5.2017J7-59
CrossRef - Hafeel, R.F., Amararathna, L.B.A.P., Chamintha, T.H.T., Bentota, A.P., Abeysiriwardana, D.S.D.E. Glycemic index of improved rice varieties as influenced by degree of polishing and proximate composition including amylose content. Tropical Agriculturist. 2016;164:83-96.
- Chapagai, M. K., Wan Rosli, W. I., Wan Manan, W. M., Jalil, R. A., Karrila, T., Pinkaew, S. Effect of domestic cooking methods on physicochemical, nutritional and sensory properties of different varieties of brown rice from Southern Thailand and Malaysia. Int. Food Res. J. 2017;24:1140–1147.
- Hettiaratchi, U., Ekanayake, S., Welihinda, J. Do Sri Lankan meals help decrease blood glucose response ? Ceylon Medical Journal (CMJ). 2009;54:39-45. https://doi.org/10.4038/cmj.v54i2.793
CrossRef - Gunaratne, A., Bentota, A., Cai, Y. Z., Collado, L., Corke, H. Functional, digestibility, and antioxidant properties of brown and polished rice flour from traditional and new-improved varieties grown in Sri Lanka. Starke. 2011;63:485–492. https://doi.org/10.1002/star.201000105
CrossRef - Thompson, D. B. Strategies for the manufacture of resistant starch. Trends Food Sci. Technol. 2000;11:245–253. https://doi.org/10.1016/S0924-2244(01)00005-X
CrossRef - Suwannaporn, P., Pitiphunpong, S., Champangern, S. Classification of rice amylose content by discriminant analysis of physicochemical properties. Starke. 2007;59:171-177. doi:10.1002/star.200600565
CrossRef - Hettiaratchi, U.P.K., Ekanayake, S., Welihinda, J. Sri Lankan rice mixed meals: Effect on glycaemic index and contribution to daily dietary fiber requirement. Malaysian Journal of Nutrition (MJN). 2011;17:97-104.
- C.E., Buwalda, P.L., Leemhuis, H., de Vos, P., Schols, H. A., Bitter J. H. Digestibility of resistant starch type 3 is affected by crystal type, molecular weight and molecular weight distribution. Carbohydr. Polym. 2021;265:118069. https://doi.org/10.1016/j.carbpol.2021.118069
CrossRef - Panlasigui, L. N., Thompson, L. U. Blood glucose lowering effects of brown rice in normal and diabetic subjects. Int. J. Food Sci. Nutr. 2006;57:151-158. http://doi.org/10.1080/09637480500410879
CrossRef - Havel, P.J. Peripheral signals conveying metabolic information to the brain: Short-term and long-term regulation of food intake and energy homeostasis. Exp. Biol. Med. (Maywood). 2001;226:963-977. https://doi.org/10.1177/153537020122601102
CrossRef
Accepted on: 22 Feb 2024
Second Review by: Lyudmila Musatov
Final Approval by: Dr. Ardiansyah


Web of Science Coverage
Emerging Sources Citation Index (ESCI)
2024 Journal Impact Factor: 1.1
Scopus Journal Metrics
CiteScore 2025: 2.6
CiteScore Details
Sustainable Nutrition: Food Systems, Nutrient Retention, and Public Health Impact
![]()
This journal is a member of, and subscribes to the principles of, the Committee on Publication Ethics (COPE)


