
Introduction
Over the years, agricultural-based industries in Malaysia have been considered an essential sector that significantly contributes to the country’s economy 1. While this has a positive economic effect, it has also contributed to environment issues due to the increased production of agricultural waste, such as seeds, skins, peels, and pomace 2. Some of these waste materials contain abundant sources of bioactive compounds, fibers, and other beneficial substances3. While most of the agricultural waste generated is occasionally utilized as livestock feed, yet it is predominantly disposed of as waste, leading to myriad environmental issues4. These include water pollution, greenhouse gas emissions, and air pollution 4,5. Therefore, there is an urgent need to valorize these wastes into useful food ingredients 6.
Jackfruit (Artocarpus heterophyllus) is a highly sought-after fruit crop widely cultivated in tropical countries such as Malaysia, Thailand, and Indonesia 7. The Ministry of Agriculture Malaysia reported that the production of jackfruit showed a positive trend from 29,577.68 metric tonnes (mt) in 2015 to 41,047.20 mt in 2021 8. The increase demand in jackfruit is expected to add value to jackfruit product which would ultimately contribute to the agricultural gross domestic product (GDP) in Malaysia 8. Renowned for its delectable flavor and remarkable nutritional values, jackfruit can be consumed both fresh and processed into various delicacies for instance ice cream, candies, desserts, and pickles. However, approximately 60% of the jackfruit including the seeds, rinds, and rags are considered inedible and disposed as waste 9. Interestingly, recent studies have suggested that jackfruit wastes (JFW) are rich source of pectin, a valuable ingredient used in food product 10,11,12. This becomes particularly significant especially in Malaysia as the traditional sources of pectin, such as citrus and apple, are not locally grown. Thus, utilizing JFW for pectin production may help to reduce the production cost of pectin-added products due to the availability of local supply 12. Moreover, this approach can effectively mitigate agricultural waste and its adverse environmental impact.
Pectin, a naturally occurring polysaccharide that is abundant in the primary cell walls and center lamella of numerous fruits and vegetables 9.It composes of D-galacturonic residues joined by alpha-(1-4) glycosidic linkages. Basically, it can be categorized into high methoxy pectin (HMP) and low methoxy pectin (LMP) based on its level of methyl esterification 13. Generally, pectin appears as white substance and has been extensively used in food industry as food additives including gelling, thickening, emulsifying, and stabilizing agent to improve the texture of the food. Therefore, it is suitable to be applied into wide arrays of food products such as jam, marmalade, beverages, confectioneries, and dairy products due to its properties of efficient, safe, easy to use and low-volume absorbent 13. Apart from that, it is also a soluble fiber with potential health benefits such as anti-cancer properties, blood cholesterol lowering, and prebiotic effects 13.
Pectin is obtained from the internal structure of the fruits and vegetables by various extraction methods. These extraction methods are crucial in pectin production as different methods and extraction conditions may affect the yield, characteristics, and properties of pectin 14. Conventional method used in industry involves direct boiling in the presence of acid, which is time consuming and may results in pectin degradation 15. The commercial pectin is usually extracted from citrus and apple pomace, which contain 25% – 30% and 10% – 15% of pectin content in dry basis, respectively 16,17. To address the drawbacks of conventional extraction methods, researchers have investigated potential alternative techniques for instance microwave-assisted extraction (MAE), ultrasound-assisted extraction (UAE), and electromagnetic induction heating 10,18,19. Among these methods, UAE had shown a promising effect in the industry due to its speed, solvent-saving nature, and ability to generate high yields through cavitation induced by ultrasound 19. In addition, UAE was recognized for its cleanliness, efficient and environmental friendliness at the same time improve the final yield of the product 13.
The present study aimed to optimize the production of pectin from JFW, particularly jackfruit rags (JR) using UAE method as previous research on pectin extraction from JFW has primarily focused on jackfruit peels but not the other part of jackfruits 12,20,21. Moreover, recent studies have revealed that JR could be a valuable source of pectin, reducing sugar, dietary fiber, and other polyphenolics 22,23,24. These findings have added value to the exploration in potential of JR as a future sustainable source of pectin. Although Moorthy et al. 19investigated the effect of UAE on pectin yield from JFW, but the characteristics of the extracted pectin were not thoroughly analyzed. Therefore, current study is also crucial to bridge the research gap not only by optimizing pectin yield but also characterizing the pectin extracted from JR using UAE in comparison to the commercial pectin as a benchmark. The extracted JR pectin was further explored on its application in a model food gel in order to evaluate and understand its feasibility for industry usage.
Materials and methods
Ingredients, chemicals, and reagents
The jackfruit rags (JR) of the matured honey jackfruit (maturity of 12 to 16 weeks after flower anthesis) were collected from a local grocery store, Fresh Boulevard (Subang Jaya, Selangor). The JR were sourced from three (n=3) individual honey jackfruit from the supplier. Commercial pectin that served as a control was purchased from House of Ingredients (Kuala Lumpur, Malaysia). Chemicals and reagents such as sucrose, hydrochloric acid (HCl) fuming 37%, and phenol red powder were acquired from (Sigma-Aldrich Chemical Co., USA), citric acid-1-hydrate from (Johchem Scientific & Instruments Sdn. Bhd., Malaysia), D-galacturonic acid monohydrate, 97% obtained from (Alfa Aesar, USA), sodium tetraborate (Na2B4O7)98%, 3-phenylphenol 90%, and sodium chloride (NaCl) from (Acros Organic, Belgium); sodium hydroxide (NaOH), sulfuric acid (H2SO4), nitric acid (HNO3), hydrochloric acid (HCl), and citric acid from (R&M Chemicals, Malaysia), and absolute ethanol from (John Kollin Chemicals, UK) were used in current study. Distilled water was supplied by the water filtration system from (Micromeg Strong, Elga, USA).
Production of jackfruit rags powder
The JR powder was produced by adapting the method from Xu et al. 15 with some modification. First, the JR was cut into small pieces followed by blanching in boiling water for 3 mins before soaking in cold water to cool down the JR. Next, it was dried in drying oven (CN-3/9EC, C&N United Corporation Sdn Bhd, Malaysia) at 65 °C for 8 hrs 12. The dried JR samples were milled into powder using Ultra Centrifugal Mill (ZM 200, Retsch, Germany), weighed, and stored at room temperature.
Optimization using central composite design (CCD)
The response surface methodology (RSM) was used to identify the optimum conditions for pectin extraction from JR. A central composite design (CCD) employing two factors was used to optimize and gain insights into the individual and combined influences of variables on the yield of pectin from JR. The independent variables evaluated were the (i) solid-to-solvent ratio (SSR) and (ii) extraction time; while the response was the pectin yield (%). Hydrochloric acid was selected as the acid for pectin extraction based on the preliminary study as it yielded highest percentage of JR pectin compared to sulfuric acid, nitric acid, citric acid, and water (data not shown). The range of independent variables and their corresponding levels were presented in Table 1.
Table 1: Levels of the experimental scale and independent variables used in the central composite design (CCD) in the current study.
|
Independent variables |
Levels of experimental scale |
||
|
-1 |
0 |
+1 |
|
|
Solid-to-solvent ratio |
1:25 |
1:30 |
1:35 |
|
Extraction time (min) |
15 |
30 |
45 |
Extraction and purification of pectin by ultrasound-assisted extraction (UAE) method JR pectin extraction and purification
The JR pectin was extracted from dried JR powder using HCl according to procedures described by Sundarraj et al. 12followed by purification according to Koh et al. 10with slight modifications. The dried JR powder were mixed with 0.1 N HCl at 1:34.97 (g/mL) SSR by using magnetic stirrer for 30 mins. The mixture was then placed in an ultrasonic bath (FBI5055, Fisherbrand, UK) at 37 kHz for 34.69 mins at 80 °C. The hot acid extracts were filtered using muslin cloth and the filtrate was left to cool to room temperature. The filtrate was washed with 95% ethanol with 1:2 volume ratio (v/v) to purify and precipitate the JR pectin. The mixture was stirred 30 mins under room temperature followed by chilling at 4 °C for 2 hrs. Next, the pectin was filtered using Whatman Filter Paper No. 1 and cleaned with 70% ethanol twice and 95% ethanol once until the pectin turned colorless. The purified pectin was dried in a drying oven (Memmert, Germany) at 37 °C for 18 hrs. Finally, the dried pectin powder was grinded and weighed. The yield of pectin was calculated as follow:
The extraction and purification of JR pectin are briefly illustrated in Figure 1.
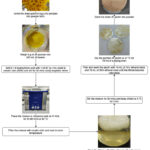 |
Figure 1: Flowchart of the extraction and purification of jackfruit rags (JR) pectin powder under optimal condition |
Physical analysis of pectin
Water activity and moisture content
The water activity of JR pectin was measured with a water activity analyzer (Aqualab Pre, USA). Moisture content of JR pectin was analyzed using a moisture content analyzer (XM 50, Presica, Switzerland).
Particle size analysis
The particle size of JR pectin was determined by measuring the mean particle size using a particle size analyzer (Mastersizer 2000, Malvern Panalytical Ltd, United Kingdom). The particle refractive index was estimated at 1.5.
Morphological analysis
The morphology of JR pectin was examined using a scanning electron microscope (SEM) (JSM-6400, JEOL, Japan). The analysis was carried out with a 5 kV accelerating voltage. Micrographs were taken at magnifications of 100 and 600.
Chemical analysis of pectin
Ash content
The ash content was evaluated by Association of Official Analytical Chemists (AOAC) official method 942.05 25,26. The JR pectin was incinerated in a furnace (Nabertherm, Germany) at 600 °C for 5 hrs.
Galacturonic acid (GA) content
The GA content of JR pectin was determined using the meta-hydroxy-diphenyl method based on Abbaszadeh 27. Firstly, 1 mL of JR pectin solution was mixed with 6 mL of Na2B4O7 in concentrated H2SO4 solution in a heated water bath at 100 °C for 5 mins, followed by cooling in an ice bath to stop the reaction. Next, 0.1 mL of the m-hydroxydiphenyl in NaOH solution was added to the mixture and gently shaken. The absorbance was measured at 520 nm using an ultraviolet-visible (UV) spectrophotometer (DU 730, Beckman Coulter, USA). A GA solution with concentrations ranging from 0 to 75 µg/mL was used to construct the standard curve.
Equivalent weight (EW)
The EW value of JR pectin was used to calculate the anhydrouronic acid (AUA) content and degree of esterification (DE) and was measured using titrimetric method described by Girma & Worku 28. In this procedure, 0.5 g of JF pectin was placed in a 250 mL conical flask and moistened with 5 mL of ethanol. Subsequently, 1 g of sodium chloride (NaCl) was introduced, along with the addition of 100 mL of distilled water and 6 drops of phenol red indicator. The titration was carried out using 0.1 N NaOH until the red indicator turned pink (pH 7.5); the change should be within a time frame of 30 secs. A neutralizing solvent was used for the determination of methoxyl content (MeO) while the following equation was used to calculate EW:
Methoxyl (MeO) content
The MeO content of JR pectin was evaluated by the addition of 25 mL of 0.25 N NaOH into the titration solvent, as described by Mada et al. 6. The mixture was shaken, then left at room temperature for 30 mins. Next, 25 mL of 0.25 N HCl was added to titrate against 0.1 N NaOH until reaching the same endpoint as above mentioned. The MeO content was calculated using the following formula:
Where, 31 = molecular weight of NaOH
Anhydrouronic acid (AUA) content
The AUA content of JR pectin was calculated according to Mada et al. 6 using values of EW and MeO according to the formula:
Where, 176 = molecular weight of AUA
z = volume of 0.1 N NaOH titrated (mL) in determination of EW
y = volume of 0.1 N NaOH titrated (mL) in determination of MeO content
Degree of esterification (DE).
The DE of pectin was calculated as described by Mada et al. 6 as follow:
Where, 176 = molecular weight of AUA
31 = molecular weight of NaOH
Surface structure analysis
The Fourier transform infrared (FTIR) spectra of JR pectin was obtained using a FTIR spectrophotometer (Spectrum 100 Optica, Perkin Elmer, USA) with a wave number ranging from 525 – 4000 cm-1. The surface chemical functional groups of pectin sample were acquired from the FTIR spectrum generated by Spectrum 100 software and compared with the control.
Application of JR pectin in model food gel
Gel strength analysis
The gel strength of the JR pectin was determined using a model food gel based on the method of Jiang et al. 29. First, 2% (w/v) of pectin solution was prepared by adding 0.4 g of dried JR pectin into 20 mL of distilled water. The pH of the solution was adjusted to 2.5 by using citrate buffer solution. Sucrose (60%, w/v) was added into JR pectin to achieve 63 Brix° at 90 °C and stirred with magnetic stirrer until boiling. The pectin solution was transferred to paper cup before solidification and was kept at 4 °C for at least 12 hrs. The gel strength of JR pectin was analyzed with texture analyzer (CT3, Brookfield Engineering, USA) equipped with a 12.7 mm diameter, 35 mm length cylinder probe (TA5, Brookfield, USA). The samples were evaluated at a constant speed of 1 mm s-1 into a distance of 4 mm from the gel surface. The hardness was derived from the analysis stress-strain curve29.
Gel color analysis
The color of dried JR pectin was determined using colorimeter (ColourFlex EZ, HunterLab, USA). The sample was spread evenly in the glass sample cup and covered with an opaque cover. Then, it was placed onto the sample port to measure the color values which were reported as L, a, and b*.
Statistical analysis
RSM-based CCD and regression coefficient analysis were carried out by using Design Expert software version 11.0 (Stat-Ease Inc., Minneapolis, USA)19. All analysis was conducted in triplicates (n = 3) and the values were expressed as mean value ± standard deviation (SD). The differences were considered significant at p < 0.05. The data obtained were analyzed using IBM Statistical Packaging for Social Science (SPSS) (Version 23.0, USA) software.
Results and Discussion
Pectin yield
The optimization of JR pectin extraction was designed using the CCD method. The thirteen experimental runs and pectin yield (%) are presented in Table 2. The yield of extracted pectin ranged from 9.89% – 11.67%. Among the experimental designs, run 2 (1:34.97 and 45 min) yielded the minimum amount of pectin (9.89%) while run 3 (1:29.15 and 30 min) produced the maximum pectin yield (11.67%).
Table 2: Central composite design and experimental responses of extraction yield of jackfruit rags (JR) pectin.
|
Experiment |
Independent variables |
Response variable |
|
|
Solid-to-solvent ratio |
Extraction time (min) |
Pectin yield (%) |
|
|
1 |
1:25.00 |
45.00 |
10.71 |
|
2 |
1:34.97 |
45.00 |
9.89 |
|
3 |
1:29.15 |
30.00 |
11.67 |
|
4 |
1:25.00 |
15.00 |
9.99 |
|
5 |
1:29.15 |
30.00 |
10.70 |
|
6 |
1:29.15 |
8.79 |
10.34 |
|
7 |
1:29.15 |
30.00 |
11.09 |
|
8 |
1:23.58 |
30.00 |
10.95 |
|
9 |
1:34.97 |
15.00 |
10.70 |
|
10 |
1:29.15 |
30.00 |
11.30 |
|
11 |
1:38.17 |
30.00 |
10.41 |
|
12 |
1:29.15 |
30.00 |
10.98 |
|
13 |
1:29.15 |
51.21 |
10.03 |
Experimental results were reported in mean ± standard deviation (n = 3)
Influence of process variables on extraction yield
The regression method was carried out on the experimental data and the pectin yield (%) was predicted. According to the data from RSM, the quadratic polynomial model for the extraction of pectin is shown as below:
Yield = 3.7670 + 434.25229a – 0.021648b + 4.46194ab – 8006.43577a2 – 0.002262b2
where, a = solid-to-solvent ratio, b = extraction time
Result collected was analyzed by Analysis of variance (ANOVA) and are tabulated in Table 3. The F-value (6.29) and p-value (p < 0.05) indicated that the regression model was significant. There was only a 1.59% chance that the observed results occurred due to noise. The interaction models (AB) among the groups showed a significance difference (p < 0.05) in this model. The lack of fit was insignificant (F-value = 0.23) with a low pure error value, indicating high precision and reliability on the experimental data. The lack-of-fit test indicates that the independent variables have been assessed for their impact on the response, and any insignificance in the effect has been acknowledged. The values of R2 (0.8179) and adjusted R2 (0.6878) in this study indicate a well-correlated relationship between the pectin yield and independent variables. Moreover, a low coefficient of variance (CV) of 2.79 demonstrates a high precision and reliable experimental values. The predicted R2 value (0.5644) is in coherence with the adjusted R2 (0.6878), with a difference of less than 0.2 This study confirms that the model developed has a good fit, as indicated by the adequate precision value of 6.57.
Table 3: ANOVA results for extraction yield of jackfruit rags (JR) pectin.
|
Source |
Sum of squares |
DF |
Mean square |
F-value |
p-value |
|
Model |
2.79 |
5 |
0.5574 |
6.29 |
0.0159 |
|
A |
0.0954 |
1 |
0.0954 |
1.08 |
0.3341 |
|
B |
0.0349 |
1 |
0.0349 |
0.3936 |
0.5503 |
|
AB |
0.5852 |
1 |
0.5852 |
6.60 |
0.0371 |
|
A2 |
0.4757 |
1 |
0.4757 |
5.37 |
0.0537 |
|
B2 |
1.80 |
1 |
1.80 |
20.33 |
0.0028 |
|
Residual |
0.6207 |
7 |
0.0887 |
||
|
Lack of fit |
0.0928 |
3 |
0.0309 |
0.2344 |
0.8685 |
|
Pure error |
0.5279 |
4 |
0.1320 |
||
|
Std. Dev. = 0.2978 |
|||||
|
Mean = 10.67 |
|||||
|
C.V. % = 2.79 |
|||||
|
R² = 0.8179 |
|||||
|
Adjusted R² = 0.6878 |
|||||
|
Predicted R² = 0.5644 |
|||||
|
Adeq Precision = 6.5660 |
|||||
CV = Coefficient of variance; DF = degree of freedom; R2 = regression coefficient
Single-factor effect on the JR pectin extraction
Effect of solid-to-solvent ratio (SSR)
In order to enhance the pectin yield, a substantial quantity of solvent was used to ensure efficient dissolution of the compound from material. Consequently, it is imperative to elucidate the impact of SSR on the extraction yield. The results depicted in Figure 2(a) suggest that the JR pectin yield initially increased with an increase in the SSR but reached a point (1:29.15) where the yield started to decrease. Increasing the SSR may enlarge the area of contact between the JR powder and the solvent, thus potentially leading to an elevated pectin yield extraction in the solution30. However, a further increase in SSR led to a decline in supply of ultrasonic energy density thus resulted in a reduction of pectin yield19. Moreover, further increase in SSR may disrupt the dynamic balance between the solid and solvent and reduced the rate of mass transfer process 31. These findings are comparable to the results reported by Tran et al. 30,who extracted JR pectin using MAE.
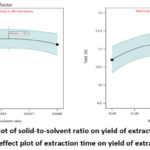 |
Figure 2: (a) Effect plot of solid-to-solvent ratio on yield of extracted jackfruit rags (JR) pectin and (b) effect plot of extraction time on yield of extracted JR pectin. |
Effect of extraction time
Similar to the effect of SSR, Figure 2(b) demonstrates that the percentage of yield increased when the extraction time is prolonged, reaching its peak at around 30 mins. The cavitation effect of the ultrasonic waves induced the swelling and hydration by enlarging the pores of the JR. The extraction solvent may enter into JR through diffusion and release the polysaccharide as the JR is directly covered with solvent 19. Nevertheless, an extraction time longer than 30 mins resulted in a reduction of the extraction yield of pectin. This decline may be attributed to the extended pectin exposure, causing thermal degradation and consequently diminishing the overall pectin yield 32. Thus, it was suggested that the optimal sonication time for pectin extraction remains at 30 mins. Moreover, in the current study, a shorter extraction time of 30 mins was reported as compared to the previous study (60 mins), which employed MAE method 30. It was showed that ultrasonication may improve pectin yield and reduced the time for extraction 33. It is worth noting that the initial pectin yield was lower at the beginning of extraction, possibly due to some pectin being attached to the JR cell wall 6.
Interaction effect of solid-to-solvent ratio and extraction time on the JR pectin extraction
A three-dimensional (3D) response surface plot (Figure 3) was used to illustrate the pectin extraction under various process variables (Table 1). These surface plots were constructed by depicting the interaction between two variables at a time while holding the third variable constant. In Figures 3(a) and 3(b) illustrate the maximum yield of pectin (11.16%) was obtained with a SSR of 1:34.97 and extraction time of 34.69 mins. The yield of pectin started to decrease when the extraction time went beyond 34.69 mins and a SSR exceeded 1:34.97 (Figures 3a and 3b).
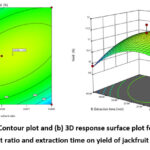 |
Figure 3: (a) Contour plot and (b) 3D response surface plot for the effect of solid-to-solvent ratio and extraction time on yield of jackfruit rags (JR) pectin. |
Validation of optimized condition for JR pectin extraction
The numerical optimization method was used in this study to optimize the extraction yield of pectin using Design-Expert software, with the aim of achieving with the maximum desirability values. The predicted optimum conditions for pectin extraction were determined as a SSR of 1:34.97 and extraction time of 34.69 min. The model predicted an optimal pectin yield of 11.16%. To further validate the predicted result and ensure its practical relevance, the experiment was performed in triplicate under the optimal conditions and the JR pectin yield was reported as 12.53%, which was close to the predicted values (11.16%) with no significant difference (p > 0.05) (Table 4).
Table 4: Observed and predicted values of extraction yield of jackfruit rags (JR) pectin at optimized extraction conditions (n = 3).
|
|
Yield (%) |
|
Experimental value |
12.53 ± 0.89 |
|
Predicted value |
11.16 |
|
p-value |
0.117* |
*p value > 0.05 indicating no significant difference between experimental and predicted values.
Physical analysis of pectin
Water activity and moisture content
The water activity, moisture, and ash content of JR pectin was evaluated and summarized in Table 5. The water activity of both pectin is comparable (p > 0.05), ranged from 0.48 – 0.52 aw. The low water activity of JR pectin may inhibit growth of spoilage and pathogenic microorganisms, including mold, fungi, and yeast. While JR pectin has a lower water activity compared to control, it could be more shelf-stable than commercial pectin.
Particle size analysis
Particle size has an essential role in defining the material properties of pectin, such as flowability, compaction, and segregation 34. The particle size of JR pectin and commercial pectin is summarized in Table 5. The particle size of JR pectin was significantly larger than commercial pectin (p < 0.05). However, both pectin samples were considered large, falling within the range of 125 – 850 µm 35. Another study also reported that the particle size of jackfruit rind pectin ranged from 324.71 – 363.62 µm, which were slightly bigger compared to the present study 36. Pectin powder with a small particle has a poor flowability and may causes caking issue 37. Nevertheless, different particle sizes of pectin powder have their respective applications in the industry.
Morphological analysis
In present study, SEM was used to discern the differences in the physical composition of pectin extracted via UAE and the conventional commercial method. As depicted in Figure 4, it was observed that the particle size of control sample (b) was notably smaller in comparison to JR pectin (a) when viewed under 100x magnification. The particles of JR pectin also exhibited crowded granules in the micrograph compared to the control. Moreover, subtle cracks detected on the surface of JR pectin as compared to the control. This may be due to the ultrasonic action promotes the softening and expansion of cell walls by hydrating the pectinaceous components within the middle lamella. This eventually culminates in the disruption of plant tissue during the sonication process 38.
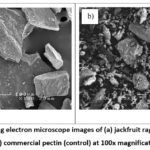 |
Figure 4: Scanning electron microscope images of (a) jackfruit rags (JR) pectin and (b) commercial pectin (control) at 100x magnification. |
Chemical analysis of pectin
Ash content
The ash content not only represents the available minerals such as potassium, sodium, magnesium, and iron, but also indicates the purity level of pectin. Higher purity pectin has a low ash content 39. Based on results, the ash content of JR pectin (3.64%) is significantly and higher than the control (p < 0.05) (Table 5). Tran et al. 30 showed that the ash content of JFR pectin by MAE and heating reflux extraction (HRE) are 1.15% and 1.31%, respectively. It was suggested that a higher extraction temperature could result in a higher ash content due to a heating process 40. The high temperature used in this study can result in a protopectin hydrolysis reaction, which eventually leads to an increase in Mg and Ca components in the extract solution and hence contributes to an increase in ash content 41. According to International Pectin Producers Association (IPPA) 42, the maximum pectin ash content is 12%. The JR pectin in the current study is in good agreement with this criterion and can be categorized as good quality pectin.
Galacturonic acid (GA) content
The GA content is often considered an important parameter for evaluating the gelling capacity and application of pectin. The GA content of JR pectin was significantly higher than control pectin (p < 0.05) as shown in Table 5. A study by Xu et al. 15 showed that pectin extracted from jackfruit peel is a galacturonic acid-rich polysaccharide that could be methyl-esterified, greatly influencing the gelation and solubility properties of JR pectin. Furthermore, it was noted that the GA content of JR pectin obtained through MAE (61.53%) was higher compared to this study 30. This could suggest that MAE was able to separate the pectin from JR more efficiently compared to UAE thus the GA content is higher.
Equivalent weight (EW)
The EW indicates the overall amount of unesterified galacturonic acid within pectin and serves as a gauge of the gel-forming capacity 6,43. A higher EW signifies an enhanced capacity for gel formation. The EW of pectin is influenced by factors such as extraction solvent, pH, and the quantity of free acids present within the pectin structure 44. The EW of the JR pectin (1950.88) under optimized conditions was found to be significantly higher than that of the control pectin (933.78 mg) (p < 0.05) as displayed in Table 5. Moreover, it was higher than EW values reported on pectin extracted from dragon fruit peel (475.64 – 713.99) and lemon peel (298 – 532) based on study by Ismail et al. 45and Ahmed & Sikder 46, respectively. Therefore, the JR pectin could have a superior gel-forming effect.
Methoxyl (MeO) content
The MeO content is a key factor indicating the ability of pectin to disperse in water, where a higher MeO indicating robust strong cohesive force and adhesive force that correspond to increase firmness in food product 47. Table 5 shows that the MeO of JR pectin was significantly lower than that of the control pectin (p < 0.05). A study by Tran et al. 30 suggested that MeO content of JR pectin using MAE and HRE was higher (5.81 and 6.53%, respectively). The MeO content in pectin varies depending on the origin of raw material, extraction technique, and specific method used in determining MeO content 44. The different MeO content of JR pectin proven the significant role of the extraction method. In fact, Grassino et al. 48demonstrated that temperature applied during UAE may affect the MeO content of extracted pectin. In the current study, the high temperature used during UAE may degrade and reduce the MeO content of JR pectin.
Anhydrouronic acid (AUA) content
Based on Table 5, the AUA in the current study was found to be 31.12%. According to Begum et al. 9, it was suggested the AUA content should not be less than 65% in ash and moisture free basis. Ismail et al. 45suggested that the low AUA content could be due to the existence of high amount of protein or sugar in the pectin.
Degree of esterification (DE)
The DE is regarded as the primary attribute influencing the suitability of pectin application in food industry, as it governs the gel-forming ability of pectin 49. Pectin is classified into two groups according to DE, each with its respective application in the food industry. DE values above 50% are considered HMP, while DE values below 50% are classified as LMP. The DE values for both JR pectin (70.08%) and control pectin (67.51%) were higher than 50%, thus may categorized under HMP (Table 5). A study by Leong et al. 11reportedthat jackfruit rind pectin has a DE ranged from 72.82 to 75.82%. Moreover, the DE of JR pectin in this study is similar to the DE values obtained for JR pectin extracted using MAE and HRE (64.61 – 65.54%), as reported by Tran et al. 30 These results indicate that pectin extracted from jackfruit waste is generally HMP, regardless of the extraction methods used. Overall, the studied pectin may be suitable for food applications such as making jam or marmalade, which require high sugar content and low pH for gel formation.
Surface structure analysis
The FTIR analysis was performed to validate the identity of JR pectin by comparing it to commercial pectin. As illustrated in Figure 5, the FTIR spectra of JR pectin and the control were comparable. Both spectra fall in the ‘fingerprint’ region, implying that the pectin sample extracted from JR was effectively pectin. Based on FTIR spectra, the current findings are in line with results fromTran et al. 30, who also studied pectin extracted from JR using MAE. The peaks observed in region between 3100 and 3600 cm-1 were due to OH stretching, which was contributed by absorbed moisture in the JR pectin and control 50. The two absorption peaks at 1740 – 1760 cm-1 and 1630 – 1650 cm-1 were attributed to esterified carbonyl group (C=O) and free carboxyl group (COO-), respectively 51. The area and intensity of these two absorption bands could also be used to determine the DE of pectin, where a higher area and intensity of C=O group than COO- group indicate a higher DE 52. Furthermore, the peaks elucidated around 950 – 1200 cm-1 were attributed to the main functional groups of C-C cyclic linkages and C-O-C glycoside linkages, specifically for pectin 53.
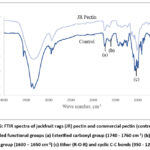 |
Figure 5: FTIR spectra of jackfruit rags (JR) pectin and commercial pectin (control) with labelled functional groups. |
Application of JR pectin in model food gel
Gel strength analysis
In the food industry, pectin is commonly used as gelling or thickening agent. Figure 6 shows the gel formed from the pectin extracted from JR and a commercial pectin (control). Understanding the rheological properties of the pectin is important as it provides information on the functionality of pectin. Gel strength generally refers to the pectin’s ability to form a gel and maintain its structure. The gel strength of JR pectin, which is associated with the texture was significantly weaker than the control (p < 0.05) as shown in Table 5. However, both JR pectin and control are considered HMP, which able to form gel under specific conditions such as low pH (pH 2.5), low water activity, and high sugar concentration (60%, w/v) 54. This gel formation attributed to the stabilization of the gel structure through hydrophobic interactions and hydrogen bonding. A positive correlation was found between the gel strength and DE of pectin, as JFR pectin exhibited higher gel strength and hardness compared to the control. This finding is supported by Jiang et al. 29, who demonstrated that the gel strength of HMP increases with higher DE of pectin. Overall, the JR pectin is capable of forming a firm gel structure at pH 2.5.
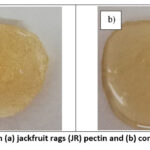 |
Figure 6: Gel formed from (a) jackfruit rags (JR) pectin and (b) commercial pectin (control). |
Gel color
According to Table 5, there were significant difference in the color values (a* and b*) between commercial pectin gel and JR pectin gel (p < 0.05). Generally, JR pectin gel has a higher intensity of redness (a*) and yellowness (b*) compared to the commercial pectin gel due to the natural golden-brown color of jackfruit. The lightness (L*) of JR pectin gel and commercial pectin gel are comparable (p > 0.05).
Table 5: Physicochemical properties of commercial pectin (control) and jackfruit rags (JR) pectin.
|
Analysis |
|
Commercial pectin |
Jackfruit rags pectin |
|
Physical properties |
|||
|
Moisture (%) |
6.10 ± 0.04b |
12.48 ± 0.02a |
|
|
Water activity |
0.52 ± 0.02a |
0.48 ± 0.01a |
|
|
Particle size (D [4,3], µm) |
138.58 ± 1.56b |
280.66 ± 15.11a |
|
|
Chemical properties |
|||
|
Ash content (%) |
2.19 ± 0.06b |
3.64 ± 0.01a |
|
|
Galacturonic acid (µg/mL) |
22.00 ± 1.15b |
35.79 ± 0.51a |
|
|
Equivalent weight |
933.78 ± 21.26b |
1950.88 ± 484.82a |
|
|
Methoxyl content (%) |
2.20 ± 0.04a |
1.39 ± 0.31b |
|
|
Anhydrouronic acid content (%) |
21.28 ± 0.24b |
31.12 ± 1.77a |
|
|
Degree of esterification (%) |
67.51 ± 2.4b |
70.08 ± 7.18a |
|
|
Physical properties in model food gel |
|||
|
Gel strength (g) |
16.21 ± 0.29a |
14.23 ± 0.24b |
|
|
Gel colour |
L* |
74.45 ± 0.03a |
74.06 ± 0.43a |
|
|
a* |
1.07 ± 0.03b |
1.20 ± 0.04a |
|
b* |
0.15 ± 0.04b |
15.62 ± 0.47a |
|
All values shown are mean ± standard deviation of triplicate determination (n = 3).
Results with different superscript lowercase letters within the same row are significantly different (p < 0.05).
Conclusion
The present study focuses on the extraction and characterization of pectin from JR using UAE. By utilizing the regression model of the response surface methodology, the optimum SSR and extraction time for JR pectin using hydrochloric acid were found to be 1:34.97 and 34.69 min, respectively. Under these optimal conditions, a yield of 12.53% of JR pectin was obtained, which is in coherent with the predicted result. The ash content of JR pectin met the criteria for good quality pectin. The studied JR pectin was classified as a HMP with the DE greater than 50%. In conclusion, current study suggests that JR pectin could be a promising source for industrial production, as it demonstrated comparable quality to commercial pectin. The utilization of JR waste as a source of pectin may contribute to an alternative sustainable source and enable the transformation of agro-industrial wastes into new functional food ingredients. Further study could elucidate the other parameters that may influence the yield of JR pectin such as pH adjustment and ultrasonic frequency and amplitude. In addition, further characterization could be done on rheological properties to assess the functional properties of JR pectin to widen its utilization in food industry such as food packaging.
Acknowledgement
The authors would like to thank Taylor’s University School of Biosciences for the laboratory facilities support.
Conflict of Interest
The authors declare that they have no conflict of interest.
Funding sources
Financial support by Taylor’s Internal Research Grant Scheme – Emerging Research Funding Scheme (TIRGS-ERFS) [TRGS/ERFS/1/2017/SBS/004] for this work is gratefully acknowledged.
References
- Rodzalan S. A., Yin O. G., Noor N. N. M. A foresight study of artificial intelligence in the agriculture sector in Malaysia. J. Crit. Rev. 2020; 7: 1339 – 1346.
- Tahir T. A. Waste audit at coconut-based industry and vermicomposting of different types of coconut waste. Master Thesis, University of Malaya, Kuala Lumpur, Malaysia; 2012. http://studentsrepo.um.edu.my/3868/1/1._Title_page%2C_abstract%2C_content.pdf. Accessed 7 October 2023.
- Malenica D., Bhat R. Current research trends in fruit and vegetables wastes and by-products management-scope and opportunities in the Estonian context. Agron. Res. 2020; 18(Suppl 3): 1760-1795. doi: 10.15159/ar.20.086.
- Obi F. O., Ugwuishiwu B. O., Nwakaire J. N. Agricultural waste concept, generation, utilization and management. Nigerian J Technol. 2016; 35(4): 957-964. doi: 10.4314/njt.v35i4.34.
CrossRef - Lim W. J., Chin N. L., Yusof A. Y., Yahya A., Tee T. P. Food waste handling in Malaysia and comparison with other Asian countries. Int Food Res J. 2016; 23: 1-6.
CrossRef - Mada T., Duraisamy R., Guesh F. Optimization and characterization of pectin extracted from banana and papaya mixed peels using response surface methodology. Food Sci Nutr. 2022; 10: 1222-1238. doi: 10.1002/fsn3.2754.
CrossRef - Madruga M. S., de Albuquerque F. S., Silva I. R., do Amaral D. S., Magnani M., Queiroga Neto V. Chemical, morphological and functional properties of Brazilian jackfruit (Artocarpus heterophyllus L.) seeds starch. Food Chem. 2014; 143: 440-445. doi: 10.1016/j.foodchem.2013.08.003.
CrossRef - Department of Agriculture Malaysia. Fruit Crops Statistic Malaysia 2021. Kuala Lumpur, Malaysia: Ministry of Agriculture; 2021. http:// www.doa.gov.my/index/resources/ aktiviti_sumber/sumber_awam/ maklumat_pertanian/perangkaan_ tanaman/statistik_tanaman_ buah_2021.pdf. Accessed 26 August 2023.
- Begum R., Aziz M. G., Uddin M. B., Yusof Y. A. Characterization of jackfruit (Artocarpus heterophyllus) waste pectin as influenced by various extraction conditions. Agric Agric Sci Procedia. 2014; 2: 244-251. doi: 10.1016/j.aaspro.2014.11.035.
CrossRef - Koh P. C., Leong C. M., Mohd Adzahan N. Microwave-assisted extraction of pectin from jackfruit rinds using different power levels. Int Food Res J. 2014; 21: 2091-2097.
- Leong C. M., Noranizan M. A., Kharidah M., Choo W. S. Physicochemical properties of pectin extracted from jackfruit and chempedak fruit rinds using various acids. Int Food Res J. 2016; 23(3): 973-978.
- Sundarraj A. A., Thottiam Vasudevan R., Sriramulu G. Optimized extraction and characterization of pectin from jackfruit (Artocarpus integer) wastes using response surface methodology. Int J Biol Macromol. 2018; 106: 698-703. doi: 10.1016/j.ijbiomac.2017.08.065.
CrossRef - Karbuz P., Tugrul N. Microwave and ultrasound assisted extraction of pectin from various fruits peel. J Food Sci Technol. 2021; 58: 641-650. doi: 10.1007/s13197-020-04578-0.
CrossRef - Belkheiri A., Forouhar A., Ursu A. V., Dubessay P., Pierre G., Delattre C., Djelveh G., Abdelkafi S., Hamdami N., Michaud P. Extraction, characterization, and applications of pectin from plant by-products. Appl. Sci. 2021; 11(14): 6596. doi: 10.3390/app11146596.
CrossRef - Xu S. Y., Liu J. P., Huang X. S., Du L. P., Shi F. L., Dong R., Huang X. T., Zheng K., Liu Y., Cheong K. L. Ultrasonic-microwave assisted extraction, characterization and biological activity of pectin from jackfruit peel. LWT. 2018; 90: 577-582. doi: 10.1016/j.lwt.2018.01.007.
CrossRef - Arioui F., Ait Saada D., Cheriguene A. Physicochemical and sensory quality of yogurt incorporated with pectin from peel of Citrus sinensis. Food Sci Nutr. 2017; 5: 358-364. doi: 10.1002/fsn3.400.
CrossRef - Zaidel D. N. A., Rashid J. M., Hamidon N. H., Salleh L. M., Kassim A. S. B. M. Extraction and characterisation of pectin from dragon fruit (Hylocereus polyrhizus) peels. Chem Eng Trans. 2017; 56: 805-810.
- Zouambia Y., Ettoumi K., Krea M., Moulai-Mostefa N. A new approach for pectin extraction: Electromagnetic induction heating. Arabian J Chem. 2014; 54. doi: 10.1016/j.arabjc.2014.11.011.
CrossRef - Moorthy I. G., Maran J. P., Ilakya S., Anitha S. L., Sabarima S. P., Priya B. Ultrasound assisted extraction of pectin from waste Artocarpus heterophyllus fruit peel. Ultrason Sonochem. 2017; 34: 525-530. doi: 10.1016/j.ultsonch.2016.06.015.
CrossRef - Ahmmed R., Inam A. K. M. S., Alim M. A. A., Sobhan M., Haque M. Extraction, characterization and utilization of pectin from jackfruit (Artocarpus heterophyllus L.) waste. Bangladesh J Environ Sci. 2017; 32: 57-66.
- Naik M., Rawson A., Rangarajan J. M. Radio frequency-assisted extraction of pectin from jackfruit (Artocarpus heterophyllus) peel and its characterization. J Food Process Eng. 2020; 43: e13389. doi: 10.1111/jfpe.13389.
CrossRef - Brahma R., Ray S. A comprehensive review on the recent advances in the valorization of jackfruit waste for the development of value-added products. J Food Technol Res. 2022; 9(2): 120-134.
CrossRef - Dhwani N. V., Raju G., Mathew S. E., Baranwal G., Shivaram S. B., Katiyar N., Pramanik N., Jhunjhunwala S., Shilpashree H. B., Nagegowda D. A., Kumar R., Shasany A. K., Biswas R., Shankarappa S. A. Antibacterial efficacy of jackfruit rag extract against clinically important pathogens and validation of its antimicrobial activity in Shigella dysenteriae infected Drosophila melanogaster infection model. bioRxiv. 2020. doi: 10.1101/2020.03.09.983015.
CrossRef - Kaur J., Singh Z., Shah H. M. S., Mazhar M. S., Hasan M. U., Woodward A. Insights into phytonutrient profile and postharvest quality management of jackfruit: A review. Crit Rev Food Sci Nutr. 2023. doi: 10.1080/10408398.2023.2174947.
CrossRef - Association of Official Analytical Chemists International. Official Methods of Analysis. 18th ed. Washington, USA; 2005.
CrossRef - Konrade D., Gaidukovs S., Vilaplana F., Sivan P. Pectin from fruit- and berry-juice production by-products: Determination of physicochemical, antioxidant and rheological properties. Foods, 2023; 12(8): 1615. doi: 10.3390/foods12081615.
CrossRef - Abbaszadeh A. H. Pectin and galacturonic acid from citrus wastes [master’s thesis]. Sweden: University of Borås; 2009. https://hb.diva-portal.org/smash/get/diva2:1311152/FULLTEXT01. Accessed 7 October 2023.
- Girma E., Worku T. Extraction and characterization of pectin from selected fruit peel waste. Int J Sci Res Publ. 2018; 6(2).
- Jiang Y., Du Y., Zhu X. M., Xiong H., Woo W., Hu J. Physicochemical and comparative properties of pectin extracted from Akebia trifoliata var. Australis peel. Carbohydr Polym. 2012; 87(2): 1663-1669. doi: 10.1016/j.carbpol.2011.09.064.
CrossRef - Tran N. T. K., Nguyen V. B., Tran T. V., Nguyen T. T. T. Microwave-assisted extraction of pectin from jackfruit rags: Optimization, physicochemical properties and antibacterial activities. Food Chem. 2023; 418: 135807. doi: 10.1016/j.foodchem.2023.135807.
CrossRef - Maran P. J., Sivakumar V., Thirugnanasambandham K., Sridhar R. Microwave assisted extraction of pectin from waste Citrullus lanatus fruit rinds. Carbohydr Polym. 2014; 101: 786-91. doi: 10.1016/j.carbpol.2013.09.062.
CrossRef - Simsek M., Sumnu G., Sahin S. Microwave assisted extraction of phenolic compounds from sour cherry pomace. Sep Sci Technol. 2012; 47(8): 1248-1254. doi: 10.1080/01496395.2011.644616.
CrossRef - Bagherian H., Zokaee Ashtiani F., Fouladitajar A., Mohtashamy M. Comparisons between conventional, microwave- and ultrasound-assisted methods for extraction of pectin from grapefruit. Chem Eng Process: Process Intensif. 2011; 50(11-12): 1237-1243. doi: 10.1016/j.cep.2011.08.002.
CrossRef - Dyankova S., Doneva M., Todorov Y., Terziyska M. Determination of particle size distribution and analysis of a natural food supplement on pectin base. J Pharm Nutr Sci. 2016; 6(5): 1-8.
- Genovese D. B., Ye A., Singh H. High methoxyl pectin / apple particles composite gels: Effect of particle size and particle concentration on mechanical properties and gel structure. J Texture Stud. 2010; 41(2): 171-189. doi: 10.1111/j.1745-4603.2010.00220.x.
CrossRef - Begum R., Aziz M. G., Uddin M. B., Yusof Y. A. Extraction and characterization of pectin from jackfruit (Artocarpus heterophyllus Lam) waste. IOSR J Pharm Biol Sci. 2017; 12(6): 42-49.
- Davor J., Benković M., Srečec S., Ježek D., Špoljarić I., Bauman I. Assessment of powder flow characteristics in incoherent soup concentrates. Adv Powder Technol. 2012; 23(5): 620-631. doi: 10.1016/j.apt.2011.07.003.
CrossRef - Minjares-Fuentes R., Femenia A., Garau M. C., Meza-Velázquez J. A., Simal S., Rosselló C. Ultrasound-assisted extraction of pectins from grape pomace using citric acid: A response surface methodology approach. Carbohydr Polym. 2014; 106: 179-189. doi: 10.1016/j.carbpol.2014.02.013.
CrossRef - Israel K. A., Baguio S. F., Diasanta M. D. B., Lizardo R. C., Dizon E., Mejico M. I. F. Extraction and characterization of pectin from Saba banana [Musa ‘saba'(Musa acuminata x Musa balbisiana)] peel wastes: A preliminary study. Int Food Res J. 2015; 22: 202-207.
- Picauly P., Tetelepta G. Characterization of pectin from tongka langit banana peels with various extraction temperature. IOP Conf. Ser.: Earth Environ. Sci. 2021; 883: 012060. doi: 10.1088/1755-1315/883/1/012060.
CrossRef - Hanum F., Tarigan M. A., Kaban I. M. D. Extraction of pectin from kepok banana fruit leather (Musa paradisiaca). J. Teknik Kimia USU. 2012; 1(1): 49-53. (in Bahasa Indonesia).
CrossRef - International Pectin Producers Association (IPPA). Pectin commercial production and pectin in organic food products. IPPA website. 2014. Accessed August 2, 2023.
- Altaf, Immanuel G., Iftikhar F. Extraction and characterization of pectin derived from papaya (Carica papaya Linn.) peel. Int J Sci Eng Technol. 2015; 3(4): 970-974. doi: 10.2348/ijset07150970.
- Muthukumaran C., Banupriya L., Harinee S., Sivaranjani S., Sharmila G., Rajasekar V., Kumar N. Pectin from muskmelon (Cucumis melo var. reticulatus) peels extraction optimization and physicochemical properties. Biotechnol. 2017; 7(1): 66. doi: 10.1007/s13205-017-0655-3.
CrossRef - Ismail N. S. M., Ramli N., Hani N. M., Meon Z. Extraction and characterization of pectin from dragon fruit (Hylocereus polyrhizus) using various extraction conditions. Sains Malaysia. 2012; 41(1): 41-45.
- Ahmed S., Sikder B. H. Extraction, characterization and application of three varieties of Citrus limon L. pectin in jelly product. Food Appl. Biosci. J. 2019; 7(1): 31-50.
- Mugampoza D., Gafuma S., Kyosaba P., Namakajjo R. Characterization of pectin from pulp and peel of Ugandan cooking bananas at different stages of ripening. J. Food Res. 2020; 9(5): 67-77. doi: 10.5539/jfr.v9n5p67.
CrossRef - Grassino A. N., Brnčić M., Vikić-Topić D., Roca S., Dent M., Brnčić S. R. Ultrasound assisted extraction and characterization of pectin from tomato waste. Food Chem. 2016; 198: 93-100. doi: 10.1016/j.foodchem.2015.11.095.
CrossRef - Daud N., Said B., Jafar F., Yasin H., Kusrini E., Usman A. pH-dependent yield and physicochemical properties of pectin isolated from Citrus maxima. Chem Eng J. 2019; 10(1): 1131-1139. doi: 10.1111/jfpp.13411.
CrossRef - Wang S., Chen F., Wu J., Wang Z., Liao X., Hu X. Optimization of pectin extraction assisted by microwave from apple pomace using response surface methodology. J Food Eng. 2007; 78: 693-700. doi: 10.1016/j.jfoodeng.2005.11.008.
CrossRef - Wang W., Ma X., Xu Y., Cao Y., Jiang Z., Ding T., Ye X., Liu D. Ultrasound-assisted heating extraction of pectin from grapefruit peel: Optimization and comparison with the conventional method. Food Chem. 2015; 178: 106-114. doi: 10.1016/j.foodchem.2015.01.080.
CrossRef - Gnanasambandan R., Proctor A. Determination of pectin degree of esterification by diffuse reflectance fourier transform infrared spectroscopy. Food Chem. 2000; 68: 327-332. doi: 10.1016/S0308-8146(99)00191-0.
CrossRef - Khamsucharit P., Laohaphatanalert K., Gavinlertvatana P., Sriroth K., Sangseethong K. Characterization of pectin extracted from banana peels of different varieties. Food Sci Biotechnol. 2018; 27(3): 623-629. doi: 10.1007/s10068-017-0302-0.
CrossRef - Rivadeneira J., Wu T., Ybanez Q., Dorado A., Migo V., Nayve F., Castillo I. Microwave-assisted extraction of pectin from “Saba” banana peel waste: Optimization, characterization, and rheology study. Int J Food Sci. 2020; 7(1): 245-248. doi: 10.1155/2020/8879425.
CrossRef

This work is licensed under a Creative Commons Attribution 4.0 International License.


