
Introduction
Cheese is one of the most widely produced and consumed dairy products worldwide, and is recognized for its nutritional and health advantages. It is a complex matrix of milk protein, fat, minerals, and other components such as water. Protein is the fundamental structural component of cheese milk and fat is encased within the protein matrix. The perception of cheese as a high-fat food deters certain individuals from including it into their daily intake, despite its significant contribution as a source of dietary calcium 1. The reduction of fat content in cheese while preserving its sensory attributes poses many obstacles, given that fat significantly contributes to its flavor and texture characteristics.
The rheological and texture properties of cheese are influenced by its chemical composition. Parameters commonly used to determine the type of cheese (hard, semi-hard, or soft) include the amount of fat in dry matter and the ratio of water to solids-non-fat. Other factors, such as cheese-making technology or the degree of proteolysis, also contribute to these properties 2. In natural cheeses, fat globules fill blank regions in the open protein matrix, functioning as a type of filler 3. Milk fat imparts a characteristic smoothness to cheese by being equally distributed throughout the casein matrix of the cheese. Reduced fat content results in casein becoming an important component of texture development. Casein being the primary structural component of cheese, its micelles are bonded together to create a three-dimensional matrix that provides the product structure. There are more regions of unbroken protein in low-fat cheeses, and due to this insufficient breakdown of casein, low-fat cheeses appear to have a relatively firm texture.
Quarg cheese, also known as Quark cheese, is a type of soft, unripened, paste-like fresh cheese that is often produced with skim milk 4. In the countries of Eastern Europe, this particular type of cheese is alternatively referred to as Tvorog or Russian farmer’s cheese. This peculiar type of cheese is characterized by its acid-induced coagulation process, which occurs when the pH level reaches approximately 4.6. The process of acidification in Quarg cheese is achieved by utilizing mesophilic starter cultures, specifically Lactococcus lactis subsp. lactis and Leuconostoc citrovorum. Additionally, a small amount of rennet may be included to enhance the firmness of the coagulum and reduce the loss of casein in the whey. Quarg cheese exhibits a notable moisture content and is commonly consumed in close proximity to its production 5.
Typically, experiments that involve minor deformations such as oscillation, stress-relaxation, and creep are employed to gather insights into the molecular-level structure of cheese 2. On the other hand, experiments involving significant and destructive deformations, such as stress-strain tests and texture profile analysis, are utilized to investigate fracture properties 6. The technical aspects of cheese are inherently interconnected, as the rheology and texture of cheese are contingent upon its structural composition and internal conditions 5. Previous research has investigated the rheological behavior and textural qualities of commonly consumed cheese kinds, focusing on the influence of varying fat percentages. The rheological characteristics of cheddar cheese were investigated by Rogers et al. 7 in relation to different fat percentages. The study revealed that the variation in fat percentages had a notable impact on the rheological properties of the cheese. The study revealed that the initial distribution of fat globules and the subsequent alterations in the protein-gel network during the ripening process had an impact on the textural and rheological characteristics. In their study, Madadlou et al. 8 conducted an evaluation of the rheological characteristics of low-fat Iranian white cheese. The researchers investigated the impact of varying the amount of rennet added on the cheese. Their findings revealed that a decrease in fat content led to an increase in instrumental hardness parameters, a more compact microstructure, reduced meltability, and undesirable sensory properties of the cheese product. As the fat content of cheese is gradually diminished, the resulting texture of the cheese becomes unappealingly stiff and rubbery 3,9,10. Due to its very limited recognition and status as a low-fat acid-coagulated fresh cheese, the scientific literature pertaining to the manipulation of fat content in Quarg cheese remains scarce. The primary objective of this study is to investigate the rheological, textural, and sensory characteristics of quarg cheese produced using different levels of fat content.
Materials and Method
Materials
Indigenous cow milk was procured from Dairy Farm (Banaras Hindu University, Varanasi, India). The direct vat set cheese culture was purchased from the National Collection of Dairy Cultures (NCDC 149), Karnal, India. Vegetable rennet was bought from Meito Sangyo Coop. Ltd. (Japan) and polystyrene cups (250 ml) with lids were procured from the local market of Varanasi, Uttar Pradesh, India. All chemicals for analysis were procured from Sigma Aldrich (Mumbai, India).
Maintenance of culture
The procured culture was prepared in 3-4 skim milk tubes by distributing 5.0 ml of skim milk so prepared in each test tube and 100 ml conical flasks. The inoculated milk was incubated at 14-16 hours at 37°C. The culture was activated by transferring it into sterilized skim milk at a concentration of 1- 2% and stored at refrigeration temperature (4°C).
Quarg cheese making
Indigenous mixed (cow and buffalo) milk which was procured from the Dairy Farm (BHU, Varanasi) was standardized to various fat compositions; 6.0 ± 0.01 (QC1), 3.5 ± 0.03 (QC2), 1.5 ± 0.03 (QC3), and 0.5 ± 0.02 (QC4) and pasteurized at 72°C for 15 seconds. The milk was cooled down to 32°C and inoculated with 2% of Lactic starters (Lactococcus lactis subsp. lactis, Lactococcus lactis subsp. cremoris), thereafter incubated at 37°C. After 90 minutes of starter addition when the pH reached 6.3, rennet (0.2 ml/5 kg milk) was added and mixed thoroughly. The cheese milk was incubated for 14-15 hours (@ 35-37℃), and later the coagulum was cut with a cheese knife and rested for 10 minutes for syneresis of the curd. The coagulum was heated to 55-60°C for 10 min held without vigorous stirring. Thereafter, the cheese curd was cooled down to room temperature and was transferred to a muslin cloth and hung for de-wheying for about 4 hours. After whey drainage, the final product was stored in Polystyrene cups at 4°C.
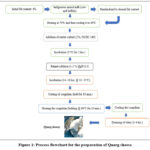 |
Figure 1: Process flowchart for the preparation of Quarg cheese |
Proximate analysis of standardized quarg cheese
Moisture, fat, and ash content of fresh quarg cheese were determined as per the method described in IS: SP:18 11. Protein content was determined by the Kjeldahl method and the nitrogen content was multiplied by 6.38 IDF 12. Total Solids were determined as per the methods of (FIL-IDF, 1987). the pH value was estimated by immersing a digital pH meter (LMPH-12 pH Meter, Labman Scientific Instruments Pvt. Ltd, India) in the dispersion of quarg cheese in water at a 1:1 ratio. The titratable acidity was measured by Lepesioti et al.13. All the analyses were done in triplicates.
Color Evaluation
Color analysis was carried out using a ColorFlex EZ spectrophotometer (Hunterlab, Virginia, USA). The parameters which were studied: were lightness(L), the red-green domain (a), and the yellow-blue domain(b) 14. The instrument was calibrated with a black and white standard plate respectively, and the measurements were performed in triplicate. The total color difference (ΔE) was calculated using the following formula:
ΔE=√(ΔL)2 + (Δa)2 + (Δb)2
where ΔL represents the lightness difference between the sample and standard colors, Δa represents the redness or greenness difference between the sample and standard colors and Δb represents the blueness-yellowness difference between sample and standard colors.
The Whiteness Index (Wi (Hunter)) and the Yellowness Index (Yi (FC)) were calculated using the following formulae 15:
Wi (Hunter) = L* – 3X b*
Yi (FC) = 142.86 X b/L
Characterization of Quarg Cheese
FTIR and UV-Vis Spectrophotometry
JASSCO V-650 UV-visible spectrophotometer with a spectral range of 200-800 nm and a scan rate of 2 nm/s was used to measure the UV-Vis absorption spectroscopic measurement of the prepared quarg cheese samples. The FTIR transmittance spectroscopic measurement of the quarg cheese samples was calculated using an Alpha Bruker Eco-ATR equipped with a ZnSe ATR crystal and a spectral range of 600-4000 cm-1 over 64 scans at a resolution of 4 cm-1. The spectroscopic experiments were all carried out at room temperature.
Texture analysis Quarg cheese
Textural Profile Analysis (TPA) of all Quarg cheese samples was conducted using Texture Analyzer TA. XT plus (Stable Micro Systems, Surrey, UK), using a 5 kg load cell. The samples were compressed using a cylindrical probe of 6 mm diameter. Quarg cheese samples were uniformly leveled in the sample holder before the testing. The samples were penetrated to a depth of 10 mm, having a test speed of 2mm/sec. The textural parameters that were studied in the TPA include hardness, adhesiveness, cohesiveness, springiness, and gumminess.
Rheological analysis of the Quarg cheese
Rheological analysis of the quarg cheese samples was tested using a controlled stress rheometer (MCR 702e, Anton Par, GmbH, Germany) attached with Rheoplus software. The setup uses the parallel plate geometry with a gap of 1.0 mm. The fresh quarg cheese sample readings were taken at 25°C and were kept at an equilibration period of 60 sec before final testing. The required volume of the sample was placed in between the cone-plate system and the excess sample was trimmed off. The strain sweep test was conducted within the linear viscoelastic region.
Sensory analysis
Twenty semi-trained panelists chosen based on availability, objectiveness, and cheese-tasting experience conducted a sensory assessment for organoleptic evaluation of the quarg cheese. The score was given according to the 9-point hedonic scale. The sensory analysis was carried out as per Koca and Metin 16.
Fluorescence Microscopy
Quarg cheese samples were spread with a knife to a thickness of around 5 mm and then put on microscope slides. To avoid moisture evaporation, the sample’s exterior layer was coated with paraffin oil. A second microscope slide was put on top of the first. To minimize possible thickness changes caused by temperature fluctuations during analysis, the samples were allowed to equilibrate at 22°C for 15 minutes. For fluorescence microscopy measurements (ZEISS Axioscope (Carl Zeiss, Hamburg, Germany)), fluorescent staining agents for lipids and proteins were Nile red and Rhodamine B, respectively 17.
Statistical analysis
RheoCompass (Anton Paar GmbH, Germany) and OriginPro software (version 9.9.0 from OriginLab Corporation, Northampton, USA) were used to examine the rheological data (loss modulus, storage modulus, strain rate) and graphical interpretation of data. Analysis of variance (ANOVA) was used to examine the data obtained. To ensure statistical significance, p<0.05 was used. The experiments were carried out in triplicates.
Results and Discussion
Proximate and sensory analysis
The goal was to provide a fat range rather than precise fat levels and thus, the quarg cheese samples produced had fat percentages ranging from 6.0 ± 0.01 (QC1), 3.5 ± 0.03 (QC2), 1.5 ± 0.03 (QC3), and 0.5 ± 0.02 (QC4). The results obtained for moisture, protein, acidity, pH, and ash of quarg cheese samples are shown in Table 1. Sattar et al. 18 observed that the cheese’s moisture and protein content is raised when the fat content is lowered. The quarg cheese samples QC1 and QC4 are in agreement with this statement but sample QC2 had increased protein and moisture content was close to that of QC1. Sample QC3 whereas showed highest moisture values and lower protein content among all the samples. The lower protein values obtained in QC3 samples may be due to protein losses during de-wheying and processing.The instrumental color characteristics of the cheese samples are shown in Table 2. The L* value increases from 87.2 ± 2.04 (QC1) to 90.61 ± 1.56 (QC4) which indicates the increment in the whiteness with reduction in fat level 8 .The Yellowness index reduced from 18.05 ± 0.24 (QC1) to 15.36 ± 0.44 (QC4) which can be attributed due to the reduction in fat content. Similarly, the b* value reduces from 11.02 ± 0.62 to 9.74 ± 0.56.
Table 1: Physico-chemical analysis of Quarg cheese samples
|
Sample |
Moisture |
Fat |
Protein |
Ash |
Acidity |
pH |
|
QC1 |
77.31 ± 1.79a |
6.0±0.01a |
14.38±0.33b |
1.05±0.02b |
0.78±0.18b |
4.67±0.11a |
|
QC2 |
76.60 ± 1.91a |
3.5±0.03b |
15.29±0.35bd |
1.15±0.03bc |
0.83±0.02bd |
4.79±0.11a |
|
QC3 |
80.82 ± 1.15a |
1.5±0.03c |
13.13±0.30bc |
1.09±0.03b |
0.96±0.04ae |
4.89±0.11a |
|
QC4 |
75.42± 1.08a |
0.5±0.02d |
16.71±0.39ad |
1.26±0.03ac |
0.88±0.02cde |
4.66±0.10a |
Data are presented as means ±SEM (n = 3). Means in each row with different superscripts were significantly different (p < 0.05) from each other
Table 2: Instrumental color characteristics of Quarg cheese samples
|
Sample |
L |
a* |
b* |
ΔE |
Wi (Hunter) |
Yi (FC) |
|
QC1 |
87.2 ± 2.04 ab |
-1.7 ± 0.08a |
11.02 ± 0.62b |
87.91 ± 2.85a |
54.14 ± 1.46b |
18.05 ± 0.24ac |
|
QC2 |
88.05 ± 1.88 c |
-1.66 ± 0.14a |
10.54 ± 0.74a |
88.69 ± 2.18ab |
56.43 ± 1.22a |
17.10 ± 0.25b |
|
QC3 |
88.52 ± 2.63 a |
-1.58 ± 0.13b |
10.23 ± 0.88a |
89.12 ± 2.58a |
57.83 ± 0.88a |
16.51 ± 0.38a |
|
QC4 |
90.61 ± 1.56a |
-1.54 ± 0.08ab |
9.74 ± 0.56c |
91.15 ± 1.26a |
61.39 ± 1.65ab |
15.36 ± 0.44c |
Data are presented as means ±SEM (n = 3). Means in each row with different superscripts were significantly different (p < 0.05) from each other
Effect of fat content on functional properties of quarg cheese
Typically, the analysis of cheese samples demonstrates the presence of distinct amide bands (ranging from 1,650 to 1,540 cm–1) and prominent water absorption bands spanning the 3,700 to 3,000 cm–1 range. The absorption of water between the wavenumbers of 1,700 and 1,600 cm-1 can also affect the amide I and II signals 19. The stretch vibrations of the acyl chain C-H bonds, namely in the range of 3,000 to 2,800 cm–1, are frequently employed in the analysis of fat content. It was observed that the absorbance of fat-related bands in cheese dropped proportionally with a decrease in the fat level, consistent with expectations. The findings were consistent with the proximate analysis, as a decrease in fat content corresponded to a modest rise in protein content. According to the findings of Mendenhall 20, it was observed that reducing the fat content in cheese resulted in an increase in the strength of protein-related bands within the spectral range of 3030 to 2500 cm-1, 1698 to 1656 cm-1, 1621 to 1038 cm-1, 1017 to 990 cm-1, and 850 to 841 cm-1. The results obtained in this study indicate a decrease in fat concentration, as seen by the absence of bands typically associated with fatty acids and fatty acid esters (Fig (2a)).
The UV-Vis technique is employed to quantify the wavelength and intensity of ultraviolet and visible light that is absorbed by a given material. Fig 2(b) illustrates the ultraviolet-visible (UV-Vis) absorption spectra of QC1, QC2, QC3, and QC4. The transition from the n to π* state is induced by the absorption of light in the vicinity of the 300nm wavelength range. Phenolic acids exhibit UV absorption at wavelengths of 270–280 nm and 305–340 nm, whereas flavonoids demonstrate UV absorption at wavelengths of 270–280 nm and 310–350 nm 21. The aromatic amino acids exhibit ultraviolet absorption at a wavelength of 280 nm 22. Various quality control (QC) samples exhibited absorbance readings at different wavelengths: QC4 at 339nm, QC1 at 340nm, QC2 at 341nm, and QC3 at 342nm. The tested samples exhibited singular bands that did not exhibit significant absorption at lower wavelengths (200-250 nm), indicating the occurrence of a transition from n → π* 23.
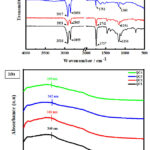 |
Figure 2: FTIR (2a) and UV-Vis (2b) analyses of |
Effect of fat content on textural properties of quarg cheese
The texture is a critical sensory feature that customers use to determine the quality of food. The textural component is influenced by the cheese’s response to applied chewing pressures, such as compression between the molars or shearing in the mouth 24. The assessment of cheese textural features using instrumental methods enables the identification of critical elements affecting the sensory characteristics of cheese and the provision of quantitative data that aids in the prediction of food sensory performance 25. Force/deformation methods are widely employed to quantify the textural qualities of solid and semisolid meals objectively. Compression tests, such as texture profile analysis, are typically used to analyze the texture of cheeses (TPA). The TPA is an instrumental test that was created to give objective texture parameter data. It is a two-cycle compression that simulates chewing 26. Hardness, springiness, adhesiveness, gumminess, chewiness, and cohesiveness are all textural qualities.
Low-fat rennet–curd cheeses generally have a compact structure, which enhances their hardness, dryness, graininess, and springiness 18 while decreasing their adhesiveness and cohesiveness. In the quarg cheese samples, the reduction of fat resulted in higher hardness values and springiness values (Table 3). QC2 samples dues to its increased moisture content as compared to QC1 samples showed lower hardness values. The comparatively high degree of calcium retention in low-fat cheeses also adds to the product’s hardness 27. In general, the type of milk used, process parameters, culture, and rennet addition all have a direct effect on the cohesiveness of the cheese produced. Casein takes on a larger part in texture formation when fat content decreases28. The higher cohesiveness values of QC4 samples are due to higher strength in the internal bonds caused by casein which helps it sustain deformation before rupturing. It can be observed that the fat content aided in the increased adhesiveness values of QC1 and QC2 quarg samples. By improving the moisture retention capacity of curd, fat indirectly impacts the water-to-protein ratio and governs the firmness and elasticity of cheese. The fat globules included inside the protein network of the cheese matrix function as fillers, preventing the casein chains from binding, hence increasing their fusion ability 29. This can be a reason for increased adhesiveness values in high-fat samples (QC1 and QC2) as compared to low-fat (QC3 and QC4) samples. Gumminess is the springy and rubbery characteristic of the sample and is described as the energy needed to disintegrate a semi-solid food until it is ready to swallow and the QC4 sample had higher gumminess values (21 ± 0.14) followed by QC3 (18 ± 0.09), QC2 (16 ± 0.05) and QC1 (14 ± 0.04) which can be a virtue of reduced smoothness and increased firmness of the low-fat product 30.
Table 3: Textural analysis of Quarg cheese samples
|
Sample |
Hardness (g) |
Adhesiveness (mJ) |
Cohesiveness (-) |
Springiness (mm) |
Gumminess (g) |
|
QC1 |
25 ± 0.05a |
0.6 ± 0.02b |
0.69 ± 0.11b |
8.19 ± 0.13a |
14 ± 0.04a |
|
QC2 |
15 ± 0.06c |
0.3 ± 0.01a |
0.14 ± 0.05a |
2.15 ± 0.08ac |
16 ± 0.05ab |
|
QC3 |
35 ± 0.19a |
0.3 ± 0.06a |
0.53 ± 0.14a |
15.38 ± 0.18a |
18 ± 0.09b |
|
QC4 |
40 ± 0.25b |
0.3 ± 0.01b |
0.51 ± 0.03a |
14.57 ± 0.22b |
21 ± 0.14ac |
Data are presented as means ±SEM (n = 3). Means in each row with different superscripts were significantly different (p < 0.05) from each other
Effect of Fat on rheological properties of Quarg Cheese
Mechanical and rheological testing can be used to get a variety of information 31. The term “rheological characteristics” refers to a cheese’s ability to retain its integrated structure. Cheeses are rheologically characterized by putting them to stress and observing their deformation behavior. They can be classed as perfect elastic solids, ideal viscous liquids, or viscoelastic solids, depending on their deformation qualities 32. As the structure of cheese is a continuous protein gel network broken by distributed fat globules, from a materials science standpoint, this is a two-phase material composed of a continuous protein gel phase (which incorporates protein, water, and dissolved particles) and an inter-dispersed fat phase 33.
Rheological assays apply constant stress or strain to a sample and study the link between stress, strain, and the timeframe of foods. This feature enables mechanical and rheological measurements to be made to characterize the texture of cheese 34,35. Cheese is often categorized as a viscoelastic material since it shows both solid and liquid characteristics in terms of stress–strain ratio36,37. The fat content of food emulsions is a critical component in determining their rheological qualities 38. In the case of most protein gels, augmenting the protein content leads to an enhanced stiffness (increased gel network elasticity) and strength of the network, primarily attributable to the heightened protein density inside the network. Based on the above parameters, it can be inferred that a decrease in the proportion of fat in the phase and an increase in the protein content inside the gel phase will likely lead to the formation of a cheese with a firmer texture 39.
The G′, also known as the storage modulus, quantifies the amount of energy stored during each oscillation cycle. The G′′, or viscous or loss modulus, measures the amount of energy dissipated as heat per cycle. Additionally, the loss tangent (tan δ), which represents the ratio of the viscous properties to the elastic properties, is another important parameter derived from these tests. The determination of the linear range can be achieved by conducting a strain sweep, wherein the storage modulus (G’) is measured while keeping the frequency (ω) constant. A strain in the linear area is then chosen, and a frequency sweep is done, in which measurements are taken as is altered. For precision, should be limited to three orders of magnitude, for example, 1 to 100 rad/s. It was found that the G′, G′′, and η* (complex viscosity) values were greater in low-fat cheese than in high-fat cheese according to Tunick et al. 40. It was also observed that with a reduction in cheese fat, the loss of tangent also dropped. Elimination of fat results in a reduced fat-to-protein ratio, which results in a denser protein structure, which makes the cheese tougher1. Ozer et al.41 studied the rheological characteristics of Labneh, a condensed fermented milk comparable to quarg, and discovered that it was a mild viscoelastic gel with G′ larger than G′′. Both moduli arose as and protein content increased. Kelly and O’Donnell42 investigated quarg, an acid-precipitated product with an 80% water content, and discovered that both proteolysis and premanufacture hydrolysis reduced G′ values.
The strain sweep test was performed on the quarg cheese samples inside the linear viscoelastic area, as depicted in Fig 3. The values of G′ and G″ exhibited a positive correlation with the frequency (ω) ranging from 1 to 100, indicating an increase in their magnitudes as the frequency increased. In the analysis of several cheese samples, it was observed that the value of G’ consistently exceeded that of G”, indicating the presence of viscoelastic properties in quarg cheese. Sample QC4 had the greatest values of G’ and G” due to its elevated protein content, while sample QC3 demonstrated comparatively lower G’ and G” values in comparison to all other samples. The observed phenomenon can be attributed to the elevated moisture content and reduced protein content of the sample. Previous research has demonstrated that the storage modulus (G’) diminishes when moisture levels rise in non-fat substances 43. The observed higher storage modulus values were found to be consistent with the corresponding higher hardness measurements obtained for sample QC4. This finding demonstrates that the reduction in fat content in quarg cheese samples resulted in an enhancement of the protein network’s strength. Additionally, it led to an increase in the frequency-dependent behavior of the rheological moduli. The complex viscosity of all the samples exhibited a drop as the frequency increased, as depicted in Fig 3. This can be attributed to the concurrent decrease in both the storage and loss modulus with increasing frequency.
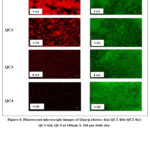 |
Figure 3: Viscoelastic behavior being show by rheological parameters for QC1, QC2, QC3 and QC4 |
Microstructure
The fluorescence microscopic studies of the cheese samples were conducted to understand the distribution of fat and protein phases in Quarg cheese. The microscopic studies of fresh cheese like Quarg are less explored whereas confocal laser scanning microscopic studies have been conducted on hard cheese varieties like Cheddar with varying fat content 7. For analyzing the quarg cheese samples, Rhodamine B dye (stains protein green) and Nile red (stains lipid red) were used (Fig 4). The fluorescence images of QC1 show the clustered fat globules resulting from higher fat content (Fig. 4 (a)) and a distributed protein phase. As the fat content is reduced in samples QC2, QC3 and QC4, a visible difference in fat distribution can be seen (Fig 4(b-d)). The fat globules are scattered and globule size is gradually decreasing as they are entrapped in the emulsion 44. The aggregated protein network can be seen in all the samples and the compactness of the protein phase at an increased rate in sample QC4 is in reasonable agreement with the rheological and textural analysis results (Fig 4(d)).
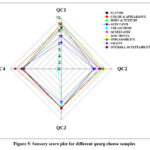 |
Figure 4: Fluorescent microscopic images of Quarg cheese; 4(a) QC1 4(b) QC2 4(c) QC3 4(d) QC4 at 100µm X 100 µm field size. |
Sensory analysis (flavor, color & appearance, body & texture, acid taste, cream odor, aftertaste, mouthfeel, spreadability, grainy)
The time sequence of structural breakdown and mixing with saliva during oral processing results in the sensory textural qualities of cheese 45. It’s possible to break down sensory texture phrases into “initial bite” and “chew down” categories 46. Elimination of fat results in a reduced fat-to-protein ratio, which results in a denser protein structure, which makes the cheese have a tougher body1. The same was seen in the results obtained for the body, texture, and spreadability of the cheese samples as reduction in fat content decreased the spreadability and increased the hardness of the cheese. The fundamental edible sensations associated with fat-containing meals include viscosity (thickness, body, and fullness) and lubricity (creaminess, smoothness) 47. Thus, the sensory evaluation results for flavor and overall acceptability were higher in QC1 samples as a result of higher fat content as compared to its counterparts. According to many food formulation specialists, the major distinction between low-fat and full-fat products is mouthfeel. Reduction in fat percentages reduced the mouthfeel scores for QC3 and QC4. The sensory scores for acid taste in low-fat cheese samples were higher as a result of higher acidity in the samples which can be a result of excess fermentation or rennet addition.
Calcium acts as a glue that keeps these proteins together and helps them retain a stable structure. Thus, increased concentrations of proteins in the matrix might result in increased stiffness. It has been discovered that reducing fat allows for a greater degree of fusion between casein chains during gel formation, which impacts the product’s fusion capability by reducing the smoothness of the product 32. Due to increased protein content and decreased fat content, the QC4 sample showed higher graininess values as compared to the high-fat QC1 sample. The diminished mouthfeel and after-taste in low-fat quarg cheese samples are attributed to changes in the breakdown pattern during chewing, as altered by fat disrupting the cheese network. The low-fat content samples QC3 and QC4 had higher color and appearance scores as they had the desired milky-white color of quarg cheese rather than slight yellow color in samples with higher fat percentages. The result of the organoleptic assessment of QC1, QC2, QC3, and QC4 is shown in the radar plot in Fig 5 respectively, where each corner represents a single attribute and each line indicates the scores ranging from 0 to 9.
Conclusion
The textural and rheological properties of fresh unripened varieties of cheese are generally unexplored. Quarg is a lesser-known variety of unripened cheese compared to cottage and mozzarella cheese leading to very few studies related to it. This study aimed to explore the textural, sensorial, rheological, and microstructural analysis of quarg cheese as fat percentages varied. The results obtained showed higher hardness results for quarg cheese samples with increased protein content owing to its intense protein network whereas samples with higher fat content had increased adhesiveness values. The rheological studies justified the viscoelastic properties of quarg cheese along with fluorescence microscopic studies indicating the structural distribution of fat and protein in the cheese matrix. The sensorial properties were superior in high-fat samples and had increased acceptability whereas low-fat quarg samples had more structural integrity.
Acknowledgment
The authors gratefully acknowledge to Institution of Eminence (IoE) scheme, Banaras Hindu University, Varanasi (U.P.) India, for financial support under the Incentive to Seed Grant under IoE Scheme (Dev. Scheme No 6031 & PFMS Scheme No 3254). The authors are also thankful to Prof. Madhu Tapadia and Dr. Khusboo, Department of Zoology, Banaras Hindu University for providing the CLSM facility.
Conflict of Interest
The authors declare no conflict of interest.
Funding Sources
The authors received no financial support for the research, authorship, and/or publication of this article.
References
- Johnson ME, Chen CM. Technology of manufacturing reduced-fat Cheddar cheese. In: Chemistry of Structure-Function Relationships in Cheese. Springer; 1995:331-337.
CrossRef - Shoemaker CF, Nantz J, Bonnans S, Noble AC. Rheological characterization of dairy products: an understanding of the rheological properties of milk and other dairy foods in important to texture, stability, and process design. Food technology (Chicago). 1992;46(1):98-104.
- Bryant A, Ustunol Z, Steffe J. Texture of Cheddar cheese as influenced by fat reduction. J Food Sci. 1995;60(6):1216-1219.
CrossRef - Farkye NY. Quark, Quark-like Products, and Concentrated Yogurts. Vol 1. Fourth Edi. Elsevier Ltd; 2017. doi:10.1016/B978-0-12-417012-4.00043-0
CrossRef - McSweeney PLH, Ottogalli G, Fox PF. Diversity of cheese varieties: an overview. Cheese: chemistry, physics and microbiology. 2004;2:1-23.
CrossRef - Messens W, van de Walle D, Arevalo J, Dewettinck K, Huyghebaert A. Rheological properties of high-pressure-treated Gouda cheese. Int Dairy J. 2000;10(5-6):359-367.
CrossRef - Rogers NR, McMahon DJ, Daubert CR, Berry TK, Foegeding EA. Rheological properties and microstructure of Cheddar cheese made with different fat contents. J Dairy Sci. 2010;93(10):4565-4576.
CrossRef - Madadlou A, Khosroshahi A, Mousavi ME. Rheology, microstructure, and functionality of low-fat Iranian white cheese made with different concentrations of rennet. J Dairy Sci. 2005;88(9):3052-3062.
CrossRef - Guinee TP, Auty MAE, Fenelon MA. The effect of fat content on the rheology, microstructure and heat-induced functional characteristics of Cheddar cheese. Int Dairy J. 2000;10(4):277-288.
CrossRef - Mistry V V. Low fat cheese technology. Int Dairy J. 2001;11(4-7):413-422.
CrossRef - S BI. Handbook of Food Analysis, Part XI: Dairy Products. 1981.
- Standard IDF. Milk: Determination of nitrogen content (Kjeldahal method). IDF Standard 20-A. International Dairy Federation, Brussels, Belgium. 2001.
- Lepesioti S, Zoidou E, Lioliou D, Moschopoulou E, Moatsou G. Quark-Type Cheese: Effect of Fat Content, Homogenization, and Heat Treatment of Cheese Milk. Foods. 2021;10(1):184.
CrossRef - Diezhandino I, Fernández D, Sacristán N, Combarros-Fuertes P, Prieto B, Fresno JM. Rheological, textural, colour and sensory characteristics of a Spanish blue cheese (Valdeón cheese). LWT-Food Science and Technology. 2016;65:1118-1125.
CrossRef - Hirschler R. Whiteness, yellowness, and browning in food colorimetry: A critical review. Color in food. 2012:118-129.
CrossRef - Koca N, Metin M. Textural, melting and sensory properties of low-fat fresh kashar cheeses produced by using fat replacers. Int Dairy J. 2004;14(4):365-373. doi:10.1016/J.IDAIRYJ.2003.08.006
CrossRef - Ong L, Dagastine RR, Kentish SE, Gras SL. Microstructure of milk gel and cheese curd observed using cryo scanning electron microscopy and confocal microscopy. LWT-Food Science and Technology. 2011;44(5):1291-1302.
CrossRef - Sattar MU, Sameen A, Huma N, Shahid M. Exploit fat mimetic potential of different hydrocolloids in low fat Mozzarella cheese. Journal of Food and Nutrition Research. 2015;3(8):518-525.
- Subramanian A, Harper WJ, Rodriguez‐Saona LE. Rapid prediction of composition and flavor quality of cheddar cheese using ATR–FTIR spectroscopy. J Food Sci. 2009;74(3):C292-C297.
CrossRef - Mendenhall I Von. Rapid determination of milk components and detection of adulteration using Fourier transform infrared technology. 1992.
- Liu H, Han G, Zhang H, Liu Q, Kong B. Improving the physical and oxidative stability of emulsions based on the interfacial electrostatic effects between porcine bone protein hydrolysates and porcine bone protein hydrolysate-rutin conjugates. Food Hydrocoll. 2019;94:418-427.
CrossRef - Chotphruethipong L, Aluko RE, Benjakul S. Hydrolyzed collagen from porcine lipase‐defatted seabass skin: Antioxidant, fibroblast cell proliferation, and collagen production activities. J Food Biochem. 2019;43(5):e12825.
CrossRef - Pratiwi RA, Nandiyanto ABD. How to read and interpret UV-VIS spectrophotometric results in determining the structure of chemical compounds. Indonesian Journal of Educational Research and Technology. 2021;2(1):1-20.
CrossRef - Guinee TP, Fox PF. Salt in cheese: physical, chemical and biological aspects. In: Cheese. Elsevier; 2017:317-375.
CrossRef - Chung C, McClements DJ. Structure and texture development of food-emulsion products. In: Modifying Food Texture. Elsevier; 2015:133-155.
CrossRef - Nishinari K, Kohyama K, Kumagai H, Funami T, Bourne MC. Parameters of texture profile analysis. Food Sci Technol Res. 2013;19(3):519-521.
- Mohamed AG. Low-fat cheese: A modern demand. International Journal of Dairy Science. 2015;10(6):249-265.
CrossRef - Metzger LE, Mistry V v. A new approach using homogenization of cream in the manufacture of reduced fat Cheddar cheese. 2. Microstructure, fat globule distribution, and free oil. J Dairy Sci. 1995;78(9):1883-1895.
CrossRef - Gunasekaran S, Ak MM. Cheese Rheology and Texture. CRC press; 2002.
CrossRef - Brighenti M, Govindasamy-Lucey S, Lim K, Nelson K, Lucey JA. Characterization of the rheological, textural, and sensory properties of samples of commercial US cream cheese with different fat contents. J Dairy Sci. 2008;91(12):4501-4517.
CrossRef - del Nobile MA, Chillo S, Mentana A, Baiano A. Use of the generalized Maxwell model for describing the stress relaxation behavior of solid-like foods. J Food Eng. 2007;78(3):978-983.
CrossRef - Fox PF, Guinee TP, Cogan TM, McSweeney PLH. Cheese yield. In: Fundamentals of Cheese Science. Springer; 2017:279-331.
CrossRef - Visser J. Factors affecting the rheological and fracture properties of hard and semi-hard cheese. Federation Internationale de Laiterie; International Dairy Federation. 1991.
- Benedito J, Gonzalez R, Rosselló C, Mulet A. Instrumental and expert assessment of Mahon cheese texture. J Food Sci. 2000;65(7):1170-1174.
CrossRef - Pinho O, Mendes E, Alves MM, Ferreira I. Chemical, physical, and sensorial characteristics of “Terrincho” ewe cheese: changes during ripening and intravarietal comparison. J Dairy Sci. 2004;87(2):249-257.
CrossRef - O’Callaghan D, Guinee T. Rheology and texture of cheese, in cheese: chemistry, physics and microbiology, vol. 1. 2004.
CrossRef - Konstance RP, Holsinger VH. Development of rheological test methods for cheese. Food technology (Chicago). 1992;46(1):105-109.
- McClements DJ, Demetriades K. An integrated approach to the development of reduced-fat food emulsions. Crit Rev Food Sci Nutr. 1998;38(6):511-536.
CrossRef - Vaziri M, Abbasi H, Mortazavi A. Microstructure and physical properties of quarg cheese as affected by different heat treatments. J Food Process Preserv. 2010;34:2-14.
CrossRef - Tunick MH, Malin EL, Smith PW, et al. Proteolysis and rheology of low fat and full fat Mozzarella cheeses prepared from homogenized milk. J Dairy Sci. 1993;76(12):3621-3628.
CrossRef - Ozer BH, Bell AE, Grandison AS, Robinson RK. Rheological properties of concentrated yoghurt (labneh). J Texture Stud. 1998;29(1):67-79.
CrossRef - Kelly AL, O’Donnell HJ. Composition, gel properties and microstructure of quarg as affected by processing parameters and milk quality. Int Dairy J. 1998;8(4):295-301.
CrossRef - Olson NF, Gunasekaran S, Bogenrief DD. Chemical and physical properties of cheese and their interactions. Nederlands melk en Zuiveltijdschrift. 1996;50(2):279-294.
- Nugrahini A, Lhamo S. Understanding product build up at packaging material surface to address food waste. 2019.
- Hutchings JB, Lillford PJ. The perception of food texture‐the philosophy of the breakdown path. J Texture Stud. 1988;19(2):103-115.
CrossRef - Foegeding EA, Drake MA. Invited review: Sensory and mechanical properties of cheese texture. J Dairy Sci. 2007;90(4):1611-1624.
CrossRef - Sandrou DK, Arvanitoyannis IS. Low-fat/calorie foods: current state and perspectives. Crit Rev Food Sci Nutr. 2000;40(5):427-447.
CrossRef

This work is licensed under a Creative Commons Attribution 4.0 International License.


