
Introduction
Lifestyle scoring systems are methods of evaluating and quantifying the habits and behavior patterns of individuals, with the aim of promoting healthier and more balanced lifestyles. This concept has gained particular attention in recent years, particularly among college students, where there is a growing recognition of the need to balance academic demands with physical and mental well-being. College students are known to face a range of challenges, including stress, poor sleep habits, unhealthy diets, and sedentary behaviour. These lifestyle factors can have significant impacts on their physical and mental health, as well as their academic performance. In response, many universities and college health organizations have started to introduce lifestyle scoring systems to help students track and monitor their habits, and encourage them to make positive changes1. The aim of these systems is to provide students with a comprehensive picture of their current lifestyle, and to identify areas where they can make improvements. This is achieved by using a variety of metrics, such as physical activity levels, dietary habits, sleep patterns, and stress levels. The data collected is then used to generate a score, which provides a snapshot of the individual’s overall lifestyle.
One of the most important advantages of lifestyle scoring systems is that they enable students to see the impact of their habits on their health and well-being. They may notice, for example, how poor sleep habits affect their energy levels and productivity, or how sedentary behaviour can lead to weight gain and poor cardiovascular health. If students observe the actual effect of their activities on their life, they may be inspired more to make positive changes. Another advantage of these systems is that they provide students with a community and a support network. Students can receive encouragement and support from peers and health professionals by sharing their scores and progress with others. This can help to foster accountability and encourage students to participate. However, there are also some potential drawbacks to these systems. For example, some students may become overly focused on their score, leading to stress and anxiety. Additionally, there is a risk that these systems could be used to shame or judge individuals based on their lifestyle choices. To mitigate these risks, it is important that lifestyle scoring systems are implemented in a way that is transparent, ethical, and supportive of all students2.
Context
Lifestyle scoring systems have the possibility of serving as a successful tool for encouraging college students to live healthier, more balanced lifestyles. These systems can help to improve both physical and mental health, as well as academic performance, by providing students with a comprehensive picture of their habits and encouraging them to make positive changes3. However, it is critical to ensure that they are implemented in a transparent, ethical, and supportive manner for all students. Some systems collect information about an individual’s lifestyle using self-reported data, such as surveys or diaries. Other systems track physical activity levels and sleep patterns using wearable technology such as fitness trackers or smartwatches4.
Some of the most popular lifestyle scoring systems include:
The Global Physical Activity Questionnaire (GPAQ) is a self-administered survey that evaluates individuals’ levels of physical activity in different areas of their lives5.
The International Physical Activity Questionnaire (IPAQ) is a self-administered survey that assesses adults’ levels of physical activity6.
The ActiGraph is a hip-worn wearable device that measures physical activity levels using accelerometry.
The Multifactor Leadership Questionnaire (MLQ) is a self-administered survey that assesses individuals’ leadership styles5.
Among college students, there are no special lifestyle scoring systems tailored to developing populous countries such as India. As a result, we intend to create a scoring system and possibly arrive at a value to categorise people with poor and unhealthy lifestyle
Methods
Study primer
The research was carried out at a reputable college in Kumbakonam, South India. The study was approved by the college’s dean. All students were informed about the purpose of the study and provided informed permission. The study was a collection of data and filling up of a google form and involved no active intervention for the participants, it was less than minimal risk in terms of ICMR guidelines 2017. The study was completed in conformity with the Helsinki Declaration. The ethical committee accepted the study, and all ethical issues were addressed. (Ethical approval number – IRBSTH107/2019- India).
Data collection
The data collection was done in a designated gathering of 245 college students with explanation of the forms prior. The forms were sent as google forms and the students were asked to send the filled-up form through the appropriate way back to the researcher. Any queries in the filling of the forms were addressed immediately by the researcher team. Approximately 30 minutes were given for them to think and fill up. A few extra minutes were allowed in case of rare network problems.
Variables and measurement
The basic needs of a life style scoring should include dietary style and types, physical exercise, academic stress, and sleep patterns. The new scoring system developed by us was developed by a team of researchers headed by the primary author to suit certain Indian needs. Our experts agreed upon the fact that a job or a curriculum satisfaction is foremost in decreasing the academic stress. Hence as a part of the variable assessment, we stressed upon the satisfaction of college students towards their academic pursuit. The additions were milk-based diet, nurturing pets, and habits like alcoholism and smoking. We find in our experience that children with food habits based mainly on dairy are obese but the same finding is not with balanced diet. The alcohol which is easily accessible in this area is more of arrack type and students have fallen prey to these habits to develop cirrhosis at the age of 25 – 30. The association with pets is not described in any of the scoring systems. Hence, we find this more comprehensive than the any established ones. The details of arriving at the consensus of these questions by the experts are explained in the validation section The scoring system was from 1 to 3 with 11 as minimal score and 33 as maximal score. The details were given in Table 1.
Table 1: showing the variables(item) and the scores for each variable.
|
Serial No. |
Item |
Score 3 |
2 |
1 |
|
1 |
Diet-timing, regularity |
regular 5-6days: / week |
1-2 days / week |
Rare |
|
2 |
Veg/NV |
Veg |
Occasional |
Regular |
|
3 |
Fruits / green vegetables |
regular 5-6days: / week |
1-2 days / week |
Rare |
|
4. |
fast food – parotta |
Nil |
Occasional |
routine |
|
5. |
Sleep – go to bed |
<10 pm |
10 – 11 pm |
> >11 pm |
|
6. |
Exercise |
Regular |
Occasional |
Nil |
|
7. |
Self-satisfied job/education |
Fully |
Partly |
Minimal |
|
8. |
alcoholism |
Nil |
Parties |
Regular |
|
9. |
Smoking |
Nil |
Less than 2-3/ day |
More than 3/day |
|
10 |
Milk/milk-based food |
Occasional |
1-2 /day |
Very regular 3-5 times / day |
|
11. |
PETS/hobbies |
Regular |
Occasional |
Nil |
The scores were constructed in such a way that a maximum score was 33 and a minimum score was 11 in an eleven-point variable scale. As there is growing concern about increasing alcoholism even among girl students, we purposely included smoking and alcoholism.
Validation of the questionnaire
Define the population of interest: We clearly defined the population of interest as college students in the age group of 19 – 21. The students belonged to a similar socio-economic profile and from the same college. The geographical location was precisely pre-determined to be of the same area.
Develop the questionnaire: We developed the questionnaire items based on the research question: What factors account to healthy lifestyle in the target population of college students The questionnaire items were clear, concise, and relevant. The questions were not leading and there were no duplications to confuse the rater.
Content validity: We interviewed 15 experts in the field which included doctors, nutritionist, professors with rich academic performance. The content validity was established by calculating the content validity ratio. (CVR)
Not needed
Useful but not essential
Essential
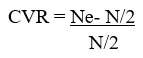
Ne = number of experts who told essential
N = total number of experts
For a panel of 15 experts the cut off value is 0.49. All the values of CVR were more than 0.6 to accept all the questions.
Pilot test the questionnaire: We administered the questionnaire to a small sample of twenty participants to test the questionnaire’s clarity, reliability, and validity. The answers were given precisely and without any uncertainty. The exploratory factor analyses did not significantly omit any question.
Test-retest reliability: We administered the questionnaire to the same participants on two different occasions to test the questionnaire’s stability over time. There was less than a 5 % change in the scores by every individual. This step established the questionnaire’s consistency and reliability. The kappa statistics were applied to test-retest with a p value of < 0.05 was considered significant with level of 0.9.
Construct validity: we compared the pilot sample study of twenty raters scores with Borillos lifestyle scores in high school students. We found the Pearson corelation coefficient to be 0.8.
Alpha statistics: We found the internal consistency test of our questionnaire to be moderately acceptable with alpha coefficient of 0.42.
Because no transcultural adaptation of the questionnaire was performed, the inclusion of people of different states and nationalities in the study sample could introduce bias and limit the results,7,8,9.
Statistics and the Receiver Operating Characteristic (ROC) curve
The Receiver Operating Characteristic (ROC) curve is a widely used diagnostic and research tool in medicine. The ROC curve aids in determining the best cut-off score for differentiating between two groups of interest, including those who have high and low scores. The ROC curve allows researchers to find the balance between the two measures by plotting the sensitivity (the proportion of true positive cases that are correctly identified) against the specificity (the proportion of true negative cases that are correctly identified) at each possible cut-off score. The ROC curve was used to determine the initial cut-off score in the case of the lifestyle scoring system, with perceived academic stress as the diagnostic variable. The ROC curve analysis provides valuable information about the accuracy of the lifestyle scoring system as a diagnostic tool and helps to identify the optimal cut-off score those best separates student with high and low scores. The optimal cut-off score is typically defined as the point on the ROC curve that is closest to the top left corner, where the true positive rate is maximized and the false positive rate is minimized. This is the point where the test has the highest diagnostic accuracy, meaning it can most accurately distinguish between the two groups of interest. The investigators can guarantee that the lifestyle scoring system is fair and unbased, and that it gives precise information to students about their lifestyle habits and their impact on their health and well-being by using the ROC curve to determine the cut-off score. Furthermore, using the ROC curve helps to ensure that the lifestyle scoring system is reliable, consistent, and effective in monitoring changes in students’ lifestyles over time10.
Statistics and cut off score determination
The Receiver Operating Characteristic Curve (ROC) was used to determine the initial cut-off score for this population. The relationship between sensitivity (true positives) and the inverse of specificity (true negatives) at each value along a dimensional screening scale as it relates to differentiating two groups of interest is depicted by ROC curve analysis (e.g. Low Score group and High Score group). Academic satisfaction was used as the diagnostic variable in the ROC calculation.
The data was fed into SPSS statistical software. The descriptive analyses with frequency and the percentage were derived from SPSS for the individual components. The ROC curve with percentage of sensitivity and specificity was done with SPSS software.
Results
All the 245 students completed the form and study was completed. The diet timing , regularity is described in Table 2.
Table 2: regarding regularity and timing of diet.
|
|
Frequency |
Percent |
Valid Percent |
Cumulative percent |
|
Valid rarely |
138 |
56.3 |
56.3 |
56.3 |
|
1-2 days/week |
54 |
22.0 |
22.0 |
78.4 |
|
5-6 days/week |
53 |
21.6 |
21.6 |
100.0 |
|
Total |
245 |
100.0 |
100.0 |
|
The table describes a high frequency of around 56.3 % of participants were irregular in dietary timings.
Table 3: showing the type of food.
|
|
Frequency |
Percent |
Valid Percent |
Cumulative percent |
|
Valid |
134 |
54.7 |
54.7 |
54.7 |
|
Occasional Non-veg |
60 |
24.5 |
24.5 |
79.2 |
|
Only veg |
51 |
20.8 |
20.8 |
100.0 |
|
Total |
245 |
100.0 |
100.0 |
|
Around 80 % consume nonvegetarian food with a regular intake of animal food in 54.7 % of participants. Around 38.4% were regular fruit eaters while 15 % do not take fruits at all. (Table 4).
Table 4: showing the frequency of fruit intake:
|
Frequency |
Percent |
Valid Percent |
Cumulative percent |
|
|
Valid rarely |
37 |
15.1 |
15.1 |
15.1 |
|
1-2 days/week |
114 |
46.5 |
46.5 |
61.6 |
|
5-6 days/week |
94 |
38.4 |
38.4 |
100.0 |
|
Total |
245 |
100.0 |
100.0 |
Table 5: showing the frequency of fast-food intake.
|
|
Frequency |
Percent |
Valid Percent |
Cumulative percent |
|
Valid Routinely |
24 |
9.8 |
9.8 |
9.8 |
|
Occasional |
212 |
86.5 |
86.5 |
96.3 |
|
Nil |
9 |
3.7 |
3.7 |
100.0 |
|
Total |
245 |
100.0 |
100.0 |
|
Regarding the diet, food and nutrition intake, the majority of students were irregular in consumption, with high incidence of nonvegetarian and fast-food consumption with less incidence of fruit intake.
Table 6: showing sleep timings
|
|
Frequency |
Percent |
Valid Percent |
Cumulative percent |
|
Valid After 11 pm |
78 |
31.8 |
31.8 |
31.8 |
|
Btw 10-11 |
132 |
53.9 |
53.9 |
85.7 |
|
before 10 pm |
35 |
14.3 |
14.3 |
100.0 |
|
Total |
245 |
100.0 |
100.0 |
|
Our study has shown that only 15.9 % do regular exercise and 32.7 % don’t exercise at all. (table7).
Table 7: showing the frequency of exercise
|
|
Frequency |
Percent |
Valid Percent |
Cumulative percent |
|
Valid After 11 pm |
78 |
31.8 |
31.8 |
31.8 |
|
Btw 10-11 |
132 |
53.9 |
53.9 |
85.7 |
|
before 10 pm |
35 |
14.3 |
14.3 |
100.0 |
|
Total |
245 |
100.0 |
100.0 |
|
Regarding the most important factor, only 42.9 % were completely satisfied and 9 % were not satisfied.
Table 8: Showing Satisfaction scores
|
|
Frequency |
Percent |
Valid Percent |
Cumulative percent |
|
Valid Minimal |
22 |
9.0 |
9.0 |
9.0 |
|
Partly |
118 |
48.2 |
48.2 |
57.1 |
|
Fully |
105 |
42.9 |
42.9 |
100.0 |
|
Total |
245 |
100.0 |
100.0 |
|
Less than 2 % had smoking and alcohol habits in our sample size. Out of the 245 students, 20.8 % did not take milk or milk-based food. The rest took milk based food on a regular basis.
Table 9: Intake of Milk food
|
|
Frequency |
Percent |
Valid Percent |
Cumulative percent |
|
Valid Regular |
78 |
31.8 |
31.8 |
31.8 |
|
1-2 times/day |
116 |
47.3 |
47.3 |
79.2 |
|
|
51 |
20.8 |
20.8 |
100.0 |
|
Total |
245 |
100.0 |
100.0 |
|
Table 10: showing the percentage of students involved in hobbies or having pets.
|
|
Frequency |
Percent |
Valid Percent |
Cumulative percent
|
|
Valid Nil |
31 |
12.7 |
12.7 |
12.7 |
|
Occasional |
124 |
50.6 |
50.6 |
63.3 |
|
Regularly |
90 |
36.7 |
36.7 |
100.0 |
|
Total |
245 |
100.0 |
100.0 |
|
ROC curve and determination of cut off value
Table 11: showing the coordinates of the curve
|
Positive if Greater Than or Equal Toa |
Sensitivity |
1 – Specificity |
|
15.00 |
1.000 |
1.000 |
|
16.50 |
1.000 |
.986 |
|
17.50 |
1.000 |
.964 |
|
18.50 |
.981 |
.900 |
|
19.50 |
.952 |
.821 |
|
20.50 |
.905 |
.657 |
|
21.50 |
.771 |
.464 |
|
22.50 |
.571 |
.221 |
|
23.50 |
.390 |
.100 |
|
24.50 |
.210 |
.036 |
|
25.50 |
.086 |
.000 |
|
26.50 |
.048 |
.000 |
|
27.50 |
.038 |
.000 |
|
29.00 |
.000 |
.000 |
There is at least one tie between the positive real state group and the negative actual state group in the test result variable(s): Points.
a. The least detected test value minus one is the lowest cutoff value, while the highest observed test value plus one is the greatest cutoff value. Every other cutoff value is the mean of two consecutively ordered observed test values.
Table 12: Area Under the Curve
|
Area |
Std. Errora |
Asymptotic Sig.b |
Asymptotic 95% Confidence Interval |
|
|
Lower Bound |
Upper Bound |
|||
|
.736 |
.032 |
.000 |
.673 |
.798 |
The test result variable(s): Points has at least one tie between the positive actual state group and the negative actual state group. Statistics may be biased.
a. Under the nonparametric assumption
b. Null hypothesis: true area = 0.5
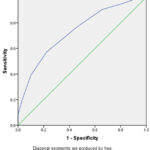 |
Figure 1: showing the ROC Curve. |
Table 13: Cut off code * Final Variable Cross tabulation.
|
|
Final Variable |
Total |
|||
|
Not satisfied |
Satisfied |
||||
|
Cut off code |
0 |
Count |
75 |
24 |
99 |
|
% within Cut off code |
75.8% |
24.2% |
100.0% |
||
|
% within Final Variable |
53.6% |
22.9% |
40.4% |
||
|
1 |
Count |
65 |
81 |
146 |
|
|
% within Cu toff code |
44.5% |
55.5% |
100.0% |
||
|
% within Final Variable |
46.4% |
77.1% |
59.6% |
||
|
Total |
Count |
140 |
105 |
245 |
|
|
% within Cutoff code |
57.1% |
42.9% |
100.0% |
||
|
% within Final Variable |
100.0% |
100.0% |
100.0% |
||
|
|
Final variable |
|
|
|
Satisfied |
Unsatisfied |
||
|
Cut off ≥ 21.5 |
81 (a) |
65 (b) |
146 |
|
Cut off <21.5 |
24 (c) |
75 (d) |
99 |
|
|
105 |
140 |
245 |
Positive predictive value = a/a+b *100 = 81/146*100 = 55.47%
Negative predictive value = d/c+d*100 = 75/99*100 = 75.75%
Sensitivity = a/a+c*100 = 81/105*100 =77.14%
Specificity = d/b+d*100 = 75/140*100 = 53.57%
False positivity rate = 1-specificty = 46.43%
False negativity rate = 1-sensitivity = 22.85%
Diagnostic
accuracy is given by AUC (0.736) lies between 0.7 to 0.8 which is good and
statistically significant (p<0.05),11,12.
Discussion
A person’s lifestyle can include a wide range of characteristics of their existence, including habits, activities, social interactions, physical and mental health, and general well-being. It’s crucial to understand that everyone has different definitions of what constitutes a “healthy” lifestyle, and what works for one person may not be the ideal strategy for another.13,14 In this study, we established the initial cut-off score for the Healthy Lifestyle Screening Tool and used it to determine the total scores of lifestyle behaviours in this population of college students. This population was divided into two groups, representing those with healthy lifestyles (scores greater than 21.5 out of 33) and those with unhealthy lifestyles (scores less than 21.5 out of 33). Subjects in the group with lower ratings on lifestyle behaviours would benefit from improving their lifestyle, whereas individuals in the group with better scores on lifestyle behaviours would benefit from encouragement. The statistically significant (p<0.05) result of the ROC analysis was used to determine the cut-off score, which was set at 21.5.
There are a lot of lifestyle scores which mainly focus on exercise, we intended to keep diet and sleep also with the scoring systems. The concept that the place of study or work forms a major reason for stress is being proposed by us and validated12. Ours is entirely different in adding milk-based product intake and their inverse relationship with lifestyle. This factor was added after an expert opinion on a consensus for South Indian young adults. Malekinejad13 et al have described that hormones present in dairy products can be detrimental to health and may be associated with increased incidence of cancers. Most of the other scoring systems describe the questionnaire into subclasses and analyse with factor analyses and decrease the questions. We opted for juicing the questions to the essential 11 with three scores each. The major limitation of our scores is a relatively low value of alpha. Yet there are opinions that a reliable score system need not be very valid. Hence, we adopted to a scoring system which is more valid with a moderately agreeable alpha value15. We presumed that a new scoring system would address the South Indian college students, with more importance to local issues.
Due to their potential to become future leaders, innovators, and economic contributors, college students have a significant impact on society. College students’ lifestyle and decisions can have a big influence on the community they live in. The lifestyle of college students is crucial for society since it influences the economy, community involvement, and education. College students can help shape a brighter life for themselves and their communities by leading healthy lifestyles.
Machova et al16 in their study, focused on the potential advantages of student interaction with therapeutic dogs prior to the final assessment test at a university. The study’s premise was to improve mood and reduce stress, which was objectively measured by a pressure gauge as well as subjectively perceived. This has been further established by many authors.17,18 Hence, we included the growing Pets as a tool in the questionnaire. This concept is handled by us for the first time.
Alotaibi et al 19have clearly corelated sleep quality and timings with stress especially among medical students. Hence our target population is a close match, we included the same in the questionnaire. According to the results of a few researches, there is a significant relationship between job satisfaction, job stress, and health. Job stress has a negative impact on health and job satisfaction. Software professionals with greater satisfaction with their work had lower levels of job stress and psychosomatic diseases20,21.
Even though our results showed poor quality of sleep and food intake in majority of students, we had a minimal incidence of alcohol and smoking in our sample.
Limitations
This study is only for college students of a particular area of the world. Hence, we need to study the same scoring systems as a multicentric study for a different variable. We may need to extrapolate for adults and do further analyses
Conclusion
The 11-question lifestyle questionnaire for college students is a valid and reliable tool for examining many elements of a student’s lifestyle, including exercise routines, eating habits, sleep quality, stress management, and social behaviour. Even though our results showed poor quality of sleep and food intake in majority of students, we had a minimal incidence of alcohol and smoking in our sample. A majority were non-vegetarians and there was considerable incidence of fast-food intake. The study’s cut-off value of 21.5, provides a simple and clear method for distinguishing between healthy and unhealthy lifestyles. This tool may be utilized to guide interventions in college students aimed at promoting healthy behaviours and improving academic success. Overall, this questionnaire is a useful tool for educators, health professionals, and researchers who want to encourage healthy lifestyle habits among college students.
Conflict of Interest
There is conflict of interest.
Funding Sources
The author(s) received no financial support for the research, authorship, and/or publication of this article.
References
- Müller C, El-Ansari K, El Ansari W. Health-Promoting Behavior and Lifestyle Characteristics of Students as a Function of Sex and Academic Level. Int J Environ Res Public Health. 2022 Jun 20;19(12):7539..
CrossRef - Assaf I, Brieteh F, Tfaily M, El-Baida M, Kadry S, Balusamy B. Students university healthy lifestyle practice: quantitative analysis. Health Inf Sci Syst. 2019 Mar 19;7(1):7.
CrossRef - Lacaille LJ, Dauner KN, Krambeer RJ, Pedersen J. Psychosocial and environmental determinants of eating behaviors, physical activity, and weight change among college students: a qualitative analysis. J Am Coll Health. 2011;59(6):531–538.
CrossRef - Pope ZC, Barr-Anderson DJ, Lewis BA, Pereira MA, Gao Z. Use of Wearable Technology and Social Media to Improve Physical Activity and Dietary Behaviors among College Students: A 12-Week Randomized Pilot Study. Int J Environ Res Public Health. 2019 Sep 25;16(19):3579.
CrossRef - C.L. Craig, A. Marshall, M. Sjostrom, A. Bauman,M. Booth, B. Ainsworth, et al. International Physical Activity Questionnaire: 12-country reliability and validity. Med Sci Sports Exerc, 35(2003), pp.1381–1395
CrossRef - Mumu SJ, Ali L, Barnett A, Merom D. Validity of the global physical activity questionnaire (GPAQ) in Bangladesh. BMC Public Health. 2017 Aug 10;17(1):650. doi: 10.1186/s12889-017-4666-0.
CrossRef - Kim CH, Kang KA. The validity and reliability of the Healthy Lifestyle Screening Tool. Phys Ther Rehabil Sci 2019;8:99-111.
CrossRef - Boateng GO, Neilands TB, Frongillo EA, Melgar-Quiñonez HR and Young SL (2018) Best Practices for Developing and Validating Scales for Health, Social, and Behavioral Research: A Primer. Front. Public Health 6:149.
CrossRef - Borillo CJ, Tamanal JM, Kim CH. Determining the Cut Off Score of the Healthy Lifestyle Screening Tool among High School Students. J Lifestyle Med. 2020 Jul 31;10(2):92-101.
CrossRef - Skwirczyńska E, Kozłowski M, Nowak K, Wróblewski O, Sompolska-Rzechuła A, Kwiatkowski S, Cymbaluk-Płoska A. Anxiety Assessment in Polish Students during the Russian-Ukrainian War. Int J Environ Res Public Health. 2022 Oct 14;19(20):13284. doi: 10.3390/ijerph192013284.
CrossRef - Liao, ZY., Jian, F., Long, H. et al. Validity assessment and determination of the cutoff value for the Index of Complexity, Outcome and Need among 12–13 year-olds in Southern Chinese. Int J Oral Sci 4, 88–93 (2012).
CrossRef - Ted Brown, Tore Bonsaksen, Sammy King Fai Hui. An examination of the structural validity of the Physical Self-Description Questionnaire-Short Form (PSDQ–S) using the Rasch Measurement Model. Cogent Education; (2019) : 6:1.
CrossRef - Dungog RJ, Tamanal JM, Kim CH. The Assessment of Lifestyle Status among High School and College Students in Luzon, Philippines. J Lifestyle Med. 2021 Jul 31;11(2):57-65.
CrossRef - Malekinejad H, Rezabakhsh A. Hormones in Dairy Foods and Their Impact on Public Health – A Narrative Review Article. Iran J Public Health. 2015 Jun;44(6):742-58.
- Chaparro-Rico, B.D.M.; Cafolla, D. Test-Retest, Inter-Rater and Intra-Rater Reliability for Spatiotemporal Gait Parameters Using SANE (an eaSy gAit aNalysis systEm) as MeasuringInstrument. Appl. Sci. 2020, 10, 5781.https://doi.org/10.3390/app10175781
CrossRef - Machová K, Procházková R, Vadroňová M, Součková M, Prouzová E. Effect of Dog Presence on Stress Levels in Students under Psychological Strain: A Pilot Study. Int J Environ Res Public Health. 2020 Mar 28;17(7):2286..
CrossRef - Meints K, Brelsford VL, Dimolareva M, Maréchal L, Pennington K, Rowan E, et al. (2022) Can dogs reduce stress levels in school children? effects of dog-assisted interventions on salivary cortisol in children with and without special educational needs using randomized controlled trials. PLoS ONE 17(6): e0269333.
CrossRef - Kertes DA, Liu J, Hall NJ, Hadad NA, Wynne CDL, Bhatt SS. Effect of Pet Dogs on Children’s Perceived Stress and Cortisol Stress Response. Soc Dev. 2017 May;26(2):382-401..
CrossRef - Alotaibi AD, Alosaimi FM, Alajlan AA, Bin Abdulrahman KA. The relationship between sleep quality, stress, and academic performance among medical students. J Family Community Med. 2020 Jan-Apr;27(1):23-28.
CrossRef - Madhura S, Subramanya P, Balaram P. Job satisfaction, job stress and psychosomatic health problems in software professionals in India. Indian J Occup Environ Med. 2014 Sep-Dec;18(3):153-61.
CrossRef - Liu, J., Zhu, B., Wu, J. et al. Job satisfaction, work stress, and turnover intentions among rural health workers: a cross-sectional study in 11 western provinces of China. BMC Fam Pract (2019). 20, 9
CrossRef

This work is licensed under a Creative Commons Attribution 4.0 International License.


