Exploring Lipid Fraction, Aflatoxin Levels and Shelf Life in Industrial Biscuits
 , Noor N. Haider1, Saher S. George1, Imane Haoujar3, Francesco Cacciola4, Tarek Gamal Abedelmaksoud5 and Angelo Maria Giuffrè6*
 1Food Science Department, College of Agriculture, University of Basrah, Basrah, Iraq.
2College of Medicine, University of Warith Al-Anbiyaa, Karbala, Iraq.
3Laboratory of Biotechnology and Applied Microbiology, Department of Biology, Faculty of Sciences of Tetouan, Abdelmalek Essaadi University, Tetouan, Morocco.
4Department of Biomedical, Dental, Morphological and Functional Imaging Sciences, University of Messina, Messina, Italy.
5Food Science Department, Faculty of Agriculture, Cairo University, Giza. Egypt
6Department AGRARIA, University of Studies “Mediterranea” of Reggio Calabria, Reggio Calabria, Italy.
Corresponding Author E-mail: amgiuffre@unirc.it
DOI : http://dx.doi.org/10.12944/CRNFSJ.11.3.05
Download this article as:
![]()
This study examined the presence of aflatoxins, fatty acid compositions, and storage stability in cookies (BSC), digestive biscuits (BSD), and crackers (BScr) produced in different countries. The findings showed that AFB2 and AFG2 were not found in the studied biscuits, but AFB1 was detected in BSD1-S, BSD1-I, BSC2-U, and BScr1-T, while AFG1 was only found in BSD1-S and BScr1-T. The saturated fatty acid content in BSC, BSD, and BScr samples varied from 20.69% to 45.90%, 10.90% to 47.03%, and 11.35% to 46.88%, respectively. The unsaturated fatty acid content in BSC, BSD, and BScr samples ranged from 11.31% to 59.17%, 12.40% to 74.24%, and from <LOD to 68.79%, respectively. The peroxide value, a deterioration index, ranged between 0.23 and 2.25 mEqO2/kg the day when biscuits were prepared but increased constantly and rapidly with storage and after 90 days it ranged between 9.03 and 11.05 mEqO2/kg. The level of HMF is a freshness index, the lower the value, the higher the freshness; in all the studied biscuits it was between 4.69 (at T0) and 178.33 mg/kg after 90 days. When prepared, only 2 out of the 36 tested biscuits were above the microbial limit of 4 log cfu/g whereas after 90 days, only 7 samples were below this limit. This study provides an overview of aflatoxin content in biscuits and highlights the importance of limiting the intake of saturated and trans fats for health-conscious consumers.
KEYWORDS:Aflatoxins; Biscuit; Fatty acid; Saturated fatty acid; Trans fat
Introduction
Palatability, affordability, long shelf life and easy availability and packing for masses of people make biscuit a popular processed food product around the world. It is possible to incorporate a wide range of nutrients and functionalities into biscuits because they have a variety of ingredients including flour, fat, sugar, water, milk, salt, fruit industry by-product and artificial yeast as raising agents.1-9
The Peroxide value was used by other authors as a deterioration index and prevoius findings evidenced an increase with storage in biscuits prepared with Vigna mungo flour1 and with Lagenaria siceraria flour2. The moisture content facilitates the growth of microorganisms and for this reason its increase is negatively considered but previous findings showed that this parameter increases with storage.6 Recent decades have seen increased public concern about food safety, notably agricultural contamination. Each year, mycotoxins destroy 25–50% of agricultural goods in the world, primarily in underdeveloped tropical nations, according to the FAO.10 Mycotoxins in these items affects public health and the worldwide commerce of commodities. Cereals and cereal-derived products are especially sensitive to fungus and mycotoxin contamination. Wheat, one of the most popular grains, provides more nutrients than any other food item. However, wheat flour is prone to aflatoxins (AFs) contamination. AFs are produced from Aspergillus flavus, A. parasiticus, and A. nominus. They can cause cancer in humans and animals.11 These mycotoxins can enter the human food chain by the ingestion of infected grain or processed foods like meat or other animal products fed contaminated food. Although fungal growth and aflatoxin synthesis can be prevented, mycotoxins in food cannot be controlled.12 AFs consists of B1, B2, G1, G2, M1, and M2, in which AFB1 is the potent hepatocarcinogen.13 AFB1 was classified as Group 1 carcinogen to humans by the International Agency for Research on Cancer (IARC).14 For human health, the European Commission (EC) has set the maximum AFB1 level of 2−8 μg/kg for AFB1 and 15 μg/kg for total AFs in foods.15 The warm-humid climate is good for Aspergillus flavus and aflatoxin formation. Prevalence of AFB1 in the food chain, mainly in bakery products prepared with wheat flour, can cause hepatotoxicity, teratogenicity, immunosuppressive conditions and carcinogenicity.16 Wheat and wheat-derived products are very important in the human diet and consequently there is pressing concern that mycotoxins originated in food raw materials may contaminate terminal bakery products. The increasing consumption of products prepared with wheat has caused an increasing attention towards mycotoxin prevalence and destiny in bakery processing. However, there are few data on AFs occurrence in baked food, including biscuits.
Additionally, the production of commercial biscuits utilizes animal fat and vegetable shortenings made from hydrogenated oils as fat ingredient. For example, vanaspati, a partially hydrogenated vegetable oil, is used for baking and frying in India, which is due to its semi-solid state at room temperature.17 The formation of trans fatty acid (TFA) from cis-unsaturated fatty acids can be due by the partial hydrogenation and thermal treatment of vegetable oils. It has been well known that TFA is associated with cardiovascular disease for its intake. As reported previously, TFA raises low-density lipoprotein cholesterol and decreases high-density lipoprotein cholesterol, which may lead to proinflammatory alterations, endothelial dysfunction, and perhaps insulin resistance as well as displacement of important fatty acids from membranes.18 The 2019 Global Burden of Disease Study showed that more than 600,000 annual deaths worldwide occurred due to high TFA intakes.19-20 USA, Canada, and EU have required voluntary TFA labeling rules.17 Denmark limits TFA to 2% in cooking oils and fats.19 The United States Food and Drug Administration (USFDA) requires a statement related to TFA content in grams per serving right below the content of saturated fat on food labels. Foods containing low TFA (less than 0.5 g) per serving may claim zero trans fats or not a significant source on the label.17 The Food Safety Standards Authority of India (FSSAI) recommends that TFA in partly hydrogenated vegetable oils (vanaspati) cannot exceed 10% of total fatty acid content.21 The World Health Organization (WHO) recommends less than 1% of energy from TFAs in the human diet.22
Therefore, the current study aimed to investigate AF contents and fatty acid composition in some commercial brands of biscuits collected from four countries (Spain, Iran, UAE, and Turkey). Furthermore, the effects of storage periods (at room temperature) of biscuit samples on quality parameters, including moisture content, peroxide value, HMF and microbiological analysis were analyzed for shelf-life evaluation.
Materials and Methods
Sample collection
In Basrah, Iraq, retail shops and supermarkets sold nine biscuit brands: BSC1, BSC2, BSC3, BSD1, BSD2, BSD3, BScr1, BScr2, and BScr3. All these biscuits came from Spain, Iran, UAE, and Turkey. Three types of biscuits were randomly sampled: cookies (BSC), digestive biscuits (BSD), and crackers (BScr). These samples were chosen to represent popular brands consumed by different income ranges and age groups, especially children. It was also affected by biscuit availability during the research.
Extraction and detection of aflatoxines in biscuit samples
AFB1, AFB2, AFG1, and AFG2 were extracted from biscuit samples according to 23 with some modifications. 5 g of dried and grinded biscuits was weighed into a beaker of 250 mL with 20 mL of a solution (water/acetonitrile, 16:18, v/v). Then it was placed on the vibrator (Sheaker) for 90 min for homogenization. The filtration was conducted with a paper Whatman No. 4 filter, before to concentrate to 2-5 mL with a rotary evaporator (50°C). The determination of AFs was performed by using high-performance liquid chromatography (HPLC) (Sykam GmbH, Gilching, Germany) with UV-visible detection. A mixture of acetonitrile:distilled water (70:30) was used as a mobile phase and 0.7 mL/min as flow rate. AFs was separated on a C18 – ODS Hypersil column (250 mm length × 4.6 mm I.D., 5 μm particle size, Maisch, Ammerbuch, Germany), the wavelength was set at 440 nm.
Fatty acid analysis by Gaschromatography-Mass spectrometry (GC-MS)
The esterification of fatty acids was conducted in a test tube in which were introduced and homogenized 0.5 mL of the extracted fat and 2 mL of ethylic alcohol (1 min). At this point were added respectively: 0.5 mL sulfuric acid and the mixture was cooled; n-hexane (2 mL) and deionized water (2 mL), then the mixture was carefully shaken (30 s) to react until different layers were obtained. The so prepared fatty acid methyl esters (FAMEs) were analysed by GC-MS technique.24 An Agilent 7890 GC and an Agilent 5975C inert XC MSD mass spectrometer (Agilent Technologies, Santa Clara, CA, USA) were used. The system was equipped with a HP-5 MS capillary column (30 m length × 0.32 mm internal diameter × 0.25 μm film thickness). FAMEs were analysed by a splitless injection. The initial GC oven temperature was 40°C (5 min), then it was raised to 300°C (10°C/min). The generated mass spectra were matched with the NIST14 Mass Spectral library for the identification of fatty acids.
Determination of moisture
The biscuits were powdered after that they were dried in an oven at 104−105°C until constant weight.25
Determination of peroxide value
The method proposed by Liu et al.26 was applied. Five grams of sample were combined with a 30 mL acetic acid-chloroform solution, in a 20 mL: 10 mL ratio, in a conical flask and spun to dissolve. 0.5 mL potassium iodide (saturated solution) was added and titrated with 0.01 N sodium thiosulfate until the yellow tint was practically gone. Six-seven drops of starch solution (1% in deionized water) were added and the titration continued to release all iodine from the chloroform layer until the blue color disappeared. At the same time a blank analysis was conducted. The peroxide value was expressed as mL equivalent peroxide/kg sample.
Determination of HMF
HMF in biscuits samples was determined based on Švecová and Mojmír.27 In a 100 mL volumetric flask, 3 g of powdered and homogenized material and 50 mL of deionized water were ultrasonicated for 15 minutes to extract HMF. Then, 1 mL of Carrez II (ZnSO4 20%) and 1 mL of Carrez I (K4[Fe(CN)6] 15%) were added and deionized water was added to 100 mL HMF was evaluated using an Agilent Technologies HPLC system with a 285 nm UV/VIS detector. Sample aliquots of 25 μm were manually injected. Use of Agilent Zorbax Reliance Cartridge guard column and Eclipse Plus C18 column (4.6 × 100 mm, 3.5 μm). For isocratic elution, the mobile phase was 90:10 water/acetonitrile. The analytical period was 10 min, and HMF was eluted at 2.7 min.
Microbiological analysis
Total counts of bacteria were determined by using Nutrient agar. Samples were cultured in nutrient agar and incubated at 37°C (48 h), then colonies of total bacteria count were counted as colony forming units (CFU) per mL.28
Statistical analysis
Analyses were conducted in triplicate, and data were presented as means ± standard deviations. The study used SPSS 13 software (SPSS Inc., Chicago, IL, USA) to analyze the results using one-way analysis of variance (ANOVA) and the LSD test to compare treatments where significant (p < 0.05).
Results and Discussion
Aflatoxines in biscuit samples manufactured in Spain, Iran, UAE and Turkey
Figures 1 and 2 depict the HPLC chromatograms for AF standards and biscuit samples made in Spain, Iran, UAE and Turkey.
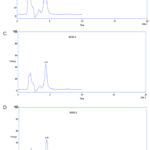 |
Figure 1: HPLC chromatograms of B1 standard (A), BSD1-S sample (B), BSD1-I sample (C), BSC2-U sample (D), and BScr1-T sample (E). |
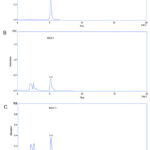 |
Figure 2: HPLC chromatogram of G1 standard (A), BSD1-S sample (B), and BScr1-T sample (C). |
The AFB1, AFB2, AFG1, and AFG2 were analyzed in all tested samples, and the results are summarized in Table 1. This analytical method was applied because It demonstrated to be effective in the analysis, detection and quantification of Aflatoxines.
Table 1: Aflatoxines contents in analyzed biscuits samples. Data represent means ± standard deviation (n=3). ND: not detected.
|
Biscuit samples |
AFs (μg / kg) |
||||
|
AFB1 |
AFB2 |
AFG1 |
AFG2 |
Total |
|
|
BSD1-S |
42.62 ± 1.05 |
ND |
8.99 ± 0.73 |
ND |
51.61 ± 1.24 |
|
BSD2-I |
18.97 ± 0.95 |
ND |
ND |
ND |
18.97 ± 0.95 |
|
BSC2-U |
11.30 ± 1.26 |
ND |
ND |
ND |
11.30 ± 1.26 |
|
BScr1-T |
56.24 ± 2.09 |
ND |
12.07 ± 1.34 |
ND |
68.31 ± 1.49 |
From Figures 1 and 2, only BSD1-S, BSD1-I, BSC2-U, and BScr1-T contained detectable AFs, in which AFB2 and AFG2 were not found in all tested biscuits samples regardless of manufacturing country. However, AFB1 was found in only four of 36 tested samples, that is, BSD1-S, BSD1-I, BSC2-U, and BScr1-T. Furthermore, AFB1 contents in BScr1-T (56.24 μg/kg) and BSD1-S (42.62 μg/kg) were significantly higher than that in BSD2-I (18.97 μg/kg) and BSC2-U (11.30 μg/kg). Additionally, it was also observed that AFG1 was only detected in BSD1-S (8.99 μg/kg) and BScr1-T (12.07 μg/kg). This finding was in agreement with Zain29 who mentioned that the presence of AFs might be due to the secondary metabolism of some filamentous fungi under some suitable conditions such as temperature and humidity. The Codex Alimentarius Commission was considering a recommendation to establish a maximum limit of 15 ppb for total AFs in foods worldwide.30 Therefore, to ensure the dietary health of consumers, it is worth paying attention to improving the manufacturing technique of some biscuit samples, such as BScr1-T, BSD1-S, and BSD2-I. Gholamour Azizi and Rohui31 in a study in North Iran, found less than 4 ppb in the 86.7% and more than 4 ppb in the 13.3% of the studied biscuits and cookies showing the large part of these bakery products within the International qualitative limits in Aflatoxines.
Fatty acid composition in biscuit samples manufactured in Spain, Iran, UAE and Turkey
The GC-MS analysis was conducted to have very detailed results. In all tested biscuit samples, palmitic (C16:0) and oleic (C18:1) acids were found to most represented in many biscuit samples (Table 2).
Table 2: Major fatty acids in tested biscuits manufactured in Spain, Iran, UAE and Turkey. Data represent means ± standard deviation (n=3). ND: not detected. NA: not applicable.
|
Biscuit samples |
Fatty acids (% of total FAs) |
||||||
|
C16:0 |
C18:0 |
C18:1 |
C18:2 (PUFA) |
SFA |
PUFA/SFA |
TFA |
|
|
BSC1-S |
19.03 ± 0.58 |
2.74 ± 0.06 |
ND |
11.31 ± 0.53 |
21.78 ± 0.39 |
0.52 |
21.43 ± 0.08 |
|
BSC2-S |
19.20 ± 0.32 |
ND |
55.22 ± 0.45 |
ND |
20.89 ± 0.47 |
NA |
ND |
|
BSC3-S |
14.23 ± 0.18 |
0.64 ± 0.05 |
59.17 ± 0.19 |
ND |
20.69 ± 0.11 |
NA |
ND |
|
BSC1-I |
29.71 ± 0.26 |
2.59 ± 0.08 |
ND |
9.56 ± 0.08 |
36.92 ± 0.37 |
0.26 |
ND |
|
BSC2-I |
31.11 ± 0.13 |
ND |
47.14 ± 0.26 |
ND |
32.37 ± 0.21 |
NA |
11.95 ± 0.06 |
|
BSC3-I |
29.59 ± 0.08 |
0.61 ± 0.17 |
ND |
6.27 ± 0.07 |
37.66 ± 0.34 |
0.17 |
ND |
|
BSC1-U |
35.88 ± 0.13 |
0.55 ± 0.05 |
45.31 ± 0.37 |
ND |
36.42 ± 0.18 |
NA |
6.47 ± 0.02 |
|
BSC2– U |
17.75 ± 0.14 |
4.02 ± 0.09 |
ND |
2.33 ± 0.01 |
21.77 ± 0.37 |
0.11 |
1.49 ± 0.01 |
|
BSC3-U |
38.14 ± 0.51 |
0.63 ± 0.04 |
27.99 ± 0.22 |
7.34 ± 0.03 |
40.26 ± 0.42 |
0.18 |
ND |
|
BSC1-T |
31.84 ± 0.83 |
1.23 ± 0.03 |
ND |
15.39 ± 0.09 |
34.45 ± 0.91 |
0.45 |
11.94 ± 0.07 |
|
BSC2-T |
41.49 ± 0.72 |
0.56 ± 0.01 |
ND |
34.78 ± 0.53 |
45.90 ± 0.80 |
0.76 |
5.89 ± 0.04 |
|
BSC3-T |
37.60 ± 0.28 |
0.51 ± 0.02 |
28.44 ± 0.18 |
12.49 ± 0.12 |
39.58 ± 0.31 |
0.32 |
ND |
|
Mean |
28.80 |
1.17 |
21.94 |
8.29 |
32.39 |
|
4.93 |
|
BSD1-S |
10.80 ± 0.07 |
ND |
66.32 ± 1.08 |
ND |
19.13 ± 0.13 |
NA |
ND |
|
BSD2-S |
10.53 ± 0.37 |
ND |
68.79 ± 0.73 |
ND |
11.35 ± 0.18 |
NA |
4.53 ± 0.09 |
|
BSD3-S |
13.27 ± 0.09 |
0.85 ± 0.09 |
47.51 ± 0.86 |
9.49 ± 0.41 |
22.52 ± 0.13 |
0.42 |
ND |
|
BSD1-I |
28.20 ± 0.21 |
11.46 ± 0.12 |
ND |
20.09 ± 0.05 |
41.78 ± 0.29 |
0.48 |
ND |
|
BSD2-I |
29.28 ± 0.19 |
0.62 ± 0.08 |
ND |
40.98 ± 0.24 |
30.33 ± 0.31 |
1.35 |
ND |
|
BSD3-I |
37.45 ± 0.28 |
0.66 ± 0.02 |
ND |
ND |
41.19 ± 0.40 |
NA |
4.67 ± 0.04 |
|
BSD1-U |
40.98 ± 0.26 |
0.73 ± 0.04 |
ND |
8.90 ± 0.05 |
45.50 ± 0.28 |
0.20 |
ND |
|
BSD2-U |
38.08 ± 0.18 |
0.56 ± 0.03 |
46.26 ± 0.61 |
ND |
39.41 ± 0.39 |
NA |
ND |
|
BSD3-U |
37.19 ± 0.17 |
0.93 ± 0.03 |
7.43 ± 0.08 |
11.14 ± 0.04 |
39.29 ± 0. 21 |
0.28 |
ND |
|
BSD1-T |
11.59 ± 0.11 |
ND |
ND |
67.34 ± 0.59 |
14.07 ± 0.27 |
4.76 |
3.73 ± 0.01 |
|
BSD2-T |
38.90 ± 0.24 |
0.51 ± 0.04 |
26.33 ± 0.20 |
11.36 ± 0.29 |
46.87 ± 0.34 |
0.24 |
ND |
|
BSD3-T |
32.27 ± 0.19 |
ND |
ND |
48.71 ± 0.34 |
38.37 ± 0.35 |
1.27 |
3.23 ± 0.01 |
|
Mean |
27.38 |
1.36 |
21.89 |
18.17 |
32.48 |
|
1.35 |
|
BScr1-S |
10.98 ± 0.18 |
9.24 ± 0.14 |
7.59 ± 0.04 |
63.31 ± 0.51 |
26.49 ± 0.22 |
2.38 |
ND |
|
BScr2-S |
8.72 ± 0.11 |
ND |
5.62 ± 0.03 |
68.62 ± 0.97 |
15.99 ± 0.24 |
4.35 |
6.01 ± 0.08 |
|
BScr3-S |
ND |
0.77 ± 0.07 |
36.71 ± 0.16 |
20.91 ± 0.11 |
10.90 ± 0.16 |
1.92 |
11.21 ± 0.04 |
|
BScr1-I |
44.53 ± 0.79 |
0.56 ± 0.04 |
9.57 ± 0.09 |
8.24 ± 0.09 |
47.03 ± 0.81 |
0.18 |
ND |
|
BScr2-I |
23.47 ± 0.26 |
ND |
ND |
25.22 ± 0.11 |
24.71 ± 0.32 |
1.02 |
25.35 ± 0.09 |
|
BScr3-I |
34.44 ± 0.37 |
ND |
6.60 ± 0.07 |
44.00 ± 0.26 |
35.98 ± 0.29 |
1.22 |
3.60 ± 0.01 |
|
BScr1-U |
42.34 ± 0.60 |
ND |
3.34 ± 0.01 |
9.06 ± 0.06 |
44.33 ± 0.79 |
0.20 |
ND |
|
BScr2-U |
36.80 ± 0.42 |
0.82 ± 0.02 |
6.41 ± 0.03 |
9.97 ± 0.02 |
37.99 ± 0.51 |
0.26 |
ND |
|
BScr3-U |
43.79 ± 0.49 |
0.48 ± 0.01 |
3.88 ± 0.03 |
10.95 ± 0.06 |
45.71 ± 0.37 |
0.24 |
ND |
|
BScr1-T |
38.27 ± 0.23 |
ND |
ND |
49.18 ± 0.51 |
42.31 ± 0.31 |
1.16 |
0.65 ± 0.01 |
|
BScr2-T |
37.24 ± 0.43 |
ND |
ND |
42.79 ± 0.86 |
39.33 ± 0.62 |
1.09 |
0.95 ± 0.04 |
|
BScr3-T |
35.94 ± 0.78 |
ND |
26.99 ± 0.14 |
16.14 ± 0.18 |
38.30 ± 0.88 |
0.42 |
3.41 ± 0.02 |
|
Mean |
29.71 |
0.99 |
8.89 |
30.70 |
34.09 |
|
4.27 |
For different brands of biscuit samples (BSC, BSD, or BScr) manufactured in the same country, fatty acid profiles exhibited many differences in SFA, MUFA, PUFA, and TFA. For example, C16:0 content in BSC3-S (14.23%) was significantly lower than that in BSC1-S (19.03%) and BSC2-S (19.20%), while stearic acid (C18:0) content in BSC3-S (0.64%) was higher than that in BSC2-S which was actually not detected. Additionally, BSC2-S and BSC3-S contained high amounts of C18:1 (55.22% and 59.17%, respectively), which was not detected in BSC1-S. However, linoleic acid (C18:2) and TFA was only found in BSC1-S (11.31% and 21.43%, respectively). For the same type of biscuit samples manufactured in different countries, fatty acid profiles also exhibited some differences. C16:0 contents in BSC (14.23%-19.20%), BSD (10.53%-13.27%), and BScr (ND-10.98%) samples manufactured in Spain were significantly lower than that in the corresponding biscuit samples manufactured in Iran, UAE, and Turkey (p < 0.05). Conversely, C18:1 contents in biscuit samples manufactured in Spain, especially BSD-S (47.51%-68.79%), were much higher than that in samples manufactured in other countries. Even in BSD-I samples, C18:1 was not detected at all. C18:2, as unique detected PUFA and essential FA, was also found as high-amount FA in some biscuit samples, such as BScr2-S (68.62%), BSD1-T (67.34%), BScr1-S (63.31%). In addition, although C18:0 was detected widely in tested biscuit samples, the levels were generally lower than the levels of C16:0, C18:1, and C18:2. Furthermore, C18:0 was not detected in some biscuit samples, such as all BScr samples manufactured in Turkey. As reported previously, in New Zealand, C16:0 contents in biscuits were similar to our findings, ranging between 16.1% and 38.3%, whereas C18:0 was much lower and amounted to ND–0.3%.32 Caponio et al.33 confirmed that high amounts of C16:0 indicated the utilization of palm oil in the production of biscuit samples. For different types of biscuit sample regardless of manufacturing country, there was little difference for C16:0 and C18:0 contents among BSC, BSD, and BScr samples. However, C18:1 contents in BSC and BSD (21.94% and 21.89%, respectively) were much higher than that in BScr (8.89%). Conversely, BScr had the highest C18:2 level (30.70%), followed by BSD (18.17%) and BSC (8.29%).
Table 3 also showed the contents of some other FAs in biscuit samples. It was well observed that the biscuits samples also contained short-chain FAs ranging between C8:0 and C10:0, which can be explained with the possible use of milk fat in the recipe. Caprylic acid (C8:0) was found only in BScr3-S (0.52%), which was within the limit of Turkish biscuits prepared for children (0.2%-0.8%). Small amounts of capric acid (C10:0) was detected in BSC2-S and BScr3-S (0.66% and 0.46%, respectively) than that in Spanish biscuits (2.3%).34
Table 3: Minor fatty acids in in all tested biscuits manufactured in Spain, Iran, UAE and Turkey. Data represent means ± standard deviation (n=3). ND: not detected.
|
Biscuit samples |
Fatty acid (% of total FAs) |
|||||
|
C8:0 |
C10:0 |
C12:0 |
C14:0 |
C20:0 |
C22:0 |
|
|
BSC1-S |
ND |
ND |
ND |
ND |
ND |
ND |
|
BSC2-S |
ND |
0.66 ± 0.07 |
1.02 ± 0.04 |
ND |
ND |
ND |
|
BSC3-S |
ND |
ND |
ND |
ND |
ND |
0.72 ± |
|
BSC1-I |
ND |
ND |
ND |
ND |
ND |
ND |
|
BSC2-I |
ND |
ND |
ND |
ND |
ND |
ND |
|
BSC3-I |
ND |
ND |
ND |
ND |
ND |
ND |
|
BSC1-U |
ND |
ND |
ND |
ND |
ND |
ND |
|
BSC2– U |
ND |
ND |
ND |
ND |
ND |
ND |
|
BSC3-U |
ND |
ND |
1.48 ± 0.02 |
ND |
ND |
ND |
|
BSC1-T |
ND |
ND |
1.38 ± 0.03 |
ND |
ND |
ND |
|
BSC2-T |
ND |
ND |
2.50 ± 0.03 |
ND |
ND |
ND |
|
BSC3-T |
ND |
ND |
0.54 ± 0.02 |
0.93 ± 0.01 |
ND |
ND |
|
Mean |
ND |
0.05 |
0.57 |
0.07 |
ND |
0.06 |
|
BSD1-S |
ND |
ND |
ND |
ND |
ND |
1.44 ± 0.03 |
|
BSD2-S |
ND |
ND |
ND |
ND |
ND |
0 |
|
BSD3-S |
ND |
ND |
ND |
ND |
ND |
0.87 ± 0.01 |
|
BSD1-I |
ND |
ND |
0.45 |
ND |
ND |
0 |
|
BSD2-I |
ND |
ND |
ND |
ND |
ND |
0.43 ± 0.02 |
|
BSD3-I |
ND |
ND |
ND |
ND |
ND |
ND |
|
BSD1-U |
ND |
ND |
ND |
ND |
ND |
ND |
|
BSD2-U |
ND |
ND |
ND |
ND |
0.76 |
ND |
|
BSD3-U |
ND |
ND |
ND |
ND |
1.16 |
ND |
|
BSD1-T |
ND |
ND |
ND |
ND |
ND |
1.78 ± 0.01 |
|
BSD2-T |
ND |
ND |
2.69 ± 0.08 |
1.54 ± 0.02 |
ND |
ND |
|
BSD3-T |
ND |
ND |
ND |
0.93 |
ND |
ND |
|
Mean |
ND |
ND |
0.26 |
0.20 |
0.16 |
0.37 |
|
BScr1-S |
ND |
ND |
ND |
ND |
ND |
1.37 |
|
BScr2-S |
ND |
ND |
ND |
ND |
ND |
1.54 |
|
BScr3-S |
0.52 ± 0.02 |
0.46 ± 0.06 |
ND |
0.66 ± 0.04 |
ND |
0.85 ± 0.03 |
|
BScr1-I |
ND |
ND |
ND |
ND |
ND |
ND |
|
BScr2-I |
ND |
ND |
ND |
ND |
ND |
ND |
|
BScr3-I |
ND |
ND |
ND |
ND |
ND |
1.01 |
|
BScr1-U |
ND |
ND |
ND |
0.69 |
ND |
ND |
|
BScr2-U |
ND |
ND |
0.36 |
ND |
ND |
ND |
|
BScr3-U |
ND |
ND |
ND |
ND |
ND |
ND |
|
BScr1-T |
ND |
ND |
0.84 |
ND |
ND |
ND |
|
BScr2-T |
ND |
ND |
ND |
ND |
ND |
0.50 ± |
|
BScr3-T |
ND |
ND |
ND |
1.04 |
ND |
0.62 ± |
|
Mean |
0.04 |
0.03 |
0.1 |
0.19 |
ND |
0.49 |
The lauric acid (C12:0) content (0.36%-2.69%) was revealed in a small portion of biscuit samples in lower quantity if compared to Spanish biscuits (11.8%).34 Myristic acid (C14:0) content (0.07%-1.54%) in some biscuit samples was comparable with New Zealand (0.1%-1.0%), Brazilian (0.10%-1.47%), and Turkish biscuits (0.6%-1.0%).35 Arachidic acid (C20:0) were found only in BSD2-U (0.38%) and BSD3-U (0.37%), which was in agreement with that in Poland biscuits (0.35%-0.75%).36 The contents of Behenic acid (C22:0) ranged from 0.43% to 1.54% in some analysed biscuits. This datum agrees with Chandana and Navaratne36 who found the content of C22:0 was 0.77% in soft dough biscuits. It was also observed that only BSC3-S contained C22:0 in BSC samples regardless of manufacturing country.
Figure 3 also shows the contents of FA groups including SFA, MUFA, PUFA, and TFA in biscuit samples from Spanish, Iran, UAE, and Turkey. From Figure 1 combining with Table 2, SFA contents in different brand of BSC, BSD, or BScr samples manufactured in the same region had more or less difference. For example, no significant difference in SFA contents among BSC1-S (21.78%), BSC2-S (20.89%), and BSC3-S (20.69%) was observed, but SFA content in BSC3-U (40.26%) was much higher than that in BSC2-U (21.77%).
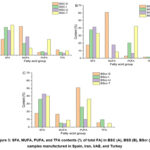 |
Figure 3: SFA, MUFA, PUFA, and TFA contents (% of total FA) in BSC (A), BSD (B), BScr (C) samples manufactured in Spain, Iran, UAE, and Turkey |
The results of SFA contents in this work were lower compared to that in BSC samples from Italian, Greek, and French (47.0%-56.5%)35, but very closed to that in BScr samples from Turkish and Brazilian (33.8%-47.9% and 16.9%-39.2%, respectively).35,38 Interestingly, SFA content in Spain biscuit samples (10.90%-26.49%) was remarkably lower than that in biscuit samples manufactured in Iran (24.71%-47.03%), UAE (21.77%-45.71%), and Turkey (14.07%-46.87%). The highest MUFA content was detected in different type of Spain biscuit samples. Especially, it was up to 60.87% on average in BSD-S, but not detected in BSD-I. Regardless of manufacturing country, MUFA contents in BScr samples were generally lower than that in BSC and BSD samples, while it was opposite for PUFA contents. There were both the highest PUFA contents in BSC and BSD samples from Turkey compared to the corresponding biscuit samples from other countries. Differently, for BScr samples, BScr-S contained the highest PUFA content (50.95%).
It has been well known that high SFA intakes are associated with increased cardiovascular disease (CVD) and type-2 diabetes (T2D) risk. WHO guidelines and dietary recommendations suggest both a reduction of SFA intakes and replacement of SFA with PUFA, this is based on a strong evidence.39 Thus, The PUFA/SFA index is commonly applied to evidence the risk of cardiovascular health related to a food. WHO recommended a ratio higher than 0.4 for PUFA/SFA.40 From Table I, for BSC samples, only BSC1-S (0.52), BSC1-T (0.45), and BSC2-T (0.76) had a good PUFA/SFA ratio with higher than 0.4. For BSD samples, PUFA/SFA ratios of BSD2-I (1.35), BSD1-T (4.76), and BSD3-T (1.27) even exceeded 1.0. For BScr samples, except BScr1-I, BScr1-U, BScr2-U, and BScr3-U, PUFA/SFA ratios of all other biscuit samples (0.42-4.35) were higher than 0.4. The findings indicated that BScr was a relatively healthier diet compared to BSC and BSD.
Table 2 observed that TFA was detected in some biscuit samples, in which particularly BScr2-I and BSC1-S contained greatly high amounts of TFA contents (25.35% and 21.43%, respectively). In general, TFA contents in BSC (4.93%) and BScr (4.27%) samples were higher than that in BSD sample (1.35%). Additionally, no TFA was detected in BSD and BScr samples from UAE. These results indicated that hydrogenated oil was used in the production of some biscuit samples.41 The amount of TFA varied considerably among the analyzed samples, possibly because base oil hydrogenation conditions differed. Well-known hydrogenation process parameters like quantity, pressure, catalyst type and temperature affect TFA content. This investigation found lower total TFA values for biscuit samples than Pakistani (26.7%)42, Brazilian (20.1%)35, and Turkish (16.4%)38, but much higher than Italian biscuits (1.7%).34
Effect of storage periods on moisture content in biscuit samples manufactured in Spain, Iran, UAE and Turkey.
Moisture content facilitates the growth of microorganisms, for this reason it is negatively considered when a biscuit is evaluated. Figure 4 exhibits the effects of storage periods on the moisture content of Spanish, Iranian, Emirati and Turkish biscuit samples stored at room temperature for 90 days.
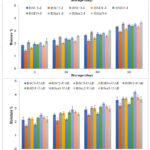 |
Figure 4: Effect of storage periods on moisture content of Spanish, Iranian, UAE, and Turkish biscuit samples stored for 90 days at room temperature. |
The moisture contents of the Spanish biscuit samples were 3.43%, 3.56%, 3.52%, 3.67%, 3.41%, 3.55%, 3.52%, 3.55%, and 3.60% for BSC1-S, BSC2-S, BSC3-S, BSD1-S, BSD2-S, BSD3-S, BScr1-S, BScr2-S, and BScr3-S respectively for 90 days at room temperature. While the moisture contents in the Iranian biscuit samples were 3.31%, 2.92%, 3.57%, 3.12%, 3.46%, 3.38%, 3.51%, 3.30%, and 3.66% for BSC1-I, BSC2-I, BSC3-I, BSD1-I, BSD2-I, BSD3-I, BScr1-I, BScr2-I, and BScr3-I, respectively for 90 days at room temperature. For the UAE biscuit samples, the moisture contents were 3.61%, 3.19%, 3.73%, 3.71%, 3.29%, 3 78%, 4.20%, 3.81%, 3.66% for each of BSC1-U, BSC2-U, BSC3-U, BSD1-U, BSD2-U, BSD3-U, BScr1-U, BScr2-U, and BScr3-U, respectively when stored for 90 days at room temperature. The moisture content in the Turkish biscuit samples 2.96%, 3.41%, 3.68%, 3.88%, 3.75%, 3.68%, 3.20%, 3.31%, 3.43% for each of BSC1-T, BSC2-T, BSC3-T, BSD1-T, BSD2-T, BSD3-T, BScr1-T, BScr2-T, and BScr3-T, respectively, when stored for 90 days at room temperature.
The results of the statistical analysis showed that there was a significant effect (p < 0.05) for each country of manufacture, types of biscuits and storage, and the interaction between the country of manufacture and the types of biscuits. The results of the statistical analysis showed that there were no significant differences for the interaction between the types of biscuits and storage and the triple interference between the country of manufacture and the types of biscuits and storage. The results showed a gradual increase in the moisture content during the storage period in all the baked biscuit samples. This increase in the amount of moisture came as a result of absorbing all kinds of biscuits to the moisture from the environment surrounding the storage conditions. These results are consistent with Mahloko et al.43 and McMinn et al.44, who confirmed that the moisture content was within the recommended limits (0-10%) for stored biscuits. Similarly, Kumar et al, in biscuits prepared with multigrain flours confirmed the moisture increase at ambient temperature.45
Effect of storage periods on the peroxide value of biscuit samples manufactured in Spain, Iran, UAE and Turkey.
Peroxide value indicates the oxidative state of biscuits. A high peroxide value is the origin of unpleasant odors. A low peroxide value can be an index of a high storability. The results in Table 4 show the effect of storage periods on the value of peroxide in samples of Spanish, Iranian, UAE, and Turkish biscuits stored at room temperature for 90 days.
Table 4: Effect of storage periods on the peroxide value of biscuit samples stored at room temperature for 90 days. Values express as mean ± standard deviation of triplicate (n = 3).
|
Biscuit sample |
Storage (days) |
|||
|
0 |
30 |
60 |
90 |
|
|
BSC1-S |
1.66 ± 0.05 |
3.06 ± 0.11 |
6.26 ± 0.37 |
10.46 ± 0.39 |
|
BSC2-S |
1.75 ± 0.04 |
3.15 ± 0.19 |
6.35 ± 0.30 |
10.55 ± 0.10 |
|
BSC3-S |
2.25 ± 0.07 |
3.65 ± 0.10 |
6.85 ± 0.33 |
11.05 ± 1.20 |
|
BSD1-S |
1.00 ± 0.15 |
2.40 ± 0.11 |
5.60 ± 0.28 |
9.80 ± 0.58 |
|
BSD2-S |
1.61 ± 0.10 |
3.01 ± 0.10 |
6.21 ± 0.30 |
10.41 ± 0.41 |
|
BSD3-S |
0.69 ± 0.04 |
2.09 ± 0.10 |
5.29 ± 0.30 |
9.49 ± 0.03 |
|
BScr1-S |
0.92 ± 0.04 |
2.32 ± 0.07 |
5.52 ± 0.28 |
9.72 ± 0.36 |
|
BScr2-S |
1.50 ± 0.06 |
2.90 ± 0.11 |
6.10 ± 0.22 |
10.30 ± 0.21 |
|
BScr3-S |
0.54 ± 0.03 |
1.94 ± 0.10 |
5.14 ± 0.21 |
9.34 ± 0.25 |
|
BSC1-I |
1.41 ± 0.05 |
2.81 ± 0.10 |
6.01 ± 0.24 |
10.21 ± 0.11 |
|
BSC2-I |
1.81 ± 0.07 |
3.21 ± 0.19 |
6.41 ± 0.27 |
10.61 ± 0.10 |
|
BSC3-I |
0.55 ± 0.08 |
1.95 ± 0.09 |
5.15 ± 0.20 |
9.35 ± 0.20 |
|
BSD1-I |
0.79 ± 0.10 |
2.19 ± 0.08 |
5.39 ± 0.24 |
9.59 ± 0.38 |
|
BSD2-I |
0.83 ± 0.06 |
2.23±0.09 |
5.43 ± 0.32 |
9.63 ± 0.18 |
|
BSD3-I |
0.57 ± 0.03 |
1.97±0.09 |
5.17 ± 0.28 |
9.37 ± 1.15 |
|
BScr1-I |
0.25 ± 0.07 |
1.65 ± 0.04 |
4.85 ± 0.21 |
9.05 ± 0.10 |
|
BScr2-I |
0.55 ± 0.05 |
1.95 ± 0.07 |
5.15 ± 0.28 |
9.35 ± 0.36 |
|
BScr3-I |
0.54 ± 0.08 |
1.94 ± 0.07 |
5.14 ± 0.14 |
9.34 ± 0.26 |
|
BSC1-U |
2.05 ± 0.07 |
3.45 ± 0.11 |
6.65 ± 0.26 |
10.85 ± 0.25 |
|
BSC2– U |
0.77 ± 0.07 |
2.17 ± 0.10 |
5.37 ± 0.29 |
9.57 ± 0.24 |
|
BSC3-U |
1.11 ± 0.09 |
2.51 ± 0.09 |
5.71 ± 0.29 |
9.91 ± 0.10 |
|
BSD1-U |
0.94 ± 0.09 |
2.34 ± 0.10 |
5.54 ± 0.24 |
9.74 ± 0.06 |
|
BSD2-U |
1.35 ± 0.07 |
2.75 ± 0.09 |
5.95 ± 0.24 |
10.15 ± 0.11 |
|
BSD3-U |
1.21 ± 0.06 |
2.61 ± 0.087 |
5.81 ± 0.30 |
10.01 ± 0.18 |
|
BScr1-U |
0.90 ± 0.05 |
2.30 ± 0.07 |
5.50 ± 0.31 |
9.70 ± 0.25 |
|
BScr2-U |
1.04 ± 0.05 |
2.44 ± 0.05 |
5.64 ± 0.21 |
9.84 ± 0.09 |
|
BScr3-U |
1.30 ± 0.09 |
2.70 ± 0.04 |
5.90 ± 0.30 |
10.10 ± 0.17 |
|
BSC1-T |
0.45 ± 0.08 |
1.85 ± 0.04 |
5.05 ± 0.19 |
9.25 ± 0.08 |
|
BSC2-T |
1.91 ± 0.09 |
3.31 ± 0.14 |
6.51 ± 0.39 |
10.71 ± 0.15 |
|
BSC3-T |
2.15 ± 0.10 |
3.55 ± 0.11 |
6.75 ± 0.23 |
10.95 ± 1.05 |
|
BSD1-T |
0.80 ± 0.05 |
2.20 ± 0.10 |
5.40 ± 0.21 |
9.60 ± 1.10 |
|
BSD2-T |
0.57 ± 0.09 |
1.97 ± 0.09 |
5.17 ± 0.33 |
9.37 ± 0.19 |
|
BSD3-T |
0.78 ± 0.06 |
2.18 ± 0.09 |
5.38 ± 0.18 |
9.58 ± 0.14 |
|
BScr1-T |
0.46 ± 0.05 |
1.86 ± 0.08 |
5.06 ± 0.25 |
9.26 ± 0.05 |
|
BScr2-T |
0.31 ± 0.03 |
1.71 ± 0.08 |
4.91 ± 0.28 |
9.11 ± 0.05 |
|
BScr3-T |
0.23 ± 0.06 |
1.63 ± 0.06 |
4.83 ± 0.27 |
9.03 ± 0.11 |
No significant differences for the interaction between the types of biscuits and storage and the triple interference between the country of manufacture and the types of biscuits and storage. The values of peroxide in the Spanish biscuit samples were 10.46, 10.55, 11.05, 9.8, 10.41, 9.48, 9.72, 10.30, 9.34 mEq/kg for each of BSC1-S, BSC2-S, BSC3-S, BSD1-S, and BSD2-S, BSD3-S, BScr1-S, BScr2-S, and S-BScr3, respectively. While the values of peroxide in the Iranian biscuit samples were 10.21, 10.61, 9.35, 9.59, 9.63, 9.37, 9.05, 9.35, 9.34 mEq/kg for BSC1-I, BSC2-I, BSC3-I, BSD1-I, BSD2-I, BSD3-I, BScr1-I, BScr2-I, and BScr3-I, respectively, stored for 90 days at room temperature. For the UAE biscuit samples, the peroxide values were 10.85, 9.57, 9.91, 9.74, 10.51, 10.01, 9.70, 9.84, 10.10 mEq/kg for each of BSC1-U, BSC2-U, BSC3-U, BSD1-U, BSD2-U, BSD3-U, BScr1-U, BScr2-U and BScr3-U, respectively. The values of peroxide in the Turkish biscuit samples ranged from 9.25, 10.71, 10.95, 9.60, 9.37, 9.58, 9.26, 9.11, 9.03 mEq/kg for each of BSC1-T, BSC2-T, BSC3-T, BSD1-T, BSD2-T, BSD3-T, BSCr1-T, BScr2-T, and BScr3-T, respectively.
The results showed a gradual increase in the PV value during storage in all samples of baked biscuits. The results also showed that 13 of the total 36 types of biscuits that were examined were higher than 10 mEq/kg, i.e. the permissible limit specified by the World Food Program (FAO, 2021).10 While these results were consistent with the previous report by Odeh and Yamani46 who mentioned that the peroxide values were acceptable even if they increased to 10 mEq/kg when they studied the chemical quality of Arabic sweets produced in Jordan. Chugh et al47 studied the peroxide value in low fat biscuits and found values lower than 6.5 mEq O2/kg of fat after 90 days of storage, these low values can be related to the low fat content of biscuits and the low attitude to oxidize. Kumari et al48 studied the shelf life of biscuits and cookies incorporating germinated pumpkin seed flour and found a peroxide value ranging between 2.81 (after 15 days storage) and 6.33 mEq O2/kg of fat after 75 days, confirming the deterioration of biscuits during storage.
Effect of storage periods on the HMF content in biscuit samples manufactured in Spain, Iran, UAE and Turkey.
HMF is an index of freshness. The lower the HMF the higher the freshness. Figure 5 showed the effect of storage periods on the HMF content in samples from Spanish, Iranian, UAE and Turkish biscuits stored at room temperature for 90 days.
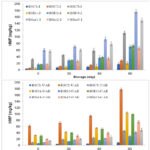 |
Figure 5: Effects of storage periods on HMF contents (mg/kg) in biscuit samples stored at room temperature. |
A significant effect (p < 0.05) was found for each country of manufacture, types of biscuits and storage, the interaction between the country of manufacture and the types of biscuits, the interaction between the quality of biscuits and storage, and the triple interaction between the country of manufacture and the types of biscuits and storage. The amount of HMF in Spanish biscuit samples were 6.17, 16.30, 7.16, 25.19, 7.41, 38.28, 4.69, 31.86, 49.89 mg/kg for each of BSC1-S, BSC2-S, BSC3-S, BSD1-S, BSD2-S, BSD3-S, BScr1-S, BScr2-S, and BScr3-S respectively when stored at room temperature for 90 days. While the amount of HMF in Iranian biscuit samples were 17.78, 28.65, 111.89, 20.50, 70.88, 73.85, 176.35, 65.70, 149.92 mg/kg for BSC1-I, BSC2-I, BSC3-I, BSD1-I, BSD2-I, BSD3-I, BScr1-I, BScr2-I, and BScr3-I, respectively. For the UAE biscuit samples, the amount of HMF were 8.39, 178.33, 45.44, 104.48, 29.14, 99.29, 41, 74.84 and 49.40 mg/kg for each of BSC1-U, BSC2-U, BSC3-U, BSD1-U, BSD2-U, BSD3-U, BScr1-U, BScr2-U, and BScr3-U, respectively, when stored at room temperature for 90 days. The amounts of HMF in the Turkish biscuit samples were 74.1, 7.9, 10.37, 18.03, 26.92, 9.38, 46.68, 47.67, 143.53 mg/kg for each of BSC1-T, BSC2-T, BSC3-T, BSD1-T, BSD2-T, BSD3-T, BScr1-T, BScr2-T, and BScr3-T, respectively.
The obtained research results agreed with Mankowska et al.49 and Jalili and Ansari50 who showed that storage is one of the influencing factors that cause a significant increase in the amount of HMF. Michalak et al.51 also showed that these differences observed in the increase in the amount of HMF in the analyzed samples are due to differences in the components of the products.
Effect of storage periods on the microbial content of biscuit samples manufactured in Spain, Iran, UAE and Turkey.
The microbial content is an index of quality of a food in relation to both its manufacturing and storage. Table 5 shows the effects of storage periods on the total count bacteria in samples of Spanish, Iranian, UAE and Turkish biscuits stored for 90 days at room temperature.
Table 5: Effect of grief periods on the total bacteria count (CFU/mL) for biscuit samples stored at room temperature for 90 days. Values express as mean ± standard deviation (n = 3).
|
Biscuit brand |
Storage time (days) |
|||
|
0 |
30 |
60 |
90 |
|
|
BSC1-S |
2.62 ± 0.19 |
2.81 ± 0.17 |
3.20 ± 0.17 |
4.00 ± 0.14 |
|
BSC2-S |
2.80 ± 0.17 |
2.99 ± 0.16 |
3.39 ± 0.18 |
4.20 ± 0.16 |
|
BSC3-S |
2.65 ± 0.16 |
2.86 ± 0.16 |
3.27 ± 0.17 |
3.99 ± 0.18 2 |
|
BSD1-S |
2.59 ± 0.16 |
2.80 ± 0.16 |
3.39 ± 0.18 |
3.95 ± 0.14 |
|
BSD2-S |
2.87 ± 0.15 |
3.06 ±0.16 |
3.47 ± 0.18 |
4.27 ± 0.19 |
|
BSD3-S |
2.69 ± 0.16 |
2.88 ± 0.16 |
3.28 ± 0.17 |
4.08 ± 0.19 |
|
BScr1-S |
2.68 ± 0.14 |
2.89 ± 0.14 |
3.30 ± 0.16 |
4.10 ± 0.19 |
|
BScr2-S |
2.66 ± 0.19 |
2.88 ± 0.18 |
3.31 ± 0.16 |
4.12 ± 0.18 |
|
BScr3-S |
2.75 ± 0.13 |
2.96 ± 0.14 |
3.37 ± 0.15 |
4.15 ± 0.20 |
|
BSC1-I |
2.61 ± 0.14 |
2.79 ± 0.14 |
3.18 ± 0.19 |
3.98 ± 0.05 |
|
BSC2-I |
2.50 ± 0.19 |
2.71 ± 0.18 |
3.12 ± 0.17 |
3.92 ± 0.15 |
|
BSC3-I |
2.61 ± 0.13 |
2.82 ± 0.19 |
3.22 ± 0.14 |
4.02 ± 0.32 |
|
BSD1-I |
2.57 ± 0.19 |
2.75 ± 0.12 |
3.15±0.15 |
3.95 ± 0.16 |
|
BSD2-I |
2.63 ± 0.18 |
2.82 ± 0.17 |
3.22 ± 0.14 |
4.02 ± 0.75 |
|
BSD3-I |
2.62 ± 0.13 |
2.82 ± 0.16 |
3.22 ± 0.16 |
4.02 ± 0.41 |
|
BScr1-I |
2.57 ± 0.14 |
2.75 ± 0.13 |
3.16 ± 0.18 |
3.96 ± 0.20 |
|
BScr2-I |
2.59 ± 0.18 |
2.78 ± 0.18 |
3.20 ± 0.20 |
4.00 ± 0.10 |
|
BScr3-I |
2.92 ± 0.19 |
3.10 ± 0.18 |
4.91 ± 0.19 |
5.71 ± 0.48 |
|
BSC1-U |
2.72 ± 0.15 |
2.91 ± 0.13 |
3.32 ± 0.14 |
4.12 ± 0.05 |
|
BSC2– U |
2.51 ± 0.14 |
2.72 ± 0.11 |
3.11 ± 0.01 |
3.91 ± 0.34 |
|
BSC3-U |
2.91 ± 0.19 |
3.10 ± 0.21 |
3.51 ± 0.33 |
4.31 ± 0.64 |
|
BSD1-U |
2.92 ± 0.18 |
3.13 ± 0.33 |
3.52 ± 0.17 |
4.32 ± 0.03 |
|
BSD2-U |
2.71 ± 0.15 |
2.93 ± 0.17 |
3.31 ± 0.24 |
4.11 ± 0.01 |
|
BSD3-U |
3.82 ± 0.17 |
4.03 ± 0.10 |
4.42 ± 0.07 |
5.22 ± 0.16 |
|
BScr1-U |
4.11 ± 0.15 |
4.30 ± 1.16 |
4.71 ± 0.51 |
5.51 ± 0.14 |
|
BScr2-U |
3.90 ± 0.13 |
4.10 ± 0.71 |
4.50 ± 0.10 |
5.30 ± 0.09 |
|
BScr3-U |
2.80 ± 0.18 |
3.01 ± 0.33 |
3.40 ± 0.35 |
4.20 ±0.18 |
|
BSC1-T |
2.00 ± 0.17 |
2.21 ± 0.014 |
2.60 ± 0.13 |
3.40 ± 0.08 |
|
BSC2-T |
2.61 ± 0.14 |
2.83 ± 0.18 |
3.21 ± 0.18 |
4.01 ± 0.04 |
|
BSC3-T |
2.82 ± 0.16 |
3.00 ± 0.20 |
3.42 ± 0.27 |
4.22 ± 0.15 |
|
BSD1-T |
4.08 ± 0.18 |
4.29 ± 0.11 |
4.68 ± 1.15 |
5.48 ± 0..31 |
|
BSD2-T |
3.84 ± 0.19 |
4.04 ± 0.34 |
4.44 ± 0.09 |
5.24 ± 0.09 |
|
BSD3-T |
2.83 ± 0.15 |
3.00 ± 0.27 |
3.43 ± 0.35 |
4.23 ± 0.05 |
|
BScr1-T |
2.57 ± 0.14 |
2.79 ± 0.11 |
3.17 ± 0.18 |
3.97 ± 0.15 |
|
BScr2-T |
2.72 ± 0.14 |
2.90 ± 0.12 |
3.32 ± 0.27 |
4.12 ± 0.07 |
|
BScr3-T |
2.63 ± 0.15 |
2.84 ± 0.11 |
3.23 ± 0.36 |
4.03 ± 0.10 |
A significant effect (p < 0.05) was revealed by the statistical analysis for each country of manufacture, types of biscuits and storage, the interaction between the country of manufacture and the types of biscuits, the interaction between the types of biscuits and storage, and the triple interaction between the country of manufacture and the types of biscuits and storage. The total count bacteria ranged from 2.62 – 4.00, 2.80 – 4.20, 2.65 – 3.99, 2.59 – 3.95, 2.87 – 4.27, 2.69 – 4.08, 2.68 – 4.10, 2.66 – 4.12, 2.75 – 4.15 log cfu/g for each of BSC1-S, BSC2-S, BSC3-S, BSD1-S, BSD2-S, BSD3-S, BScr1-S, BScr2-S, and BScr3-S, respectively. While the total count bacteria in the Iranian biscuit samples ranged from 2.61 – 3.98, 2.50 – 3.92, 2.61 – 4.02, 2.57 – 3.95, 2.63 – 4.02, 2.62 – 4.02, 2.57 – 3.96, 2.59 – 4.00, 2.92 – 5.7) log cfu/g for BSC1-I, BSC2-I, BSC3-I, BSD1-I, BSD2-I, BSD3-I, BScr1-I, BScr2-I, and BScr3-I respectively for a period of 90 days at room temperature. For the total count bacteria in the UAE biscuit samples, it ranged 2.72 – 4.12, 2.51 – 3.91, 2.91 – 4.31, 2.92 – 4.32, 2.71 – 4.11, 3.82 – 5.22, 4.11 – 5.51, 3.90 – 5.30, 2.80 – 4.20 log cfu/g for each of BSC1-U, BSC2-U, BSC3-U, BSD1-U, BSD2-U, BSD3-U, BScr1-U, BScr2-U, and BScr3-U, respectively. The total bacteria count in the Turkish biscuit samples were 2.00 – 3.40, 2.61 – 4.01, 2.82 – 4.22, 4.08 – 5.48, 3.84 – 5.24, 2.83 – 4.23, 2.57 – 3.97, 2.72 – 4.12, 2.63 – 4.03 log cfu/g for each of BSC1-T, BSC2-T, BSC3-T, BSD1-T, BSD2-T, BSD3-T, BScr1-T, BScr2-T, and BScr3-T, respectively. The results showed that 9 of the total 36 types of biscuits examined were less than the microbial limit of 4 log cfu/g as an acceptable limit for the total number of bacteria in biscuits specified by the Food and Agriculture Organization (FAO/WHO, 2001).10 These results were consistent with Nagi et al.52 who noted a large variation in the microbial content during the storage period, this significant increase in the microbial load of the baked biscuit samples for a period of three months was due to the significant increase in moisture during the storage period. The results also agreed with Kumari et al.53 and Tlay et al.54 They evaluated the shelf-life of biscuits and cookies by calculating the bacteria total number in the stored samples, as the results showed that the bacteria total number increased significantly with storage period. The data of the microbial content (Table 5) can be compared with the moisture content which facilitates the microbial growth. It can be seen that the moisture content increased with storing and (Fig.4) and microbial content showed the same increasing trend.
Conclusion
During this study different brands of biscuits were collected from Spanish, Iran, UAE, and Turkey by GC-MS for SFA and TFA and by HPLC for AFB1, AFB2, AFG1, and AFG2) as well as quality properties during storage for 90 days were investigated. it has been observed that the results showed that no AFB2 and AFG2 were found in any biscuits samples regardless of manufacturing country. However, AFB1 was found in BSD1-S, BSD1-I, BSC2-U and BScr1-T collected from Spain, Iran, UAE, and Turkey, respectively. The results also showed that G1 was only found BSD1-S and BScr1-T. The results showed that the values of SFA in cookies, crackers, and digestive for Spanish, Iran, UAE, and Turkey samples ranged from 20.69% to 45.90%, 10.90% to 47.03% and 11.35% to 46.87%, respectively. The results showed that the values of UFA in cookies, crackers, and digestive for Spanish, Iran, UAE, and Turkey samples ranged from 11.31% to 59.17%, 12.40% to 74.24% and ND to 68.79%, respectively. The results showed that the values of TFA in cookies, crackers, and digestive for Spanish, Iran, UAE, and Turkey samples ranged from ND to 21.425%, ND to 25.35% and ND to 4.68%, respectively. A gradual increase in the moisture content and peroxide value during the storage period in all the baked biscuit samples. The results showed that 9 of the total 36 types of biscuits examined were less than the microbial limit of 4 log cfu/g as an acceptable limit for the total number of bacteria in biscuits specified by the Food and Agriculture Organization. Monitoring biscuit fat is the best strategy to avoid industrially manufactured TFA and excessive SFA. Fortifying biscuits with omega fatty acids might encourage people to eat them and other nutrients. These statistics will help regulate children’s and health-conscious consumers’ biscuit saturated fat and trans-fat consumption. Knowing aflatoxins’ contents helps prevent health issues. The overall qualitative condition of biscuits deteriorated with storage time and suggest to eat these biscuits within 60 days of preparation.
Acknowledgements
This work was conducted in the ambit of the Cooperation Agreement between Dr. Ammar B. Altemimi, Department of Food Science, College of Agriculture, University of Basrah, Basrah 61004, Iraq, and Professor Angelo Maria Giuffrè (Department AGRARIA of the University ‘Mediterranea’ of Reggio Calabria, Italy).
Conflicts of Interest
The authors declare no conflict of interest.
Founding Sources
The author(s) received no financial support for the research, authorship, and/or publication of this article.
References
- Saeed S.M.G., Ali S.A., Ali R., Naz S., Sayeed S.A., Mobin L., Ahmed R.Utilization of Vigna mungoflour as fat mimetic in biscuits: Its impact on antioxidant profile, polyphenolic content, storagestability, and quality attributes. Legume Sci. 2020;2:e58. https://doi.org/10.1002/leg3.58
CrossRef - Saeed S.M.G., Urooj S., Ali S.A., Ali R., Mobin L., Ahmed R.; Sayeed S.A. Impact of the incorporation of date pit flour an underutilizedbiowaste in dough and its functional role as a fat replacer in biscuits. J Food Process Preserv. 2021;45:e15218. h t t p s : //d o i .org/10.1111/jfpp.15218
CrossRef - Saeed S.M.G., Ali S.A., Ali R., Sayeed S.A., Mobin L. Exploring the potential of bottle gourd (Lagenaria siceraria) flour as a fat mimetic in biscuits with improved physicochemical and nutritional characteristics and anti-diabetic properties. Ital J Food Sci. 2022;34(2):50–66.
CrossRef - Goubgou M., Songré-Ouattara L.T., Bationo F., Lingani-Sawadogo H., Traoré Y., Savadogo A. Biscuits: a systematic review and meta-analysis of improving the nutritional quality and health benefits. Food Prod Process Nutr. 2021;3(1):01-18.
CrossRef - Giuffrè A.M., Caracciolo M., Capocasale M., Zappia C., Poiana M. Effects of shortening replacement with extra virgin olive oil on the physical–chemical–sensory properties of Italian Cantuccini biscuits. Foods 2022;11:299. https://doi.org/10.3390/foods11030299
CrossRef - Saeed S.M.G., Ali S.A., Faheem K., Ali R., Giuffrè A.M. The impact of innovative plant sources (Cordia myxa L. fruit (Assyrian Plum) and Phoenix dactylifera L. biowaste (Date Pit)) on the physicochemical, microstructural, nutritional, and sensorial properties of gluten-free biscuits. Foods 2022;11:2346. https://doi.org/10.3390/foods11152346
CrossRef - Laganà V., Giuffrè A.M., De Bruno A., Poiana M. Formulation of Biscuits Fortified with a Flour Obtained from Bergamot By-Products (Citrus bergamia, Risso). Foods 2022;1:1137. https://doi.org/10.3390/foods11081137
CrossRef - Saeed S.M.G., Ali S.A., Naz J., Mirza M., Fawzy Elkhadragy M., Yehia H.M., Giuffrè A.M. Techno-functional, antioxidants, microstructural, and sensory characteristics of biscuits as affected by fat replacer using roasted and germinated chickpea (Cicer arietinum L.). Int J Food Prop. 2023;26(1):2055-2077. DOI: 10.1080/10942912.2023.2242602
CrossRef - Ali S.A., Saeed S.M.G., Sohail M., Fawzy Elkhadragy M., Yehia H.M., Giuffrè A.M. Functionalization of pre-gelatinized Urad bean fermented by Saccharomyces cerevisiae MK-157 as a fat replacer and its impact on physico-chemical, micromorphology, nutritional and sensory characteristics of biscuits. Arab J Chem2023;16(9):10502. https://doi.org/10.1016/j.arabjc.2023.105029
CrossRef - FAO, (2021). Africa Regional Overview of Food Security and Nutrition 2020: Transforming Food Systems for Affordable Healthy Diets. Food and Agriculture Organization,URL: https://www.fao.org/documents/ card/en/c/cb4831en/. Accessed on 12 September 2023.
- Barkai-Golan R. Aspergillus mycotoxins. In Mycotoxins in fruits and vegetables (pp. 115-151). Academic Press (2008).
CrossRef - N’Dede C.B. (2009). Economic risks of aflatoxin contamination in the production and marketing of peanut in Benin (Doctoral dissertation).
- Hwang J.H, Lee K.G. Reduction of aflatoxin B1 contamination in wheat by various cooking treatments. Food Chem. 2006;98(1):71-75.
CrossRef - IARC Working Group on the Evaluation of Carcinogenic Risks to Humans. (2012). Smokeless tobacco. In Personal Habits and Indoor Combustions. International Agency for Research on Cancer.
- Montagna M.T., De Giglio O., Napoli C. Mycotoxins in foodstuffs: Italian regulations in the European framework. Ann. Ig. 2012;4(6):475-89.
- Hooshfar S., Khosrokhavar R., Yazdanpanah H., Eslamizad S., Kobarfard F., Nazari F., Tsatsakis A. Health risk assessment of aflatoxin M1 in infant formula milk in IR Iran. Food Chem Toxicol. 2020;142:111455.
CrossRef - Dhaka V., Gulia N., Ahlawat K.S., Khatkar B.S. Trans fats-sources, health risks and alternative approach – A review. J Food Sci Technol. 2011;48(5):534-541.
CrossRef - Mozaffarian D., Katan M.B., Ascherio A., Stampfer M.J., Willett W.C. Trans fatty acids and cardiovascular disease. N Engl J Med. 2006;(15):1601-1613.
CrossRef - Global Burden of Disease Collaborative Network. Global Burden of Disease Study 2019. Dietary Risk Exposure Estimates 1990–2019; accessed on 11 12 September 2023. https://ghdx.healthdata.org/ record/ihme-data/gbd-2019-dietary-risk-exposure-estimates-1990-2019
- Institute for Health Metrics and Evaluation (IHME): Seattle, WA, USA, 2021. Accessed on 12 September 2023. https://www.healthdata.org/
- Abedi A.S., Hosseini H., Mohammadi A., Abdollahi Z., Hajifaraji M., Mousavi Khaneghah A. Fatty acid (FA) compositions and trans content of frequently consumed edible oils and fats from Iran’market. Curr Nutr Food Sci. 2016;12(1):56-64.
CrossRef - Nishida C., Uauy R., Kumanyika S., Shetty P. The joint WHO/FAO expert consultation on diet, nutrition and the prevention of chronic diseases: process, product and policy implications. Public Health Nutr. 2004;(1a):245-250.
CrossRef - Blankson G.K., Mills-Robertson F.C., Ofosu I.W. Survey of occurrence levels of aflatoxins in selected locally processed cereal-based foods for human consumption from Ghana. Food Control. 2019;95:170-175.
CrossRef - Bhaskar K., Sassykova L.R., Prabhahar M., Percis E.S., Nalini A., Jenish T., Sendilvelan S. Analysis of Cymbopogon Citratus, Pinus sylvestris and Syzygium cumini biodiesel feedstocks for its fatty acid composition. Mater. Today: Proc. 2021; 45:5970-5977.
CrossRef - Haider N.N., Altemimi A.B., George S.S., Baioumy A.A., El-Maksoud A.A.A., Pasqualone A., Abedelmaksoud T.G. Nutritional Quality and Safety Characteristics of Imported Biscuits Marketed in Basrah, Iraq. Appl. Sci. 2022;12(18):9065.
CrossRef - Liu R. Shi L., Zhang Z., Zhang T., Lu M., Wang X. Effect of refining process on physicochemical parameters, chemical compositions and in vitro antioxidant activities of rice bran oil. LWT 2019;109:26-32.
CrossRef - Švecová B., Mojmír M.A.C.H. Content of 5-hydroxymethyl-2-furfural in biscuits for kids. Interdiscip Toxicol. 2017;10(2):66.
CrossRef - Balouiri M., Sadiki M., Ibnsouda S.K Methods for in vitro evaluating antimicrobial activity: A review. J Pharm Anal. 2016;6(2):71-79.
CrossRef - Zain M.E. Impact of mycotoxins on humans and animals. J Saudi Chem Soc. 2011;15(2):129-144.
CrossRef - Kamal A.S.M., Khair A., Dawlatana M., Hassan M.T., Begum F., Rahim M. Evaluation of aflatoxins and pesticide residues in fresh and different processed mushrooms. Bangladesh J Sci Ind Res. 2009;44(2):193-198.
CrossRef - Gholamour Azizi I., Rouhi S. The Comparison of Total Fumonisin and Total Aflatoxin Levels in Biscuit and Cookie Samples in Babol City, Northern Iran. Iranian J Publ Health 2013;42(4):422-427.
- Lake R., Thomson B., Devane G., Scholes P. TransFatty Acid Content of Selected New Zealand Foods. J Food Comp. Anal. 1996;9(4):365-374.
CrossRef - Caponio F., Summo C., Delcuratolo D., Pasqualone A. Quality of the lipid fraction of Italian biscuits. J Sci Food Agric. 2006;86(3):356-361.
CrossRef - Fernández P.M., Juan S., Fatty acid composition of commercial Spanish fast food and snack food. Food Comp Anal. 2000;13(3):275-281.
CrossRef - Martin C.A., Carapelli R., Visantainer J.V., Matsushita M., de Souza N.E. Trans fatty acid content of Brazilian biscuits. Food Chem. 2005;93(3):445-448
- Rutkowska J., Adamska A., Sinkiewicz I., Białek, M. Composition of fatty acids in selected sorts of biscuits, offered for children. Acta Aliment. 2012;41(4):433-442.
CrossRef - Chandana P.P., Navaratne S.B. Development Of soft dough biscuits with high unsaturated fatty acids. Int J Multidiscip Eng Sci Studi. 2015;1:19-24.
- Daglioglu O., Tasan M., Tuncel B. Determination of fatty acid composition and total trans fatty acids of Turkish biscuits by capillary gas-liquid chromatography. Eur Food Res Technol. 2000;211(1):41-44.
CrossRef - Pigsborg K., Gürdeniz G., Rangel-Huerta O.D., Holven K.B., Dragsted L.O., Ulven S.M., Effects of changing from a diet with saturated fat to a diet with n-6 polyunsaturated fat on the serum metabolome in relation to cardiovascular disease risk factors. Eur J Nutr. 2022;61(4):2079-2089.
CrossRef - Xiao Z., Zhang W., Yang H., Yan Z., Ge C., Liao G., Su H. 1H NMR-based water-soluble lower molecule characterization and fatty acid composition of Chinese native chickens and commercial broiler. Food Res Int. 2021;140:110008.
CrossRef - Norhayati M., Azrina A., Norhaizan M.E., Muhammad Rizal R. Trans fatty acids content of biscuits commercially available in Malaysian market and comparison with other countries. Int Food Res J. 2011;18:1097-1103.
- Kandhro A., Sherazi S.T.H., Mahesar S.A., Bhanger M.I., Talpur M.Y., Arain S. Monitoring of fat content, free fatty acid and fatty acid profile including trans fat in Pakistani biscuits. J Am Oil Chem Soc. 2008;85(11):1057-1061.
CrossRef - Mahloko L.M., Silungwe H., Mashau M.E., Kgatla T.E. Bioactive compounds, antioxidant activity and physical characteristics of wheat-prickly pear and banana biscuits. Heliyon 2019; 5(10):e02479.
CrossRef - McMinn W.A., McKee D.J., Magee T.R.A. Moisture adsorption behaviour of oatmeal biscuit and oat flakes. J Food Eng. 2007;79(2):481-493.
CrossRef - Kumar R., Samsher, Chandra S. Studies on proximate analysis of biscuits using multigrain flours during ambient condition. Int J Food Sci Nutr. 2016;1(2):39-41.
- Odeh S.M.A., Yamani M.I., A Study of the Chemical and Microbiological Quality of Baloryeh, Burma and Baklawa, Traditional Arabic Sweets Produced In Jordan. J Agric Environ Sci. 2019; 8(1):120-128.
CrossRef - Chugh B., Singh G., Kumbha B.K. Studies on the Optimization and Stability of Low-Fat BiscuitUsing Carbohydrate-Based Fat Replacers. Int J Food Prop. 2015;18:1446–1459. DOI: 10.1080/10942912.2013. 833218
CrossRef - Kumari N., Sindhu S.C., Rani V., Kumari V. Shelf Life Evaluation of Biscuits and Cookies Incorporating Germinated Pumpkin Seed Flour. Int J Curr Microbiol App Sci. 2021;10(01):1436-1443. doi: https://doi.org/10.20546/ijcmas.2021.1001.170
CrossRef - Mańkowska D., Majak I., Bartos A., Słowianek M., Łącka A., Leszczyńska J. 5-hydroxymethylfurfural content in Selected Gluten-and Gluten-free Cereal Food Products. Biotechnol Food Sci. 2017;18:1. https://doi.org/10.34658/bfs.2017.81.1.11-21
- Jalili M., Ansari F. Identification and quantification of 5-hydroxymethylfurfural in food products. Nutr Food Sci Res. 2015;2:47-53.
- Michalak J., Gujska E., Czarnowska M., Klepacka J., Nowak F. Effect of storage on acrylamide and 5-hydroxymethylfurfural contents in selected processed plant products with long shelf-life. Plant Foods Hum Nutr. 2016;71(1):115-122.
CrossRef - Nagi H.P.S., Kaur J., Dar B.N., Sharma S. Effect of storage period and packaging on the shelf life of cereal bran incorporated biscuits. Am J Food Technol. 2012;7(5):301-310.
CrossRef - Kumari N., Sindhu S.C., Rani V., Kumari V. Shelf Life Evaluation of Biscuits and Cookies Incorporating Germinated Pumpkin Seed Flour. Int. J Curr Microbiol Appl Sci. 2021;10:1436-1443.
CrossRef - , R. H., Abdul-Abbas, S. J., El-Maksoud, A. А. А., Altemimi, A. B., Abedelmaksoud, T. G. Functional biscuits enriched with potato peel powder: Physical, chemical, rheological, and antioxidants properties. Food systems 2023;6(1):53-63.
CrossRef
Accepted on: 29 Nov 2023
Second Review by: Jorge Octavio Virues Delgadillo
Final Approval by: Dr. Norazmir Md Nor


Web of Science Coverage
Emerging Sources Citation Index (ESCI)
2024 Journal Impact Factor: 1.1
Scopus Journal Metrics
CiteScore 2025: 2.6
CiteScore Details
Sustainable Nutrition: Food Systems, Nutrient Retention, and Public Health Impact
![]()
This journal is a member of, and subscribes to the principles of, the Committee on Publication Ethics (COPE)


