Optimization of Vitamin E Extraction from Rice Bran Oil Deodorizer Distillate using Response Surface Methodology
Laichheang Yort1
, Jitkunya Yuenyong2, Phumon Sookwong2 and Sudarat Jiamyangyuen1* 1Department of Ago-Industry, Faculty of Agriculture, Natural Resources, and Environments, Naresuan University, Phitsanulok, Thailand.
2Rice and Cereal Chemistry Research Laboratory, Department of Chemistry, Faculty of Science, Chiang Mai University, Chiang Mai, Thailand
Corresponding Author E-mail: sudaratj@nu.ac.th
DOI : http://dx.doi.org/10.12944/CRNFSJ.10.3.28
Download this article as:
![]()
Rice bran oil deodorizer distillate (RBODD) is the low valuable secondary product of refinery rice bran oil. However, RBODD contains bioactive compounds such as vitamin E, gamma-oryzanols, and phytosterols. To increase value of vitamin E obtained from underutilized product, tocopherols and tocotrienols were extracted from RBODD using ethanol followed by a freezing step. The response surface method (RSM) is known as a potential tool for optimizing processing parameters in order to save time, energy, and chemical material. In current study, vitamin E extract (VEE) was extracted using ethanol and response surface method (RSM) was employed to investigate the optimum condition. The ratio of RBODD: ethanol (1:5, 1:10, and 1:15) and the incubation temperature (0, -20, and -40℃) of vitamin E extraction were used to design the experiment using a central composite design (CCD). Once the optimization process was completed, the RSM was executed using the following 5 responses simultaneously: VEET3, VEEToc, VEETot, RecoveryVEE, and YieldVEE. Results showed that values of each parameter were VEET3 (10.69-89.60 mg/g), VEEToc (2.85-23.37 mg/g), VEETot (13.53-112.97mg/g), RecoveryVEE (16.15-134.76%), and YieldVEE (12.64-44.48%). All model predictions were significant, with non-significant lack of fit (> 0.05). In addition, the values of R2 and R2(Adj) of model were in the range of 0.922-0.988 and 0.893-0.982, respectively. According to these findings, response values were associated with RBODD:ethanol ratio and the incubation temperature. The ratio 1:9.5 (RBODD: Ethanol) and incubation temperature at -26.5 ℃ provided the optimal condition for vitamin E extraction from RBODD. At this optimum condition, it was determined that the predicted responses for VEET3, VEEToc, VEETot, RecoveryVEE, and YieldVEE were 81.87 mg/g, 23.70 mg/g, 103.64 mg/g, 123.63 %, and 20.05%, respectively. The obtained product with high content of tocopherol and tocotrienol can be used as ingredient in food as well as pharmaceutical applications.
KEYWORDS:Response surface methodology; Rice bran oil deodorizer distillate; Vitamin E extraction
Introduction
RBODD is a low-priced secondary product of refinery rice bran oil in the deodorization step1. Normally, RBODD is utilized as an animal feed ingredient2. However, it contains various health-promoting components, e.g. tocopherol, tocotrienol, phytosterols, squalene, and gamma oryzanol3. Consequently, RBODD is an interesting source of those compounds, and earlier research looked into their extraction and separation3,4,5,6.
As essential micronutrient and a fat-soluble compound, vitamin E aids in antioxidant production. It serves as the defense mechanism against UV-induced aging, skin damage, and oxidative stress7. Vitamin E (tocols) is classified into 2 forms of tocopherol and tocotrienol which have the same chromanol ring form of a 16-carbon phytyl chain that is included among the Methyl Groups (R’& R”)8. However, while the saturated is formed into tocopherols, tocotrienols form unsaturated isoprenoid side chains with three double bonds of carbon. These chemical structures form 8 derivatives of tocols that have been identified and classified as α, β, γ, and δ isomer of tocopherol and tocotrienol9. Tocols is the essential vitamin found in an extracted from vegetable oils, seeds, and grains. Commercially, it is commonly extracted from soybean distillates10. The study of RBODD as a source of vitamin E extraction is presently limited. Therefore, the extraction of vitamin E from RBODD was performed in order to increase the value of this underutilized product.
The selection of nontoxic, noncorrosive, and noncarcinogenic solvents for vitamin E extraction is concerned as vitamin E is utilized as a food supplement or fortifier. Ethanol is a good candidate solvent because it is secure and environmentally friendly. Ethanol is naturally found in foods like wine, beer, and fermented foods. In industrial, it is made utilizing corn and tapioca carbohydrate feedstocks11. According to Shimada et al.,12 since tocopherols were soluble in cold ethanol while sterols were not, ethanol fractionation was utilized in the industrial purification of tocopherols to separate sterols from deodorizer distillates of soybean oil.
RSM has been demonstrated to be the effective technique for determining the optimal condition for manufacture processes. It is generally used for the parameter estimation while fitting models using multiple regression analysis. It is also used for the interaction examination of both independent and interactive variables. In addition, the optimum condition for an operation is also obtained11. The efficiency and flexibility of the RSM experimental design is Central Composite Design (CCD). CCD provides the appropriate amount of data, which also reduces the number of experiments. This process results in saving time and providing cheaper approaches configuring a precisely established the optimal solution compared to the full-factorial or univariate (one factor at a time) methods. RSM has been effectively useful in the extraction of biochemicals in many studies. Nevertheless, most of these researches focus on the extraction of biochemicals from solid material utilizing various technologies, including solvent extraction and supercritical fluid extraction13,14,15. RSM has been used to optimize the simultaneous extraction of carotenes and vitamin E from crude palm olein in a temperature-controlled mixer-settle system using ethyl lactate and ethanol as solvents11.
The purposes of this research were to optimize condition of vitamin E extraction from RBODD using RSM and to study the effect of extraction condition on concentration of each tocols derivatives, % recovery, and % yield of vitamin E content from RBODD.
Materials and methods
Materials
Rice bran oil deodorizer distillate (RBODD) was kindly supported by the Surin Bran Oil Co., Ltd. Surin, Thailand.
Vitamin E extraction
Table 1 expressed independent variables and their levels used for central composite design. Each parameter was set at a low, high, and center value that was distributed over all of the experiments resulting in total of 13 experiments. Response values including T3, Toc, total tocols, percentage of recovery, and percentage of yield were utilized to evaluate the effects of input variables.
Table 1: Independent variables and their levels used for central composite design
| Variables | Coded | Coded level | ||
| –1 | 0 | 1 | ||
| Ratio (RBODD: Ethanol) | X1 | 1:5 | 1:10 | 1:15 |
| Temperature (°C) | X2 | -40 | -20 | 0 |
Vitamin E extractions were modified according to Ko et al.,4. The RBODD and Ethanol was mixed using different ratios. The mixture solution in a 500-mL round flask was refluxed for 30 minutes on the hot plate to eliminate the aggregative residues. The sample was then cooled in a fume hood to room temperature for 1 hour. The resultant mixtures were then incubated at different low temperature 24 h in a freezer. The residue of distillate after separation of crystal pellet from liquid fraction using a sintered glass absorption filter was extracted again with the same conditions, and the resultant liquid fraction was mixed together. The vitamin E extract (VEE) after removing ethanol by vacuum evaporation at 40 °C was later stored at –20°C until analysis was performed.
HPLC analysis
Quantitative analysis of tocols was determined using a HPLC and modified according to methods described by Pokkanta et al,.9. An Agilent HPLC 1100 and a fluorescence detector constituted the apparatus (Model 1046A, Hewlett Packard, CA). VertiSep™ UPS C18 column (4.6 × 250 mm, 5 μm, Vertical Chromatography Co., Ltd., Bangkok, Thailand) was used as the separation columns tested. An isocratic elution (50:50) of methanol (A) and acetonitrile (B) was used as the mobile phase. The column was maintained at a constant temperature of 30℃, and the flow rate was 1.5 mL/min. A fluorescence detection of tocols was achieved (excitation at 294 nm and emission at 326 nm). 0.5 g of sample (VEE) were diluted with dichloromethane, then adjusted the volume to 1.00 mL. 0.45 m nylon syringe filter was used to filter the solution. The chromatographic analysis was using 5.0 μL of sample injection.
% Recovery and % yield calculation
% Recovery and % yield of VEE was calculated by the following equations:
Regression analysis
The two independent variables, including X1 (ratio 1:5, 1:10, and 1:15 w/v of RBODD: Ethanol) and X2 (incubation temperature 0, -20, and -40°C) were used in the experiment. The model construction and data analysis were carried out using Design-Expert software version 12. Total of 13 experimental treatments were obtained using a central composite design (CCD). All treatments were performed in triplicates. For the evaluation of the fitting model, the regression analysis of the responses was performed using a second order polynomial equation:
![]()
where, Y: response variable, β0: intercept, β1and β2: linear regression coefficient for X1 and X2 respectively, β11 and β22: regression coefficient for quadratic term of X12 and X22, and β12: regression coefficient for interaction term between X1 and X2.
The optimization vitamin E extraction from RBODD was simultaneously operated by using 5 responses including tocotrienol (T3), tocopheorl (Toc), total tocols (Tot), Recovery (REC), and Yield. The 3D response surface and contour graphs were illustrated in order to examine how multiple variables interact with multiple responses. Through the use of a numerical optimization tool, the optimum condition for each maximum response was determined.
Data analysis
Analysis of variance (ANOVA) was performed with p-value <0.05 for significant models and at p-value>0.05 for an insignificant lack of fit.
Result and discussion
As the raw material, RBODD was analyzed for its tocopherol (Toc) and tocotrienol (T3) content. A chromatographic result of RBODD tocols is shown in Figure 1. For tocopherol, only δ-, γ-, and α- forms of tocopherol (Toc) were detected individually. However, β-Toc was absent in the RBODD, which agrees with a result from a previous study of Pestana et al.16. It could be due to the low concentration of β-Toc in rice bran oil. Thus, β-Toc was analyzed alongside γ-Toc because this mixture of isomers cannot often be separated using reverse phase HPLC.16 It can be seen that tocotrienol (T3) was detected around 5-11 min but could not be separated individually due to matrix interference of natural vitamin E extract.
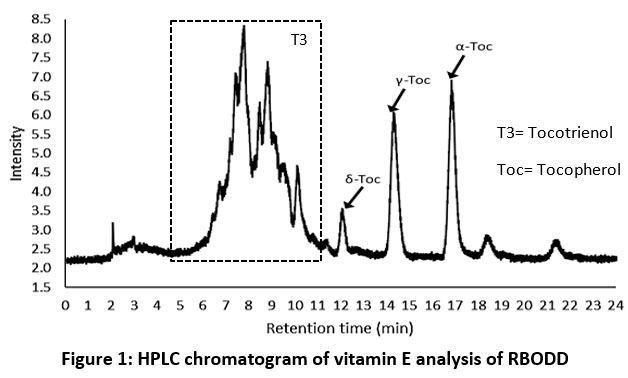 |
Figure 1: HPLC chromatogram of vitamin E analysis of RBODD |
Accordingly, in the present study, the amount of Toc was calculated as a summation of δ, γ, and α-Toc. T3 was determined as γ-T3 equivalent since γ-T3 is the most predominant T3 form present in rice bran. Overall, vitamin E content (Total tocols; Tot) in RBODD was calculated as a summation of T3 and Toc. From the analysis, initial amounts of compounds in RBODD were T3 (63.69±5.37 mg/g), Toc (10.83±0.78mg/g), and total tocols (74.52±7.04 mg/g) (data not shown).
Vitamin E extraction
The effects of vitamin E extraction on response values of VEE on their actual and predicted values are shown in Table 2. The actual values of T3, Toc, total tocols content of VEE were in the range of 10.69-89.60 mg/g, 2.85-23.37 mg/g, and 13.53-112.97 mg/g, respectively. Results showed that the high values of T3, Toc, and total tocols were found when using ratio of 1:10 and -20°C (#9, 10, 11, 12, and 13). It can also be seen that the lowest content of Toc, T3 and total tocols are from the highest temperature (0°C), indicating that high temperatures are not suitable conditions for the extraction of vitamin E.
The total tocols content in extract as compared to a feeding material were calculated to obtain %recovery. The recovery ranged from 16.15-134.76%. The results demonstrated that lower temperatures provided higher recovery percentage. The high RecoveryVEE were obtained in sample #9, #10, #11, #12, and #13 when using ratio 1:10 RBODD:ethanol and at -20°C. It was reported that low temperatures are preferred not only for crystallization, but also solubility of tocols10. This low temperature affiliates in obtaining high concentration of tocols in separated liquid fraction. Ko et al.4 similarly found that when extracting tocols from RBODD using acetonitrile as solvent with a ratio 1:20 and the incubation temperature decreased from 0°C to -40°C, the total tocols content increased from 53.7 mg/g to 89.9 mg/g. In addition, when recovery was considered in the present study, it was found that -20°C was optimal temperature for extraction. From the result, it can be noticed that Incubation temperature exhibited more impact of vitamin E content in extract than the ratio of RBODD:ethanol.
Vitamin E extraction yield ranged from 12.64 to 44.48%. The highest yield was found at sample #6 (ratio of 1:15 and -20°C of incubation temperature). With a smaller amount of solvent used (low RBODD:Ethanol ratio), the extraction yield tended to be low. This could due to the fact that less amount of solvent was insufficient for vitamin E compounds to be dissolved and extracted.
Table 2: Effect of vitamin E extraction on actual values and predicted value of Toc, T3, Total tocols, % recovery and %yield of VEE from RBODD
| No | X1 | X2 | VEET3 (mg/g) | VEEToc (mg/g) | VEETot (mg/g) | RECVEE (%) | YieldVEE (%) | |||||
| Actual Value | Predicted Value | Actual Value | Predicted Value | Actual Value | Predicted Value | Actual Value | Predicted Value | Actual Value | Predicted Value | |||
| 1 | 1:5 | -40 | 30.13 | 30.37 | 9.13 | 9.28 | 39.26 | 42.26 | 46.84 | 50.41 | 12.64 | 12.45 |
| 2 | 1:15 | -40 | 33.53 | 30.37 | 7.70 | 6.84 | 41.23 | 35.21 | 49.18 | 42.00 | 17.87 | 18.61 |
| 3 | 1:5 | 0 | 14.00 | 11.88 | 3.73 | 3.72 | 17.72 | 16.69 | 21.14 | 50.41 | 16.41 | 15.94 |
| 4 | 1:15 | 0 | 10.69 | 11.88 | 2.85 | 3.05 | 13.53 | 13.90 | 16.15 | 16.59 | 25.34 | 32.27 |
| 5 | 1:5 | -20 | 20.26 | 53.35 | 6.24 | 15.05 | 26.50 | 75.45 | 31.61 | 90.00 | 14.86 | 17.12 |
| 6 | 1:15 | -20 | 44.16 | 53.35 | 9.90 | 10.26 | 54.07 | 62.86 | 64.50 | 74.98 | 44.48 | 40.87 |
| 7 | 1:10 | -40 | 39.91 | 44.79 | 10.08 | 11.78 | 49.99 | 55.48 | 59.63 | 66.19 | 20.35 | 14.78 |
| 8 | 1:10 | 0 | 16.15 | 17.52 | 4.63 | 4.31 | 20.78 | 21.91 | 24.79 | 26.14 | 22.20 | 20.74 |
| 9 | 1:10 | -20 | 83.67 | 78.68 | 18.97 | 20.51 | 102.65 | 99.07 | 122.4 | 118.17 | 26.56 | 23.12 |
| 10 | 1:10 | -20 | 89.60 | 78.68 | 23.37 | 20.51 | 112.97 | 99.07 | 134.76 | 118.17 | 23.08 | 23.12 |
| 11 | 1:10 | -20 | 74.78 | 78.68 | 21.07 | 20.51 | 95.85 | 99.07 | 114.34 | 118.17 | 23.67 | 23.12 |
| 12 | 1:10 | -20 | 76.30 | 78.68 | 19.01 | 20.51 | 95.31 | 99.07 | 113.69 | 118.17 | 22.49 | 23.12 |
| 13 | 1:10 | -20 | 81.15 | 78.68 | 19.53 | 20.51 | 100.67 | 99.07 | 120.09 | 118.17 | 22.14 | 23.12 |
VEE= Vitamin E Extraction, T3= Tocotrienol, Toc= Tocopherol, Total tocols (Tot)= Toc + T3, and REC= recovery. Values are Mean with triplicates (n=3)
Model fitting
The regression models are normally used to express the association between the independent (X) and dependent variable (Y). In the present study, quadratic expressions have been used to represent the response variable equation models. The equation described the relationships between the ratio (X1) and incubation temperature (X2) to various responses for the vitamin E extraction condition. However, in order to increase the prediction accuracy, the different transformations to some models were performed including log, inverse square root, and power. The quadratic model expressions for the responses of VEE have been presented by equations 2-6 as follows:
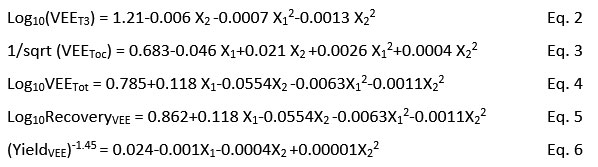
The developed models in this study (Eq. 2 – Eq. 6) provided a strong prediction for the simultaneous vitamin E extraction estimate. The predicted values of various responses for VEE were exhibited in Table 2. From Tables, the model was successful in accurately predicting the majority of the value for each response.
Regression coefficients of the optimized model, the coefficient of determination (R2), the adjusted coefficient of determination (R2Adj), and the F-test of the predicted models for each response were displayed in Table 3. From Table, the effects of ratio (X1) were generally more evident compared to those of incubation temperature (X2) as indicated by higher values of coefficients. The interaction term (X1X2) indicated no significant coefficients for all of the response values. Lack of fit (LOF) p-values were greater than 0.05 for all models. The insignificant LOF indicated that the developed models can fit well with data.
For regression models, R2 is a goodness-of-fit indicator. This indicates the percentage of the variance of a dependent variable that contributes to the explanation of independent variables. R2Adj is a modified version of R2 that has been adjusted for the number of predictors in the model. In order to increase R2 and R2Adj of models, the data manipulation was performed as recommended by Design-Expert software. The R2 of model after transforming data were relatively high and ranged from 0.922 to 0.988. All data obtained in Table 3 indicates that these response models can be well explained by the ratio of RBODD:Ethanol and the incubation temperature of extraction.
Table 3: Regression coefficient, R2, R2Adj and F–test value for the predicted models for each response
| Tocotrienol | Tocopherol | Total Tocols | Recovery | Yield | |
| Intercept | 1.210 | 0.683 | 0.785 | 0.862 | 0.024 |
| Ratio (X1) | NS | -0.046 | 0.118 | 0.118 | -0.001 |
| Temperature (X2) | -0.006 | 0.021 | -0.0554 | -0.0554 | -0.0004 |
| X1X2 | NS | NS | NS | NS | NS |
| X12 | -0.0007 | 0.0026 | -0.0063 | -0.0063 | NS |
| X22 | -0.0013 | 0.0004 | -0.0011 | -0.0011 | 0.00001 |
| R2 | 0.984 | 0.988 | 0.985 | 0.985 | 0.922 |
| R2Adj | 0.975 | 0.982 | 0.977 | 0.977 | 0.893 |
| P–value | <0.0001 | <0.0001 | <0.0001 | <0.0001 | <0.0001 |
| Lack of Fit | 0.075 | 0.056 | 0.0736 | 0.0736 | 0.0603 |
| Transform | Base 10 log | Inverse square root | Base 10 log | Base 10 log | Power -1.45 |
*NS: Not significant
Response surface analysis and optimization
Figure 2 A-E shows the response surface (3D) and contour plot that provide a visual interpretation of interactions between two tested variables and different responses of VEE. Two variables within the experimental range were represented on a single 3D surface plot. Different contour shapes represented distinct interactions between the variables. When there was a complete interaction between the independent variables, elliptical contours were formed, while circular contour plots suggested neglibile17. Results of the present study showed that the contour plot was elliptical shape thus indicates interaction effect of ratio RBODD:ethanol and incubation temperature on T3, Toc, total tocols, recovery, and yield of VEE.
From response surface plot, the contents of T3, Toc, total tocols, recovery, and yield increased when the ratio and temperature increased until they reached the maximum area before values began to decrease. The optimal area was found when the ratio was close to 10 and the temperature was -20℃. Likewise, Ko et al.4 reported that T3, Toc and total tocols contents increased when incubation temperature decreased from 0 to -20 ℃. However, there was no significant difference when temperature ranged from -20℃ to -40℃.
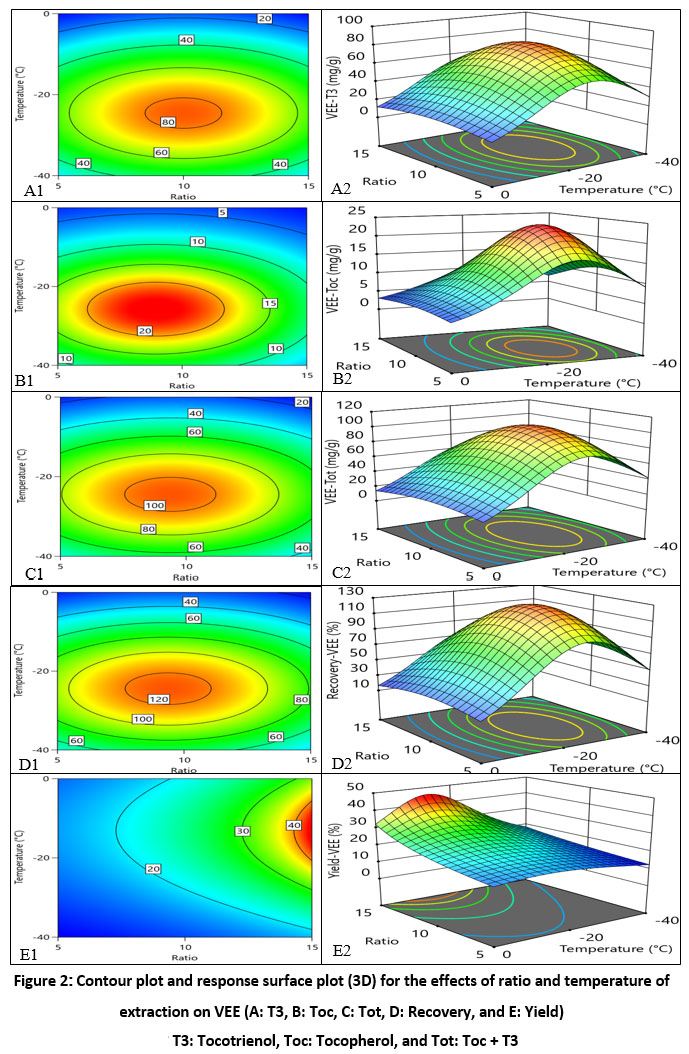 |
Figure 2: Contour plot and response surface plot (3D) for the effects of ratio and temperature of extraction on VEE (A: T3, B: Toc, C: Tot, D: Recovery, and E: Yield).Click here to view Figure |
When all response parameters were considered simultaneously, the optimal condition was obtained from the overlay plot as shown in Figure 3. The optimal point where the maximum value of all response adjoined was at ratio 1:9.5 and incubation temperature -26.5 ℃. When using this optimal condition in the model to predict each response value, it was found that T3, Toc, Tot, recovery, and yield values were 81.87 mg/g, 23.70 mg/g, 103.64 mg/g, 123.63 %, and 20.05%, respectively.
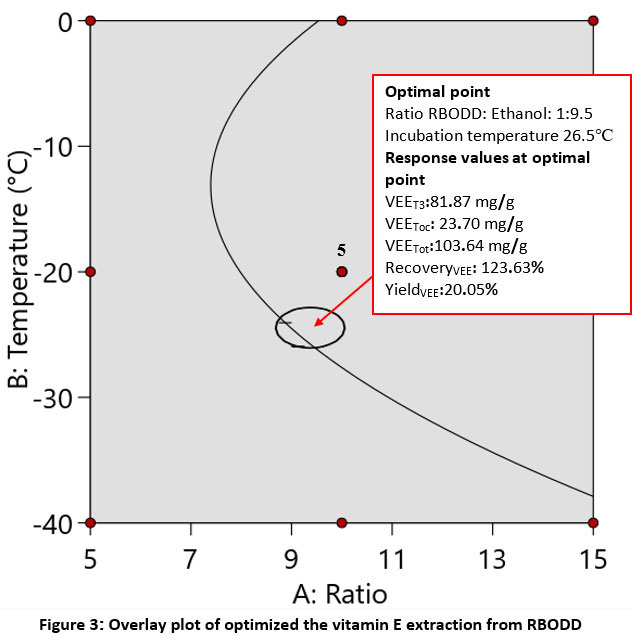 |
Figure 3: Overlay plot of optimized the vitamin E extraction from RBODD |
Model Validation
In order to evaluate model validation after the optimal condition was identified, the actual experiment for VEE extraction was performed. The obtained extract was then measured to acquire observed values and results are shown in Table 4. It can be noticed from the Table that predicted values of some parameters were inconsistent from the observed values. This could due to the fact that the optimal condition was selected based on all responses to be optimized simultaneously. In addition, all terms associated with independent variables were incorporated in the model. This could possibly lead to some deviations of predicted and observed values. However, it was found that observed values fall in the 99% prediction interval, indicating that models were valid and accurate in predicting the response values.
Table 4: Predicted and experimental data at optimal condition of vitamin E from RBODD
| Condition/Sample | Observed value | Predicted value | 99 % Prediction Interval | |
| Ratio RBODD: Ethanol | 1:9.50 | 1:9.50 | Low | High |
| Incubation Temperature (℃) | -26.00 | -26.50 | ||
| VEET3 (mg/g) | 129.35±4.83 | 81.87 | 51.50 | 129.15 |
| VEEToc (mg/g) | 30.14±0.84 | 23.70 | 13.39 | 50.29 |
| VEETot (mg/g) | 159.49±5.67 | 103.64 | 66.99 | 160.08 |
| RecoveryVEE (%) | 190.26±6.76 | 123.63 | 79.91 | 190.95 |
| YieldVEE (%) | 21.01±0.37 | 20.05 | 14.98 | 32.94 |
Conclusion
Optimization for ethanol extraction of vitamin E using RSM was successfully performed. The value of R2 of model were in the range of 0.922-0.988. Simultaneous consideration for all responses resulted in optimal condition when using ratio RBODD: Ethanol 1:9.5 and -26.5oC incubation temperature. Using the optimal condition, vitamin E from RBODD can be extracted and used in various food applications. The RBODD was proved to be potential source for vitamin E extraction. However, in order to increase the efficiency of extraction, the study of different solvents for extraction is suggested. Moreover, it is recommended that additional steps in concentrating final product to the vitamin E rich fraction should be further studied.
Acknowledgement
The authors would like to express gratitude for providing funds for this research work.
Conflict of Interest
The author(s) declares no conflict of interest.
Funding sources
This study is supported by the Royal Golden Jubilee (RGJ) Ph.D. Program (Grant No. PHD/0245/2560) and through the National Research Council of Thailand; NRCT (Grant No. R2565B008).
References:
- Shi L., Zheng L., Liu R. Quantification of polycyclic aromatic hydrocarbons and phthalic acid esters in deodorizer distillates obtained from soybean, rapeseed, corn and rice bran oils. Food Chem. 2019; 275: 206-213. doi:10.1016/j.foodchem.2018.09.119
CrossRef - Sherazi S.T.H., Mahesar S.A. Vegetable oil deodorizer distillate: a rich source of the natural bioactive components. J Oleo Sci. 2016; 65(12): 957-966. https://doi.org/10.5650/jos.ess16125
CrossRef - Sawadikiat P., Setwipattanachai P., Chaiseri S., Hongsprabhas P. Rice phytochemicals concentrated by molecular distillation process and their use as co-surfactant in water dispersion. J Food Sci Technol. 2015; 52(12): 8014–8022. https://doi.org/10.1007/s13197-015-1885-1
CrossRef - Ko S.N., Lee S.M., Kim I.H. The concentration of tocols from rice bran oil deodorizer distillate using solvent. Eur J Lipid Sci Technol. 2008; 110(10): 914-919. https://doi.org/10.1002/ejlt.200700310
CrossRef - Jaiswal S., Pradhan S., Patel M., Naik M., Naik S. Rice bran oil distillate, a choice for gamma-oryzanol: separation and oxidative stability study. J Food Sci. 2014; 4(2): 36-43. https://doi.org/10.5539/jfr.v4n2p36
CrossRef - Nandi S., Bhattacharyya R. Isolation of squalene from rice bran oil fatty acid distillate using bioprocess technology. IJRASET. 2017; 5(9): 509-512. https://doi.org/10.22214/ijraset.2017.9074
CrossRef - Shahidi F., Pinaffi-Langley A.C.C., Fuentes J., Speisky H., de Camargo A.C. Vitamin E as an essential micronutrient for human health: Common, novel, and unexplored dietary sources. Free Radic Biol Med. 2021; 176: 312-321. doi:10.1016/j.freeradbiomed. 2021.09.025
CrossRef - Jiang Q. Natural forms of vitamin E: metabolism, antioxidant, and anti-inflammatory activities and their role in disease prevention and therapy. Free Radic Biol Med. 2014; 72: 76-90. http://doi:10.1016/j.freeradbiomed.2014.03.035
CrossRef - Pokkanta P., Sookwong P., Tanang M., Setchaiyan S., Boontakham P., Mahatheeranont S. Simultaneous determination of tocols, γ-oryzanols, phytosterols, squalene, cholecalciferol and phylloquinone in rice bran and vegetable oil samples. Food Chem. 2019; 271: 630-638. doi:10.1016/j.foodchem.2018.07.225
CrossRef - Ngoc D.P., Tan T., Siow L.F. Dry fractionation approach in concentrating tocopherols and tocotrienols from palm fatty acid distillate: a green pretreatment process for vitamin E extraction. J Am Oil Chem Soc. 2021; 98(6): 609-620. doi:10.1002/aocs.12488
CrossRef - Kua Y.L., Gan S., Morris A., Ng H.K. Optimization of simultaneous carotenes and vitamin E (tocols) extraction from crude palm olein using response surface methodology. Chem Eng Commun. 2018; 205(5): 596-609. https://doi.org/10.1080/00986445.2017.1407760
CrossRef - Shimada Y., Nakai S., Suenaga M., Sugihara A., Kitano M., Tominaga Y. Facile purification of tocopherols from soybean oil deodorizer distillate in high yield using lipase. J Am Oil Chem Soc. 2000; 77(10): 1009-1013. https://doi.org/10.1007/s11746-000-0160-z
CrossRef - Belwal T., Dhyani P., Bhatt I.D., Rawal R.S., Pande V. Optimization extraction conditions for improving phenolic content and antioxidant activity in Berberis asiatica fruits using response surface methodology (RSM). Food Chem. 2016; 207: 115-124. https://doi.org/10.1016/j.foodchem.2016.03.081
CrossRef - Kang J.H., Kim S., Moon B. Optimization by response surface methodology of lutein recovery from paprika leaves using accelerated solvent extraction. Food Chem. 2016; 205: 140-145. https://doi.org/10.1016/j.foodchem.2016.03.013
CrossRef - Zaghdoudi K., Framboisier X., Frochot C., Vanderesse R., Barth D., Kalthoum C.J., Blanchard F., Guiavarc’h Y. Response surface methodology applied to supercritical fluid extraction (SFE) of carotenoids from Persimmon (Diospyros kaki L.). Food Chem., 2016; 208: 209-219. https://doi.org/10.1016/j.foodchem.2016.03.104
CrossRef - Pestana B.V.R., Zambiazi R.C., Mendonça C.R., Beneito C.M., Ramis R.G. γ-Oryzanol and tocopherol contents in residues of rice bran oil refining. Food Chem. 2012; 134(3): 1479-1483. https://doi.org/10.1016/j.foodchem.2012.03.059
CrossRef - Ju Y.S., Yoon J.H., Kim J.H. Optimal processing conditions of Boswellia carteri Birdw. using response surface methodology. Pharmacogn Mag. 2018; 14(54): 235-241. doi:10.4103/pm.pm_140_17
CrossRef
Accepted on: 8 Dec 2022
Second Review by: Sofia Agriopoulou Greece , Blanca Rosa Aguilar Scanga Mexico
Final Approval by: Dr. Adele Papetti


Web of Science Coverage
Emerging Sources Citation Index (ESCI)
2024 Journal Impact Factor: 1.1
Scopus Journal Metrics
CiteScore 2025: 2.6
CiteScore Details
Sustainable Nutrition: Food Systems, Nutrient Retention, and Public Health Impact
![]()
This journal is a member of, and subscribes to the principles of, the Committee on Publication Ethics (COPE)


