
Introduction
Tempe is one of the Indonesian food products that is made from synergetic fermentation of soybean with the help of mold (Rhizopus spp) and lactic acid bacteria1. Compared with soybean, Tempe has a higher protein and carbohydrate digestibility. During the fermentation process, the occurrence of enzymatic hydrolysis helps in breaking down the complex compounds into simpler, easily digested and absorbed compounds2,3. During the fermentation process, the phytic acid that exists in the soybean is reduced by the phytase enzyme secreted by the mold4. The protein is hydrolyzed into short-chain peptides and free amino acids by protease enzyme, while the carbohydrate is hydrolyzed onto shorter saccharide compounds by amylase enzyme and the fat is hydrolyzed into free fatty acids5 In addition, there are several vitamin contents, specifically higher vitamin B in Tempe compared with soybean. The vitamins which are commonly found in Tempe are Vitamin B1, Vitamin B2, pantothenic acid, niacin, vitamin B6 and vitamin B125–7.
One of the most potential processed Tempe products is Tempe drink powder (TDP). Processing Tempe into TDP can provide an alternative way to consume Tempe8, since Tempe is commonly consumed as food. TDP can be one of the innovations in soy-based drinks that are being heavily promoted as a health beverage. Several studies have shown that consuming Tempe drink powder three glasses/day for 4 weeks consecutively will reduce blood LDL levels significantly in hypercholesterolemia subjects8, reduce blood pressure in hypertension patients9 and reduce blood glucose in diabetes patients10,11. Tempe flour consumption is also shown to increase estrogen serum12 and prevent osteoporosis13,14.
Several studies had successfully processed Tempe juice and fresh Tempe into TDP product15–17. The Formula of fresh Tempe-based TDP has been commercially traded and patented18. However, commercial TDP from the patented formula has a large serving size to achieve the desired protein content and does not have good physical characteristics, thus, it is least preferred by the consumers. Consequently, commercial TDP formula still needs to be improved in terms of its physical and chemical characteristic aspects.
In this study, the TDP was made with Tempe flour as the key ingredient. Tempe flour had high calcium bioavailability and was even similar to casein, a protein found in milk, suggesting it has the potential to be used as an alternative calcium source aside from animal products like as dairy products13. Tempe flour is also able to increase estrogen serum better than tofu flour, casein and estradiol, so it has the potential to reduce the risk of cardiovascular disease12. Therefore, Tempe flour can be further processed into a functional beverage.
Mixture design or mixture experiment (ME) is commonly used to design a formula optimization experiment since it saves time, cost and energy. ME is an experiment design method that is used to combine several ingredients composition to produce a final product with desired characteristics19. The utilization of ME for optimization of TDP formula was expected to obtain the most optimum TDP formula with improved physical and chemical characteristics compared with the commercial TDP and other similar commercial products
Materials and Methods
Material
The main ingredient used for this study was fresh Tempe made from soybean obtained from Rumah Tempe Indonesia (RTI), located in Cilendek, Bogor. Other ingredients consisted of guar gum, maltodextrin (DE value of 10 – 12), low-calorie sweetener (combination of sorbitol, erythritol and steviol glycoside) and vanilla identical flavor which were purchased from online marketplace at Zeelandia official store.
Tempe flour production
Tempe was initially sliced to a thickness less than 0.5 cm using a slicer (Geprufte Sicherheit, Alexanderwerk Inc., Mongomeryville, Pennsylvannia). Then, the Tempe was steam blanched using steamer (Armfield® UOP 10) at 100oC for 10 minutes. Then, the Tempe was dried using a fluidized bed dryer at 43 ± 1oC for 4 hours. The dried Tempe was milled using pin disc mill (Alecanderwek Inc., Germany) and sieved using 100-mesh sieve20.
Optimum TDP formula production
The additive ingredients such as sugar, maltodextrin, guar gum and flavor were mixed together using mixer. The mixture was added with Tempe flour gradually until all components were mixed homogenously16. The compositional formula based on design of experiment (DOE) is presented in Table 1. The optimum formula was estimated by the highest desirability graph (Figure 2). The optimization process resulted in optimum TDP formula which was compared with the commercial TDP18. In addition, the optimum formula would also be compared with soy drink powder product with observed chemical parameters namely antioxidants, isoflavones and GABA.
Table 1: Compositional formula based on experimental design
| Run | Formula | ||
| Tempe flour(%) (w/w) | Maltodextrin(%) (w/w) | Guar gum(%) (w/w) | |
| 1 | 75 | 15 | 0 |
| 2 | 75 | 15 | 0 |
| 3 | 77 | 10 | 3 |
| 4 | 77 | 10 | 3 |
| 5 | 70 | 20 | 0 |
| 6 | 78.5 | 10 | 1.5 |
| 7 | 70 | 18.5 | 1.5 |
| 8 | 70 | 20 | 0 |
| 9 | 70 | 17 | 3 |
| 10 | 80 | 10 | 0 |
| 11 | 73.5 | 13.5 | 3 |
| 12 | 72.125 | 17.125 | 0.75 |
| 13 | 76.375 | 12.125 | 1.5 |
| 14 | 72.125 | 15.625 | 2.25 |
| 15 | 80 | 10 | 0 |
| 16 | 70 | 17 | 3 |
Viscosity
The viscosity analysis was done using Viscometer instrument (Brookfield, Model LVT, Brookfield Engineering Laboratory, Middleborough, Massachusetts). Sample of one-time serving (20 g) was added with distilled water at room temperature in accordance with the serving suggestion (200 mL). The sample was poured in a glass and then spindle size (No. 1) was chosen with rotation speed of 60 rpm at 25oC to obtain the sample viscosity which stated in cP (centipoise) unit21.
Water solubility index (WSI)
Powder sample of 1 g was weighed and added with 25 mL of distilled water at room temperature. The mixture was homogenized using a homogenizer (Armfield L4R) for 5 minutes. Then, the solution was centrifuged at 760 x g speed for 10 minutes. Then, 20 mL of supernatant was poured into a plate and dried to determine its weight. The supernatant was dried on a plate in an oven at 105oC for 5 hours and weighed every 2 hours to ensure a constant weight of the supernatant. WSI is calculated as g/100 g percentage22.
Sedimentation index (SI)
The determination of SI value was done by diluting 10 g of powder sample into 100 mL distilled water in 100 mL measuring glass, then the sedimentation height declining was observed for 30 minutes. SI (%) is calculated based on the ratio between transparent volume against total volume23.
Water absorption index (WAI)
One g of powdered sample was weighed and put into centrifuge tube filled with 15 mL of distilled water and vortexed until homogenized. The sample was centrifuged at 3000 rpm for 10 minutes (BECKMAN, J2-MC, Minnesota, rotor JA-14) at 21oC. The supernatant liquid was separated from the mixture and the residue was weighed. WAI is calculated as g/g22.
Proximate, dietary fiber and crude fiber
The proximate, dietary fiber and crude fiber analysis referred to AOAC procedure24, which consisted of water content, ash content with gravimetry method, fat content with Soxhlet method, protein content with Kjeldahl method and carbohydrate content was determined using by difference method. The dietary fiber was analyzed using enzymatic method while crude fiber was analyzed using acid-base digestion method
Antioxidant activity, isoflavone aglycones content and GABA
The tested sample of 0.1 mL was added with 3.9 mL DPPH (0.075 mM) in methanol then waited for 30 minutes for the reaction to occur. The absorbance was measured at 517 nm wavelength using UV-Vis spectrophotometer GenesysTM 150 (Thermo Fisher Scientific, Waltham, MA, USA). The standard curve was prepared in respective concentrations of 10, 25, 50, 75 and 100 μg/mL. The obtained antioxidant activity is equivalent to ascorbic acid activity as DPPH radical scavenger25.
The extraction of isoflavone sample was started by adding 6 mL of HCL 1 M and 24 mL acetonitrile into 2 g sample. The sample was centrifuged at 3500 rpm speed for 10 minutes. Supernatant of 20 mL was injected into C-18 15 cm ´ 4.6 mm i.d., 5 mm (LiChrospher, Merck Millipore, USA) column. The utilized mobile phase was methanol: ammonium acetate 1mM with the ratio of 6:4 and rate of 1 mL/minute. The detector used for the analysis was UV Detector at 265 nm wavelength26. Data was collected using a HPLC Agilent UV-Vis VWD.
Sample of 1 g was inserted into centrifuge tube, added with 5 mL of distilled water and vortexed. The sample was put into a shaker at 200 rpm speed for 1 hour. Next, the sample was centrifuged for 30 minutes at 3000 rpm speed at 4oC. The supernatant was strained using 0.45 mikron nylon filter paper. Sample filtrate of 0.5 mL was reacted with 0.2 mL borate buffer (pH 9.0) and 1 mL of phenol 6% (b/v). The mixture was vortexed and cooled for 5 minutes before being heated in a water bath at 95 ± 1oC for 10 minutes. Then, 0.5 mL of 60% (v/v) ethanol was added into the mixture and vortexed. The absorbance was measured at 645 nm wavelength using UV-Vis spectrophotometer GenesysTM 150 (Thermo Fisher Scientific, Waltham, MA, USA). The GABA standard curve was made at concentration range of 0 – 300 ppm27.
Heavy metals contaminant analysis
The analysis of heavy metal Cadmium (Cd), lead (Pb), Tin (Sn), Mercury (Hg) and Arsen (As) were done with inductively coupled plasma-mass spectrometry (ICP-MS) (Thermoscientific iCAP RQ)28. One g of sample was reacted with 0.5 mL hydrogen peroxide 30% (v/v) and 4 mL nitric acid 65% (v/v) inside the PTFE vessels. The vessels were put in microwave for 15 minutes when the temperature was increased to 120oC and then left at constant temperature for 10 minutes. Then, the temperature was raised to 160oC for 20 minutes and then rested for 15 minutes. Then, the vessels were cooled at 22oC for 30 minutes. The mixture was diluted with 50 mL of deionized water and ready to be injected.
Colour and degree of whiteness analysis
The equipment used for the analysis was chromameter (Konica Minolta CR-310). The obtained data from the color measurement consisted of L*, a* and b* value29. The measurement of whiteness degree was done using whiteness meter device (Kett C-130)30.
Total dissolved solid, bulk density and water activity (aw)
The total dissolved solid analysis procedure was performed by using hand refractometer (ATAGO Model N-3E, Japan) and stated in oBrix31. The bulk density was calculated based on comparison between sample weight against its volume in g/mL32. Water activity (aw) analysis was done by using Shibaura aw meter WA-360 (Fukushima Shibaura Electronics co., Ltd.)31.
Microbiology analysis
Total plate count analysis was performed in accordance with Indonesian National Standard (SNI 4833-1:2015), which calls for sample homogenization with buffered peptone water solution. The sample was then diluted and cultured on acidified potato dextrose agar media in a petri dish. After three days of incubation at 25-26°C, the mold colonies formed mycelia-filled rings.
Total molds analysis was performed in accordance with Indonesian National Standard (SNI 4833-1:2015). Potato dextrose agar (PDA) media was weighed up and diluted in distilled water before being heated until dissolved. For 15 min, the media solution was sterilized. Acidified potatoe dextrose agar (APDA) medium was made by adding 10% of tartaric acid to the media and homogenized with buffered peptone water (BPW). The solution was serially diluted in BPW at 1:9 (b:v) ratio before being grown in a petri dish with 1 mL of each solution. The plates were incubated for 2-3 days at 25-26oC
Data analysis
The TDP formula was optimized using the Mixture Design Method and d-optimal optimized design in Stat-Ease Design Expert 12 (DX12) software. The response results were inputted into DX12 software and analyzed using ANOVA and a mathematical model. DX 12 software will offer a variety of mathematical models based on the conditions of the response test results. The physical, chemical, and microbiology properties were analyzed by ANOVA and differences between means by Duncan test using SPSS (Ver 25, Chicago, IL). Significance was considered at the level of 5%.
Results and discussion
Analysis of Response Optimization
The upper and lower limit is used in optimization process based on the results of literature studies and trials DX 12 software is designed to do experiments that obtained results of 16 runs. The measurement result of the TDP formula optimization response (Table 2) showed that the range of viscosity response of the TDP product ranged between 6 to 46.5 cP, SI value ranged between 4.96 to 14.9%, WAI value between 2.29 to 4.01 g/g and WSI value ranged between 6.56 – 10.78%. The summary of ANOVA analysis result for each optimization response can be seen in Table 3 and 3D optimization response curve is presented in Figure 1.
Table 2: The results of the response measurement of various optimization treatments of Tempe flour, maltodextrin and guar gum.
| Run | Results | |||
| Viscosity(cP) | SI(%) | WAI(g/g) | WSI(%) | |
| 1 | 7.5 | 14.20 | 2.49 | 8.81 |
| 2 | 7.5 | 13.59 | 2.50 | 8.62 |
| 3 | 46.5 | 6.60 | 4.01 | 6.73 |
| 4 | 46 | 6.75 | 3.81 | 6.56 |
| 5 | 6 | 12.90 | 2.29 | 10.78 |
| 6 | 27 | 10.50 | 2.96 | 7.32 |
| 7 | 25 | 8.88 | 2.64 | 9.93 |
| 8 | 9 | 13.16 | 2.35 | 10.67 |
| 9 | 42 | 5.37 | 3.45 | 9.32 |
| 10 | 12 | 14.70 | 2.60 | 6.72 |
| 11 | 40 | 6.52 | 3.40 | 8.52 |
| 12 | 19 | 11.92 | 2.43 | 9.54 |
| 13 | 30 | 10.30 | 2.61 | 8.27 |
| 14 | 36 | 7.59 | 2.75 | 9.78 |
| 15 | 8 | 14.90 | 2.56 | 6.72 |
| 16 | 42 | 4.96 | 3.45 | 9.32 |
Notes: SI = Sedimentation index, WAI = Water adsorption index, WSI = Water solubility index
Based on the analysis of variance, the chosen model for viscosity and SI responses were linear, WSI was cubic and WAI was special cubic (Figure 1). The chosen model for overall responses had significant value lower than 0.05, which means that all models were significant to the chosen response and model, as well as had an error probability less than 5%. All responses also had no insignificant Lack of fit values (p>0.05). The non-significant Lack of fit value showed that the chosen model is a model which possesses the suitability of good response data and is not significant to model inaccuracy.
Table 3: Analysis of variance (ANOVA) result on the experiment responses.
| Responses | Model | Significant(p<0.05) | Lack of fit (p>0,05) | R2 | Adj. R2 | Pred. R2 | Adeq. Precision |
| Viscosity (cP) | Linear | <0.0001 | 0.2376 | 0.9854 | 0.9832 | 0.9783 | 43.5658 |
| SI (%) | Linear | <0.0001 | 0.4102 | 0.9945 | 0.9937 | 0.9921 | 77.9710 |
| WSI (%) | Cubic | <0.0001 | 0.5297 | 0.9986 | 0.9966 | 0.9984 | 61.7044 |
| WAI (g/g) | Special cubic | <0.0001 | 0.4463 | 0.9901 | 0.9835 | 0.9651 | 33.6111 |
Notes: SI = Sedimentation index, WAI = Water adsorption index, WSI = Water solubility index
Water Solubility Index (WSI) Response Analysis
WSI parameter in drink powder product is a crucial indicator because it affects the consumer perception, especially when dissolving the drink powder. There are several factors that affects WSI value, namely the composition of easily soluble ingredients, the concentration of food additives and processing condition33–35. The criteria of an acceptable powder product are easy to absorb water, drown and dissolved in water, compared to floating and prone to coagulate drink powder product36.
The chosen model for WSI analysis response was cubic model. The model had Lack of fit value of 0.5297 and R2 value of 0.9986 (Table 3). The equation for interpretation WSI response is as follows:
WSI (%)=6.72 A+10.72 B-162.7 C+0.0126 AB+291.52 AC+298.44 BC-252.61 ABC-1.27 AB(A-B)-124.67 AC(A-C)-143.51 BC(B-C)
The product WSI value for TDP ranged from 6.56 to 10.78% (Table 2). The value indicates that the TDP was easily soluble in water. The value was lower compared with TDP product (fresh Tempe based formula)16, yacon juice powder37 and pomegranate juice powder34. The equation shows that WSI response was affected by the concentration of Tempe flour (A), maltodextrin (B), guar gum (C) and the interaction of all three factors (ABC). The increase in WSI value was affected by Tempe flour concentration and maltodextrin due to the positive coefficient value. On the contrary, the decline of WSI value was affected by guar gum concentration due to the negative coefficient value. Based on the equation, it is shown that TDP made with higher Tempe flour and maltodextrin had higher WSI value. The WSI value was affected by the high carbohydrate and protein content as well as the low content of hydrophobic compounds in the product37,38. The macromolecule components interact with each other and form complexes such as amylose-lipid and protein-starch which will affect the WSI value35. The addition of too many hydrocolloid ingredients (such as guar gum) can result in lower product solubility since it will interfere the interaction between water and carbohydrate polymer chain39.
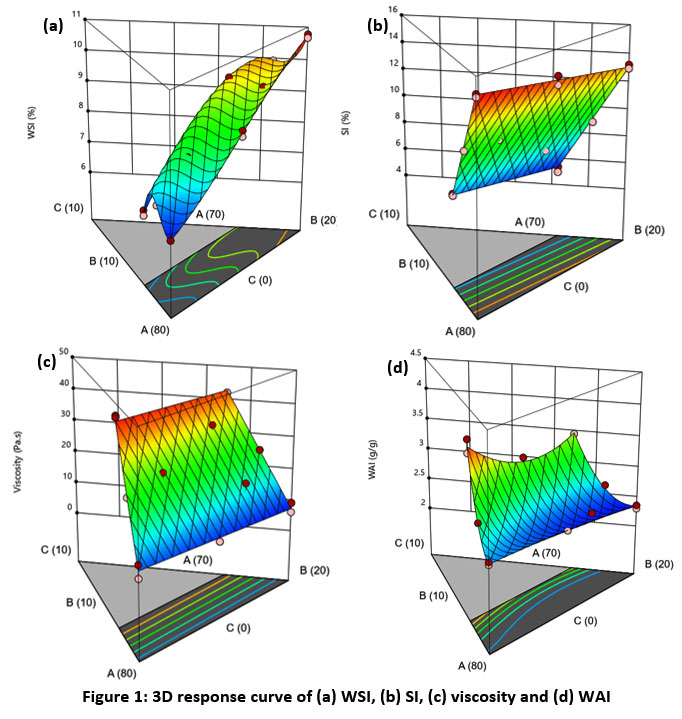 |
Figure 1: 3D response curve of (a) WSI, (b) SI, (c) viscosity and (d) WAI. |
Sedimentation Index (SI) Response Analysis
The SI value indicates the stability of dispersion system of a certain mixture. The SI value would affect consumer acceptance since SI value affect the appearance of the beverage product40. The product is considered stable when it has low SI value, because it cannot easily form sedimentation after being diluted in water41,42. Several factors which affect the SI value of a product are particle size, stabilizer concentration and ratio of particle and its solvent40,43.
The chosen model for SI response analysis was linear model. The model had Lack of fit value of 0.4102 and R2 value of 0.9945 (Table 3). The equation used to interpret SI response is as follows:
SI (%)=14.83 A+12.99 B-12.48 C
The SI value estimation in TDP product ranged from 4.96 to 14.9% (Table 2). The SI value was considered as sufficiently high compared to chocolate beverage with hydrocolloid40,41. The obtained equation shows that SI response was affected by Tempe flour (A), maltodextrin (B) and guar gum (C). The increase in SI value is heavily affected by several factors, namely Tempe flour concentration and maltodextrin due to the positive coefficient. Meanwhile, SI value decline is affected by guar gum concentration due to the negative coefficient. Based on the equation, it is shown that TDP which contains lower Tempe flour and maltodextrin as well as higher guar gum will lower the SI value, which makes the product more stable. Guar gum is considered to be able in preventing sedimentation and maintaining the texture of the beverage44,45. The presence of stabilizer such as guar gum can form stable structure that can retain the dispersion system due to its capability in ensnaring particles into the matrix46.
Viscosity Response Analysis
Viscosity is an important parameter because it indicates texture or mouthfeel of a certain beverage product, which in the end affects consumer acceptance47,48. Viscosity occurs due to the interaction between the dispersing phase and the dispersed solids within the product. Viscosity has a relationship with SI value, where the higher the viscosity value, the more stable the dispersed system within the product. Several factors that affect the viscosity of a product, such as the concentration of the stabilizer and the ratio between the particles and its solvent40,43.
The chosen model to be analyzed for viscosity response was linear model. The model had lack of fit value of 0.2376 and R2 value of 0.9854 (Table 3). The equation used to interpret the viscosity response is as follows:
Viscosity (cP)=10.52 A+7.20 B+125.51 C
The estimation of TDP viscosity value ranged between 6 to 46.5 cP (Table 2). The value showed that the TDP was a viscous beverage. The result is similar to protein-based beverage added with carrageenan as a thickener49 and chocolate beverage which was added with xanthan gum41. Based on the equation, it is shown that viscosity response is influenced by Tempe flour (A) concentration variation, maltodextrin (B) and guar gum (C). The increase in viscosity was also influenced by factors such as Tempe flour concentration, maltodextrin and guar gum since it had positive coefficient. Guar gum has pseudoplastic properties which can increase the product viscosity when added in low concentration50. Several hydrocolloids have a synergistic effect, such as interaction between guar gum and other polysaccharides which could increase viscosity and gel power51,52. Guar gum is able to increase the viscosity by forming a strong hydrogen bond with its polar solvent53. Galactomannan in guar gum binds water, which results in gel formation and viscosity increase. The viscosity decreases when the galactomannan is decomposed by being heated up to 90oC or the pH lowered to below 3.553.
Water Absorption Index (WAI) Response Analysis
WAI parameter shows the capability of a material to absorb water. Materials with high WAI tend to be easily dispersed in water. WAI parameter can also be used to observe hydrophilicity and gelation capacity from macromolecules, such as starch and protein in flour as well as determining the volume capacity of starch that can be occupied by water that can show the hydration ability of certain materials35,54
The chosen model for WAI response analysis was special cubic model. The model had lack of fit value of 0.4463 and R2 value of 0.9901 (Table 3). The equation used to interpret the WAI response is as follows:
WAI (g⁄g)=2.57 A+2.34 B+15.99 C+0.1735 AB-12.8 AC-14.13 BC-10.04 ABC
The estimation of WAI value for TDP was from 2.29 to 4.01 g/g (Table 2) which indicates good rehydration capability. The value was higher compared to TDP (fresh Tempe based formula)16 similar with the WAI value of goldenberry powder55. Based on the equation, WAI response was affected by the Tempe flour (A) concentration, maltodextrin (B), guar gum (C) and interaction between all of the factors (ABC) which was shown by the positive coefficient value. It can be said that TDP made from higher percentage of Tempe flour, maltodextrin and guar gum will increase the WAI value. The ability of Tempe flour, maltodextrin and guar gum in increasing the WAI value was caused by the presence of hydrophilic molecules and the high content of soluble fiber that is able to strongly bind water55.Guar gum contains a large polysaccharide in the form of galactomannan, at least 75%. . Guar gum has a high content of galactomannan, which is at least 75%. The galactomannan has roles in binding water due to having many hydrophilic groups. Protein is one of the most important molecules which can increase WAI value do the hydrophilic unit it possesses56,57.
TDP formula optimization
The optimization step was done to obtain the best variables of TDP formula by optimizing the analyzed responses. Desirability value is a function to achieve the desired result based on the existing variable criteria. The desirability value shows the degree of accuracy of the optimum solution58. Response is considered to be optimum when the desirability value is close to 1. The variable goal criteria of Tempe flour, maltodextrin and guar gum were in range with interest scale of 3 (+++). The criteria goal for viscosity, SI, WSI and WAI each were in respective targeted (20 cP), targeted (9.93%), in range and in range. The interest scale for each response variable was 3 (+++).
The optimization result was one optimum formula with the highest desirability value of 0.943. The 3D desirability curve can be seen in Figure 2. The obtained optimum formula was 70% Tempe flour, 18.23% maltodextrin and 1.77% guar gum. The optimum formula was verified to observe the model capability in predicting the optimum value. The study is considered to be verified if the response testing results are in Confident Interval (CI) value of 95% and Prediction Interval (PI) value of 95%.
The verification result (Table 4) showed that all formula responses were in range with 95% CI value and 95% PI value. The result showed that the formula had the suitable response testing result with the recommended prediction by the verified software and formula. The optimum formula of Tempe flour, maltodextrin and guar gum is able to produce TDP with sufficiently consistent viscosity, SI, WAI and WSI values.
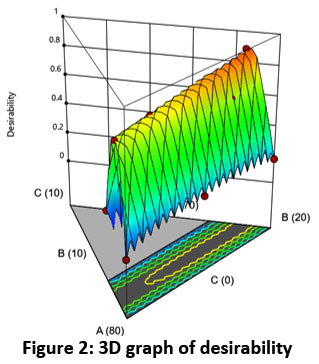 |
Figure 2: 3D graph of desirability |
Table 4: Verification of the optimum formula
| Variable | Prediction value | Verification value | 95% CI | 95% PI | ||
| Low | High | Low | High | |||
| WSI (g/100g) | 9.90 | 9.70 | 9.70 | 10.11 | 9.67 | 10.15 |
| SI (%) | 9.93 | 10.18 | 9.69 | 10.17 | 9.51 | 10.36 |
| Viscosity (cP) | 21.42 | 19.83 | 19.71 | 23.13 | 18.39 | 24.45 |
| WAI (g/g) | 2.49 | 2.58 | 2.39 | 2.59 | 2.35 | 2.62 |
Notes: SI = Sedimentation index, WAI = Water adsorption index, WSI = Water solubility index
Physical, Chemical and Microbiology Analysis of TDP
Proximate, dietary fiber, crude fiber and total sugar
The proximate, dietary fiber, crude fiber and total sugar composition are presented in Table 5. The TDP with an optimum formula which fulfilled the SNI 7612:2011 criteria test based on water, ash, fat, protein and crude fiber content parameters. The analysis of water, crude fiber and total sugar did not show significant differences (p>0.05) between the optimum formula and the commercial TDP formula. The protein, ash and fat in the optimum formula were higher compared with the commercial TDP formula, respectively 42.61, 1.75 and 28.85%. The results were higher compared to TDP (fresh Tempe based formula)16 and Tempe flour17. However, the protein content of the optimum formula was lower than the Tempe beverage59. This was due to the difference in Tempe composition used in the product formulation. Reformulation was able to increase TDP protein content up to 12.33%. These result show that the optimum formula showed “higher protein” due to the optimum formula containing 40.8% higher protein than the commercial TDP formula (Table 5). “Higher protein” claims can be attained when the products have a higher protein content of at least 25% based on Indonesian FDA Regulation No. 01 the Year 2022 on regarding Supervision of Claims on Processed Food Labels and Advertisement.
The carbohydrate and dietary fiber content in the optimized formula was lower than the commercial TDP formula, with each 26.79 and 14.32%. This was due to the commercial TDP formula utilized other ingredients in higher amount such as wheat flour and maltodextrin in higher amount which increases the carbohydrate content. The result was also higher compared with other soy-based beverages such as soymilk60 and extract Tempe drink 15. The dietary fiber content of the commercial TDP formula has fulfilled the high fiber claim requirements based on Indonesian FDA Regulation No. 01 the Year 2022 regarding Supervision of Claims on Processed Food Labels and Advertisement. The dietary fiber maintains the digestive system function and prevents diabetes, obesity, cardiovascular diseases and colon-related diseases61,62. Based on the result, it can be concluded that TDP contains protein and dietary fiber sources that are beneficial for health.
Table 5: Chemical, heavy metal contamination and microbiology characteristics
| Parameter | Tempe flour | Tempe drink powder | Standard* | |
| Commercial formula | Optimum formula | |||
| Proximate (%) | ||||
| Moisture | 6.70 ± 0.04a | 6.49 ± 0.41a | 6.20 ± 0.03a | max. 10.0 |
| Ash | 1.63 ± 0.08a | 1.25 ± 0.05b | 1.75 ± 0.00a | max. 6.0 |
| Protein | 47.56 ± 0.07a | 30.22 ± 3.01b | 42.61 ± 0.13a | min. 30.0 |
| Fat | 33.53 ± 0.21a | 13.50 ± 0.49c | 28.85 ± 0.11b | min. 17.0 |
| Carbohydrate | 17.27 ± 0.26c | 55.02 ± 2.82a | 26.79 ± 0.05b | – |
| Dietary fiber | 15.34 ± 0.14b | 19.57 ± 0.71a | 14.32 ± 0.15b | – |
| Crude fiber | 1.13 ± 0.16b | 3.04 ± 0.15a | 1.60 ± 0.13a | max. 3.0 |
| Total sugars | ND | 8.70 ± 0.11a | 7.83 ± 2.48a | – |
| Minerals (mg/kg) | ||||
| Cd | ND | ND | ND | max. 0.2 |
| Pb | ND | ND | ND | max. 0.25 |
| Sn | ND | ND | ND | max. 40 |
| Hg | ND | ND | ND | max. 0.03 |
| As | ND | ND | ND | max. 0.25 |
| Microbiology (CFU/g) | ||||
| Total mold count | 1.6 x 10³ ± 0.07 | < 10 | < 10 | max. 5 x 101 |
| Total plate count | 1.45 x 10⁵ ± 0.07 | 4.80 x 10³ ± 0.42 | 6.90 x 10³ ± 0.14 | max. 5 x 10⁴ |
Mean on the same row followed by different letters show significant differences (p<0.05)
Note: ND = Not detected, * = Indonesian National Standard (SNI 7612:2011) regarding soy drink powder
Mineral Characteristic
Several minerals are harmful to health due to their toxicity, such as Pb, As, Hg, Sn and Cd. In Table 5, it is shown that the commercial TDP formula and optimum formula, there were no heavy metals contamination detected in the product, which fulfills the SNI 7612:2011 testing criteria requirements. The SNI requires heavy meatal threshold of soy drink powder are respectively 0.2, 0.25, 40, 0.03 and 0.25 mg/kg. The heavy metal contamination is included into the critical testing criteria due to its toxicity and can be accumulated in the human body through the bioaccumulation mechanism63. In addition, several heavy metals such as Cd, Pb and Hg are highly toxic even in extremely low concentration64–66. TDP also fulfills the heavy metal contamination requirements by CODEX STAN 175-1989 for protein product produced from soybean. Therefore, TDP is a safe product for consumption.
Microbiology characteristics
The optimum formula had total plate count and mold total count of each <10 and 6.90 x 10³ colony/g. The result was below the threshold of microbiology characteristics based on SNI 7612:2011, thus fulfills the requirements. The Indonesian National Standard set a limit for total plate count and total mold count, respectively 5.0 x 10⁴ dan 5.0 x 101 colony/g. The growth of mold on TDP was caused by many factors, including Tempe fermentation which involves Rhizopus spp. mold. The TDP has fulfilled the microbiology contamination based on CODEX STAN 175-1989, namely free from microorganism that are harmful for health. Therefore, TDP is a product that is safe for consumption.
Physical properties
The physical properties comparison between the optimum formula and the commercial TDP formula can be seen in Table 6. Water activity (aw) of the commercial TDP formula and optimum formula were on 0.23-0.24 range. The value is considered to be within the safe zone for drink powder product in preventing the growth of microorganisms. The water activity level that limits the growth of all microorganisms is 0.60 aw67.
On the total soluble solid parameter, the commercial TDP formula and optimum formula each had 5.25 and 7.02 oBrix. The result was higher compared to TDP (fresh Tempe based formula)16. The differences were affected by the variation of filler concentration, stabilizer and sugar which were added into the drink formula. Product with higher total soluble solids is better due to the high concentration of water-soluble solids68.
In Table 6, the optimum TDP formula had lower bulk density (0.43) compared with the commercial TDP formula (0.59). The lower bulk density in optimum TDP formula was due to the addition of maltodextrin. Maltodextrin is considered a skin-forming material, and employing it as a food additive might cause air collection and trapping inside the particles, causing it to become less dense and porous36. The drying method utilized in this study also contributes to the bulk density difference, namely fludized bed drying method. The low temperature used in fluidized bed drying method made the particles less compact and stiff, otherwise, the high temperature used in commercial TDP, namely oven drying method, may have caused collapse which resulted in more compact and rigid products. These characteristics resulted in higher bulk density68. The high bulk density is highly favorable in powdered product due to the narrow space between molecules, which could increase the cohesivity between particles. Low bulk density causes the water vapor to easily enter the product and accelerate the coagulation and damage on the product. The result was higher compared with TDP (fresh Tempe based formula)16 and lower compared to spray-dried soy beverage32.
The commercial TDP formula had a higher viscosity value (32.17 cP) compared with the optimum formula (18.67 cP). Higher viscosity value will increase the SI. In Table 6, the commercial TDP formula had lower SI value (5.56%) compared with the optimum formula (10.18%). This is in accordance with study before which mentioned that product with high viscosity tends to have a more stable dispersion system40,43. There are several factors that affects viscosity and SI value, namely stabilizer concentration and size of dispersed particles in suspension.
The commercial TDP formula had a higher WAI value (2.82 g/g) compared with the optimum formula (2.58 g/g). On the contrary, the commercial TDP formula with lower WSI value (7.06%) than the optimum formula (9.70%). The commercial TDP formula had higher WAI compared with the optimum formula due to the higher hydrocolloid concentration. The hydrocolloid is a hydrophilic molecule and considered as a water-soluble fiber which has the ability to bind water55. However, excessive amount of hydrocolloid component will result in lower solubility in water because it interferes the interaction between water and carbohydrate polymer chain39.
Table 6: Physical properties
| Parameter | Tempe drink powder | |
| Commercial formula | Optimum formula | |
| aw | 0.23 ± 0.00a | 0.24 ± 0.00a |
| Total soluble solid (oBrix) | 5.25 ± 0.28b | 7.02 ± 0.05a |
| Bulk density (g/mL) | 0.59 ± 0.01a | 0.43 ± 0.00b |
| Viscosity (cP) | 32.17 ± 0.76a | 18.67 ± 0.76b |
| SI (%) | 5.56 ± 0.29b | 10.18 ± 0.55a |
| WAI (g/g) | 2.82 ± 0.31a | 2.58 ± 0.36b |
| WSI (%) | 7.06 ± 0.53b | 9.70 ± 0.18a |
Mean on the same row followed by different letters show significant differences (p<0.05)
Table 7: Color characteristics
| Parameter | Tempe drink powder | |
| Commercial formula | Optimum formula | |
| L* | 79.71 ± 0.10b | 82.69 ± 0.01a |
| a* | -1.60 ± 0.23a | -1.56 ± 0.12a |
| b* | 19.17 ± 0.35a | 19.84 ± 0.74a |
|
Degree of whiteness |
52.30 ± 0.21b |
55.95 ± 0.14a |
Mean on the same row followed by different letters show significant differences (p<0.05)
The colour parameter is an important parameter in a product since it determines the purchasing decision as well as consumer acceptance. In Table 7, it is shown that there are differences in L* value and degree of whiteness between the optimum formula and the commercial TDP formula. Otherwise, the a* and b* value did not show significant differences (p>0.05) between the optimum formula and the commercial TDP formula. The optimum formula had higher L* value and degree of whiteness, respectively 82.69 and 55.95. The result was comparably higher than soy drink powder68. The optimum TDP formula was dried at 43oC to prevent browning on the flour. The addition of maltodextrin into the formula also resulted in brightness increase of the product38.
Potential of TDP for health
According to epidemiological study, consuming Tempe drink powder three glasses every day for four weeks consecutively will improve health and reduce disease risk, such as hypercholesterol8, hypertension9 and diabetes10,11. TDP contains various bioactive compounds which have the ability to maintain health, such as isoflavones, GABA and its antioxidant activity. In Table 8, it is shown that the fermentation process, formulation difference and TDP production method affect significantly on isoflavones content, GABA and antioxidant activity. The optimum formula has total isoflavones (daidzein and genistein), GABA content and antioxidant activity respectively 188.24 mg/100g, 21.24 mg/g and 58.36 mg AEAC/100g. The obtained total isoflavones were higher if compared to the commercial TDP formula, soy drink powder and Tempe powder11,69,70. There is an effect of fermentation of soybean to the increase of isoflavone aglycon on the Tempe drink. The soybean fermentation is able to increase the total isoflavones aglycon as well as to decrease the anti-nutrition compounds, which can increase the isoflavones bioavailability71. The fermentation process can hydrolyze the glycoside bond of the isoflavone glucoside (daidzine, glycitine and genistine) into its aglycon form (daidzein, glycytein and genistein) due to the activity of β-glycosidase72. Isoflavone in its aglycon form is easily absorbed by the human body and also has bioactive properties, such as being capable of reducing the development of cancer cells and averting free radicals73,74.
The combination of GABA in the optimum TDP formula is higher compared with the commercial TDP formula and soybean drink powder. The result was higher compared to fresh Tempe product75,76. The type of culture used for the fermentation process affects the resulted GABA content, therefore each fermented product has different GABA content77. GABA content in fermented product has been studied to have antioxidant activity and inhibition of angiotensin-converting enzyme (ACE)78–80.
The increase of antioxidant activity in TDP was also influenced by the high isoflavone compound (phenol) and GABA since it has the ability in averting free radicals. The antioxidant activity of optimum TDP formula was higher compared with the commercial TDP formula. The higher the Tempe composition in the drink formula, the higher the antioxidant activity, since Tempe contains various phytochemical compounds which are able to tackle free radicals, such as bioactive peptides, phenolic (isoflavones), saponins and vitamin E11,70,81,82. The antioxidant activity in Tempe drink is also higher compared with soy drink due to the fermentation process from Tempe production that could release the phenolic compound and produce peptides fraction with low molecular weight (less than 1 kDa), which has high antioxidant activity83,84.
Table 8: Antioxidant activity, isoflavones and GABA content
| Parameter | Tempe flour | Tempe drink powder | Soy drink powder | |
| Commercial formula | Optimum formula | |||
| Antioxidant activity (mg AEAC/100 g) | 65.50 ± 0.51a | 28.60 ± 1.18c | 58.36 ± 0.51b | 20.50 ± 1.85d |
| Daidzein isoflavone (mg/100g) | 52.46 ± 0.08a | 29.24 ± 0.05ab | 48.18 ± 0.00a | 5.11 ± 0.00c |
| Genistein isoflavone (mg/100g) | 140.21 ± 0.08a | 77.98 ± 0.05ab | 140.06 ± 0.00a | 11.92 ± 0.00c |
|
GABA (mg/g) |
24.63 ± 0.29a | 10.84 ± 0.16c | 21.24 ± 0.56b |
2.12 ± 0.07d |
Mean on the same row followed by different letters show significant differences (p<0.05)
Conclusion
The formula optimization on tempe drink powder using mixture experiment (ME) established the effect of tempe flour, maltodextrin and guar gum concentration on viscosity, SI, WSI and WAI value. The optimum TDP formula was 70% Tempe flour, 18.23% maltodextrin and 1.77% guar gum, as determined by the ME method. The optimum formula was demonstrated to be capable of improve the physical properties of the commercial TDP formula, specifically for the viscosity and WSI value. The optimum formula had a higher protein content, antioxidant capacity, total isoflavones and GABA content, and it has the potential to be further developed as a functional drink. The optimum TDP formula also fulfilled the quality requirements in accordance with the Indonesian National Standard (SNI 7612:2011) regarding soy drink powder on chemical, heavy metal contamination and microbiology parameters.
Acknowledgment
The authors gratefully acknowledge the Directorate General of Higher Education, Research, and Technology; Ministry of Education, Culture, Research, and Technology of the Republic of Indonesia.
Conflict of Interest
The authors declare no conflict of interest.
Funding Sources
The Directorate General of Higher Education, Research, and Technology; Ministry of Education, Culture, Research, and Technology of the Republic of Indonesia for supporting this research through the schemes of Matching Fund 2022 Kedaireka” scheme with grant numbers 15368/IT3.L2/HK.07.00/P/T/2022, under Made Astawan
References
- Astawan M., Wresdiyati T., Maknun L. Tempe Sumber Zat Gizi dan Komponen Bioaktif untuk Kesehatan. Bogor: IPB Press; 2017.
- Zhang Y. T., Lu D. D., Chen J. Y., Yu B., Liang J. B., Mi J. D., Candyrine S. C. L., Liao X. D. Effects of fermented soybean meal on carbon and nitrogen metabolisms in large intestine of piglets. animal. 2018;12(10):2056-2064. doi:10.1017/S1751731118000058
- Ketnawa S., Ogawa Y. Evaluation of protein digestibility of fermented soybeans and changes in biochemical characteristics of digested fractions. Journal of Functional Foods. 2019;52:640-647. doi:10.1016/j.jff.2018.11.046
- Lai L. R., Hsieh S. C., Huang H. Y., Chou C. C. Effect of lactic fermentation on the total phenolic, saponin and phytic acid contents as well as anti-colon cancer cell proliferation activity of soymilk. Journal of Bioscience and Bioengineering. 2013;115(5):552-556. doi:10.1016/j.jbiosc.2012.11.022
- Romulo A., Surya R. Tempe: A traditional fermented food of Indonesia and its health benefits. International Journal of Gastronomy and Food Science. 2021;26:100413. doi:10.1016/j.ijgfs.2021.100413
- Mo H., Kariluoto S., Piironen V., Zhu Y., Sanders M. G., Vincken J. P., Rooijackers J. W., Nout M. J. R. Effect of soybean processing on content and bioaccessibility of folate, vitamin B12 and isoflavones in tofu and tempe. Food Chemistry. 2013;141(3):2418-2425. doi:10.1016/j.foodchem.2013.05.017
- Kustyawati M. E., Subeki, Murhadi, Rizal S. Vitamin B12 production in soybean fermentation for tempeh. AIMSAGRI. 2020;5(2):262-271. doi:10.3934/agrfood.2020.2.262
- Wirawanti I. W., Hardinsyah H., Briawan D., Astawan M. Efek intervensi minuman tempe terhadap penurunan kadar low density lipoprotein. Indonesian Journal of Nutrition and Food. 2017;12(1):9-16. doi:10.25182/jgp.2017.12.1.9-16
- Ansarullah A., Hardinsyah H., Marliyati S. A., Astawan M. Efek intervensi minuman tempe terhadap tekanan darah penderita hipertensi dan hiperkolesterolemia. Indonesian Journal of Nutrition and Food. 2017;12(2):101-108. doi:10.25182/jgp.2017.12.2.101-108
- Yoshari R., Astawan M., Prangdimurti E., Wresdiyati T., Putri S. P. Pengaruh konsumsi tempe dari kedelai germinasi dan non-germinasi terhadap profil darah tikus diabetes. Jurnal Pangan. 2019;28(2):135-144. doi:10.33964/jp.v28i2.439
- Astawan M., Rahmawati I. S., Cahyani A. P., Wresdiyati T., Putri S. P., Fukusaki E. Comparison between the potential of tempe flour made from germinated and nongerminated soybeans in preventing diabetes mellitus. HAYATI Journal of Biosciences. 2020;27(1):16-16. doi:10.4308/hjb.27.1.16
- Kridawati A., Rahardjo T. B. W., Hardinsyah, Damanik R., Hogervorst E. Comparing the effect of tempe flour and tofu flour consumption on estrogen serum in ovariectomized rats. Heliyon. 2019;5(6):e01787. doi:10.1016/j.heliyon.2019.e01787
- Astawan M., Wresdiyati T., Subarna., Asyaifullah K. Calcium bioavailability of tempe and boiled soybean flours and its effect on osfemurs in experimental rats. Journal of Nutritional Science and Vitaminology. 2020;66(Supplement):S314-S319. doi:10.3177/jnsv.66.S314
- Wresdiyati T., Firdaus A., Astawan M. Tempe and soybean var. Grobogan-Indonesia increased the number of osteoblasts and osteocytes, inhibited osteoclast damage in the tibia bone of rats. HAYATI Journal of Biosciences. 2021;28(2):144-144. doi:10.4308/hjb.28.2.144
- Abdullah K., Asriati D. W. Karakteristik minuman sari tempe dengan penambahan rasa vanila. Warta Industri Hasil Pertanian. 2016;33(01):1-8.
- Abdurrasyid Z., Astawan M., Wresdiyati T., Nurtama B., Sirait Y. I. S. Mutu fisikokimia dan sensori minuman serbuk tempe. Jurnal Pangan. 2021;30(2):117-128.
- Bastian F., Ishak E., Tawali A. B., Bilang M. Daya terima dan kandungan zat gizi formula tepung tempe dengan penambahan semi refined carrageenan dan bubuk kakao. Jurnal Aplikasi Teknologi Pangan. 2013;2(1).
- Astawan M., Wresdiyati T., Nurtama B., Yoshari R., Nutria F. M. Formulasi dan Metode Pembuatan Minuman Serbuk Tempe sebagai Penurun Kolesterol dan Tekanan Darah. Usulan Paten P00201911467. Published online 2019.
- Jung H., Choi J., Yoon W. B. Characteristics and optimization of the formula of mashed potatoes using purple-fleshed potato (Solanum tuberosum L.) by mixture design. Food Engineering Progress. 2017;21(2):167-173.
- Puteri N. E., Astawan M., Palupi N. S., Wresdiyati T., Takagi Y. Characterization of biochemical and functional properties of water-soluble tempe flour. Food Sci Technol. 2018;38:147-153. doi:10.1590/fst.13017
- İçier F., Gündüz G. T., Yılmaz B., Memeli Z. Changes on some quality characteristics of fermented soy milk beverage with added apple juice. LWT – Food Science and Technology. 2015;63(1):57-64. doi:10.1016/j.lwt.2015.03.102
- Senanayake S., Gunaratne A., Ranaweera K., Bamunuarachchi A. Effect of heat moisture treatment conditions on swelling power and water soluble index of different cultivars of sweet potato (Ipomea batatas (l). Lam) starch. ISRN Agronomy. 2013;2013:1-4. doi:10.1155/2013/502457
- Sawale P. D., Patil G. R., Hussain S. A., Singh A. K., Singh R. R. B. Development of free and encapsulated Arjuna herb extract added vanilla chocolate dairy drink by using response surface methodology (RSM) software. Journal of Agriculture and Food Research. 2020;2:100020. doi:10.1016/j.jafr.2020.100020
- Association of Official Analytical Collaboration (AOAC). Official Method of Analysis Association of Official Analytical Chemistry. 19th Ed. The AOAC, inc; 2012.
- Donkor O. N., Stojanovska L., Ginn P., Ashton J., Vasiljevic T. Germinated grains – Sources of bioactive compounds. Food Chemistry. 2012;135(3):950-959. doi:10.1016/j.foodchem.2012.05.058
- Collison M. W. Determination of Total Soy Isoflavones in Dietary Supplements, Supplement Ingredients, and Soy Foods by High-Performance Liquid Chromatography with Ultraviolet Detection: Collaborative Study. Journal of AOAC INTERNATIONAL. 2008;91(3):489-500. doi:10.1093/jaoac/91.3.489
- Chalermchaiwat P., Jangchud K., Jangchud A., Charunuch C., Prinyawiwatkul W. Antioxidant activity, free gamma-aminobutyric acid content, selected physical properties and consumer acceptance of germinated brown rice extrudates as affected by extrusion process. LWT – Food Science and Technology. 2015;64(1):490-496. doi:10.1016/j.lwt.2015.04.066
- Kılıç Altun S., Dinç H., Paksoy N., Temamoğulları F. K., Savrunlu M. Analyses of mineral content and heavy metal of honey samples from south and east region of Turkey by using icp-ms. International Journal of Analytical Chemistry. 2017;2017:e6391454. doi:10.1155/2017/6391454
- Tilahun S., An H. S, Hwang I. G., Choi J. H., Baek M. W., Choi H. R., Park D. S., Prediction of α-solanine and α-chaconine in potato tubers from hunter color values and VIS/NIR spectra. Journal of Food Quality. 2020;2020:e8884219. doi:10.1155/2020/8884219
- Yusraini E., Hariyadi P., Kusnandar F. Preparation and partial characterization of low dextrose equivalent (DE) maltodextrin from banana starch produced by enzymatic hydrolysis. Starch – Stärke. 2013;65(3-4):312-321. doi:10.1002/star.201200080
- Rongtong B., Suwonsichon T., Ritthiruangdej P., Kasemsumran S. Determination of water activity, total soluble solids and moisture, sucrose, glucose and fructose contents in osmotically dehydrated papaya using near-infrared spectroscopy. Agriculture and Natural Resources. 2018;52(6):557-564. doi:10.1016/j.anres.2018.11.023
- Nguyen D. Q, Nguyen T. H., Mounir S., Allaf K. Effect of feed concentration and inlet air temperature on the properties of soymilk powder obtained by spray drying. Drying Technology. 2018;36(7):817-829. doi:10.1080/07373937.2017.1357040
- Mokni Ghribi A., Sila A., Maklouf Gafsi I., Blecker C., Danthine S., Attia H., Bougatef A., Besbes S. Structural, functional, and ACE inhibitory properties of water-soluble polysaccharides from chickpea flours. International Journal of Biological Macromolecules. 2015;75:276-282. doi:10.1016/j.ijbiomac.2015.01.037
- Jafari S. M., Ghalegi Ghalenoei M., Dehnad D. Influence of spray drying on water solubility index, apparent density, and anthocyanin content of pomegranate juice powder. Powder Technology. 2017;311:59-65. doi:10.1016/j.powtec.2017.01.070
- Du S. kui, Jiang H., Yu X., Jane J. lin. Physicochemical and functional properties of whole legume flour. LWT – Food Science and Technology. 2014;55(1):308-313. doi:10.1016/j.lwt.2013.06.001
- Santhalakshmy S., Don Bosco S. J., Francis S., Sabeena M. Effect of inlet temperature on physicochemical properties of spray-dried jamun fruit juice powder. Powder Technology. 2015;274:37-43. doi:10.1016/j.powtec.2015.01.016
- Franco T. S., Perussello C. A., Ellendersen L. N., Masson M. L. Effects of foam mat drying on physicochemical and microstructural properties of yacon juice powder. LWT – Food Science and Technology. 2016;66:503-513. doi:10.1016/j.lwt.2015.11.009
- Mishra P., Mishra S., Mahanta C. L. Effect of maltodextrin concentration and inlet temperature during spray drying on physicochemical and antioxidant properties of amla (Emblica officinalis) juice powder. Food and Bioproducts Processing. 2014;92(3):252-258. doi:10.1016/j.fbp.2013.08.003
- Varela M. S., Navarro A. S., Yamul D. K. Effect of hydrocolloids on the properties of wheat/potato starch mixtures. Starch – Stärke. 2016;68(7-8):753-761. doi:10.1002/star.201400257
- Muhammad D. R. A., Gonzalez C. G., Sedaghat Doost A., Van de Walle D., Van der Meeren P., Dewettinck K. Improvement of Antioxidant Activity and Physical Stability of Chocolate Beverage Using Colloidal Cinnamon Nanoparticles. Food Bioprocess Technol. 2019;12(6):976-989. doi:10.1007/s11947-019-02271-5
- Faiqoh K. E. N., Muhammad D. R. A., Praseptiangga D. Ginger-flavoured ready-to-drink cocoa beverage formulated with high and lowfat content powder: consumer preference, properties and stability. Food Res. 2021;5(S2):7-17. doi:10.26656/fr.2017.5(S2).004
- Muhammad D. R. A., Kongor J. E., Dewettinck K. Investigating the effect of different types of cocoa powder and stabilizers on suspension stability of cinnamon-cocoa drink. J Food Sci Technol. 2021;58(10):3933-3941. doi:10.1007/s13197-020-04855-y
- Luo D., Mu T. H., Sun H., Chen J. Optimization of the formula and processing of a sweet potato leaf powder-based beverage. Food Science & Nutrition. 2020;8(6):2680-2691. doi:10.1002/fsn3.1555
- Amaral T. N., Junqueira L. A., Prado M. E. T., Cirillo M. A., de Abreu L. R., Costa F. F., de Resende J. V. Blends of Pereskia aculeata Miller mucilage, guar gum, and gum Arabic added to fermented milk beverages. Food Hydrocolloids. 2018;79:331-342. doi:10.1016/j.foodhyd.2018.01.009
- Bochare S., Kshirsagar R., Sawate A., Agarkar B., Patil B. Studies on effect of guar gum as stabilizer on kiwi fruit ready to serve beverage incorporated with lemongrass. The Pharma Innovation Journal. 2020;9(3):109-111.
- Vasquez-Orejarena E., Simons C. T., Litchfield J. H., Alvarez V. B. Functional Properties of a High Protein Beverage Stabilized with Oat-β-Glucan. Journal of Food Science. 2018;83(5):1360-1365. doi:10.1111/1750-3841.14119
- Dogan M., Aslan D., Aktar T., Goksel Sarac M. A methodology to evaluate the sensory properties of instant hot chocolate beverage with different fat contents: multi-criteria decision-making techniques approach. Eur Food Res Technol. 2016;242(6):953-966. doi:10.1007/s00217-015-2602-z
- Saputro A. D., Van de Walle D., Kadivar S., Bin Sintang M. D., Van der Meeren P., Dewettinck K. Investigating the rheological, microstructural and textural properties of chocolates sweetened with palm sap-based sugar by partial replacement. Eur Food Res Technol. 2017;243(10):1729-1738. doi:10.1007/s00217-017-2877-3
- Wagoner T. B., Çakır-Fuller E., Shingleton R., Drake M., Foegeding E. A. Viscosity drives texture perception of protein beverages more than hydrocolloid type. J Texture Stud. 2020;51(1):78-91. doi:10.1111/jtxs.12471
- Mudgil D., Barak S., Khatkar B. S. Effect of enzymatic depolymerization on physicochemical and rheological properties of guar gum. Carbohydrate Polymers. 2012;90(1):224-228. doi:10.1016/j.carbpol.2012.04.070
- Abedi F., Sani A. M., Karazhiyan H. Effect of some hydrocolloids blend on viscosity and sensory properties of raspberry juice-milk. J Food Sci Technol. 2014;51(9):2246-2250. doi:10.1007/s13197-012-0705-0
- Ge H., Wu Y., Woshnak L. L., Mitmesser S. H. Effects of hydrocolloids, acids and nutrients on gelatin network in gummies. Food Hydrocolloids. 2021;113:106549. doi:10.1016/j.foodhyd.2020.106549
- Mudgil D., Barak S., Khatkar B. S. Guar gum: processing, properties and food applications—A Review. J Food Sci Technol. 2014;51(3):409-418. doi:10.1007/s13197-011-0522-x
- Yousf N., Nazir F., Salim R., Ahsan H., Sirwal A. Water solubility index and water absorption index of extruded product from rice and carrot blend. Journal of Pharmacognosy and Phytochemistry. 2017;6(6):2165-2168.
- Mokhtar S. M., Swailam H. M., Embaby H. E. S. Physicochemical properties, nutritional value and techno-functional properties of goldenberry (Physalis peruviana) waste powder concise title: Composition of goldenberry juice waste. Food Chemistry. 2018;248:1-7. doi:10.1016/j.foodchem.2017.11.117
- Marques T. R., Corrêa A. D., Lino J. B. dos R., Abreu C. M. P. de, Simão A. A. Chemical constituents and technological functional properties of acerola (Malpighia emarginata DC.) waste flour. Food Sci Technol. 2013;33(3):526-531. doi:10.1590/S0101-20612013005000085
- Tharise N., Julianti E., Nurminah E. Evaluation of physico-chemical and functional properties of composite flour from cassava, rice, potato, soybean and xanthan gum as alternative of wheat flour. International Food Research Journal. 2014;26(4):1641-1649.
- Gopalakannan S., Senthilvelan T. Optimization of machining parameters for EDM operations based on central composite design and desirability approach. J Mech Sci Technol. 2014;28(3):1045-1053. doi:10.1007/s12206-013-1180-x
- Jauhari M., Sulaeman A., Riyadi H., Ekayanti I. Pengembangan formula minuman olahraga berbasis tempe untuk pemulihan kerusakan otot. agriTECH. 2014;34(3):285-290. doi:10.22146/agritech.9456
- Giri S. K., Mangaraj S. Processing Influences on Composition and Quality Attributes of Soymilk and its Powder. Food Eng Rev. 2012;4(3):149-164. doi:10.1007/s12393-012-9053-0
- Brauchla M., Juan W., Story J., Kranz S. Sources of Dietary Fiber and the Association of Fiber Intake with Childhood Obesity Risk (in 2–18 Year Olds) and Diabetes Risk of Adolescents 12–18 Year Olds: NHANES 2003–2006. Journal of Nutrition and Metabolism. 2012;2012:e736258. doi:10.1155/2012/736258
- Kaczmarczyk M. M., Miller M. J., Freund G. G. The health benefits of dietary fiber: Beyond the usual suspects of type 2 diabetes mellitus, cardiovascular disease and colon cancer. Metabolism. 2012;61(8):1058-1066. doi:10.1016/j.metabol.2012.01.017
- Mitra S., Chakraborty A. J., Tareq A. M., Emran B. T., Nainu F., Khusro A., Idris A. M., Khandaker M. U., Osman H., Alhumaydhi F. A., Gandara J. S. Impact of heavy metals on the environment and human health: Novel therapeutic insights to counter the toxicity. Journal of King Saud University – Science. 2022;34(3):101865. doi:10.1016/j.jksus.2022.101865
- Bernhoft R. A. Cadmium toxicity and treatment. The Scientific World Journal. 2013;2013:e394652. doi:10.1155/2013/394652
- Wani A. L., Ara A., Usmani J. A. Lead toxicity: a review. Interdiscip Toxicol. 2015;8(2):55-64. doi:10.1515/intox-2015-0009
- Genchi G., Sinicropi M. S., Carocci A., Lauria G., Catalano A. Mercury exposure and heart diseases. International Journal of Environmental Research and Public Health. 2017;14(1):74. doi:10.3390/ijerph14010074
- Martins E., Cnossen D. C., Silva C. R. J., Junior J. C. C., Nero L. A., Perrone I. T., Carvalho A. F. Determination of ideal water activity and powder temperature after spray drying to reduce Lactococcus lactis cell viability loss. Journal of Dairy Science. 2019;102(7):6013-6022. doi:10.3168/jds.2019-16297
- Pourahmad R., Khorramzadeh D. Physicochemical and organoleptic properties of drinking powder containing soy milk powder, stevia, isomalt and erythritol. Journal of Food Processing and Preservation. 2016;40(6):1206-1214. doi:10.1111/jfpp.12703
- Kridawati A., Hardinsyah, Sulaeman A., Damanik R., Winarto A., Rahardjo T. B., Hogervorst E. Tempereversed effects of ovariectomy on brain function in rats: Effects of age and type of soy product. The Journal of Steroid Biochemistry and Molecular Biology. 2016;160:37-42. doi:10.1016/j.jsbmb.2015.12.016
- Astawan M., Wresdiyati T., Ichsan M. Karakteristik fisikokimia tepung tempe kecambah kedelai. Jurnal Gizi dan Pangan. 2016;11(1). doi:10.25182/jgp.2016.11.1.%p
- Li S., Jin Z., Hu D., Yang W., Yan Y., Nie X., Lin J., Zhang Q., Gai D., Ji Y., Chen X. Effect of solid-state fermentation with Lactobacillus casei on the nutritional value, isoflavones, phenolic acids and antioxidant activity of whole soybean flour. LWT. 2020;125:109264. doi:10.1016/j.lwt.2020.109264
- Piao Y. Z., Eun J. B. Physicochemical characteristics and isoflavones content during manufacture of short-time fermented soybean product (cheonggukjang). J Food Sci Technol. 2020;57(6):2190-2197. doi:10.1007/s13197-020-04255-2
- Wada K., Nakamura K., Tamai Y., Tsuji M., Kawachi T., Hori A., Takeyama N., Tanabashi S., Matsushita S., Tokimitsu N. Soy isoflavone intake and breast cancer risk in Japan: From the Takayama study. International Journal of Cancer. 2013;133(4):952-960. doi:10.1002/ijc.28088
- Handa C. L., de Lima F. S., Guelfi M. F. G., Fernandes M. da S., Georgetti S. R., Ida EI. Parameters of the fermentation of soybean flour by Monascus purpureus or Aspergillus oryzae on the production of bioactive compounds and antioxidant activity. Food Chemistry. 2019;271:274-283. doi:10.1016/j.foodchem.2018.07.188
- Polanowska K., Grygier A., Kuligowski M., Rudzińska M., Nowak J. Effect of tempe fermentation by three different strains of Rhizopus oligosporus on nutritional characteristics of faba beans. LWT. 2020;122:109024. doi:10.1016/j.lwt.2020.109024
- Xu L., Cai W. X., Xu B. j. A Systematic Assesment on Vitamins (B2, B12) and GABA Profiles in Fermented Soy Products Marketed in China. Journal of Food Processing and Preservation. 2017;41(5):e13126. doi:10.1111/jfpp.13126
- Herawati H., Afifah D. N., Kusumanigtyas E., Usmiati S., Soemantri A. S., Kamsiati E., Bachtiar M. Characterization of GABA (gamma-aminobutyric acid) levels some fermented food in Indonesia. IOP Conf Ser: Earth Environ Sci. 2021;819(1):012068. doi:10.1088/1755-1315/819/1/012068
- Torino M. I., Limón R. I., Martínez-Villaluenga C., Makinen S., Pihlanto A., Vidal-Valverde C., Frias J. Antioxidant and antihypertensive properties of liquid and solid state fermented lentils. Food Chemistry. 2013;136(2):1030-1037. doi:10.1016/j.foodchem.2012.09.015
- Jang E. K., Kim N. Y., Ahn H. J., Ji G. E. γ-aminobutyric acid (GABA) production and angiotensin-i converting enzyme (ACE) inhibitory activity of fermented soybean containing sea tangle by the co-culture of lactobacillus brevis with <i>Aspergillus oryzae<i/>. Journal of Microbiology and Biotechnology. 2015;25(8):1315-1320. doi:10.4014/jmb.1412.12038
- Zareian M., Oskoueian E., Majdinasab M., Forghani B. Production of GABA-enriched idli with ACE inhibitory and antioxidant properties using Aspergillus oryzae: the antihypertensive effects in spontaneously hypertensive rats. Food Funct. 2020;11(5):4304-4313. doi:10.1039/C9FO02854D
- Chen Y., Chang S. K. C. Macronutrients, phytochemicals, and antioxidant activity of soybean sprout germinated with or without light exposure. Journal of Food Science. 2015;80(6):S1391-S1398. doi:10.1111/1750-3841.12868
- Sanjukta S., Rai A. K. Production of bioactive peptides during soybean fermentation and their potential health benefits. Trends in Food Science & Technology. 2016;50:1-10. doi:10.1016/j.tifs.2016.01.010
- Sitanggang A. B., Lesmana M., Budijanto S. Membrane-based preparative methods and bioactivities mapping of tempe-based peptides. Food Chemistry. 2020;329:127193. doi:10.1016/j.foodchem.2020.127193
- Sitanggang A. B., Sumitra J., Budijanto S. Continuous production of tempe-based bioactive peptides using an automated enzymatic membrane reactor. Innovative Food Science & Emerging Technologies. 2021;68:102639. doi:10.1016/j.ifset.2021.102639

This work is licensed under a Creative Commons Attribution 4.0 International License.


