

Introduction
The application of the jelly processing method in functional food industries is vital in reducing the losses of fruit production, preventing the fruit from spoilage, and improving the nutritional qualities of the food.1 Functional jelly is defined as a mixture; that brings to a suitable gelled consistency of sugars, the pulp of one or more fruits, and water. To prepare the jellies, fruits and sugars are combined in a specific ratio, added with healthy ingredients where enhancements are intended to produce a nutritional benefit.2 This study is essential as jelly processing is an important strategy to preserve perishable fruits and improve food nutrition. Banana and honey extracts, which contain essential bioactive compounds, are a good fit with the growing demand in the functional food industry as one of the quickest ways of getting nutrients into the body is through the consumption of jelly.2
Consumers prefer jelly due to its unique texture and chewability; they are added with artificial coloring and flavoring additives. Thus, the nutritional imbalance of these products places them in a food category socially perceived as unhealthy.3 An innovative aspect of this research is the use of local natural products, bananas, and honey as a source of carbohydrates, proteins, minerals, vitamins and bioactive compounds to create a more favorable nutritional profile of the jelly. M. paradiasiaca or locally known as ‘pisang awak’ is extensively cultivated in Malaysia and frequently used in traditional medicines, cosmetics, and the production of snacks and beverages.4 Besides carbohydrates as the main component, the banana has also been evaluated for its phenolic, flavonoid, tannin, and carotenoid contents.5 Various parts of ripe and unripe banana forms have been shown to possess anti-diabetic, antihyperlipidemic, antiulcer, anticancer, and antioxidant activities.6,7
Trigona sp. honey, locally known as ‘madu kelulut’, is produced by Malaysian stingless bees (Trigona sp.). It is rich in bioactive compounds such as flavonoids, phenolic acids, ascorbic acid, and carotenoids. These compounds have contributed to the therapeutic effects of Trigona sp. honey, such as anticancer, antioxidant, anti-inflammation, antimicrobial, and anti-diabetic properties.8 Many studies have documented the nutritional and medicinal values of Trigona sp. honey.9,10 In the comparative study, the researchers found higher antioxidant activities, phytochemical contents, macrominerals (potassium, calcium, and magnesium), and trace minerals (manganese, cobalt, and barium) in Trigona sp. honey than ‘Tualang’ honey.10 To our best knowledge, the jelly formulation based on the combination of unripe fruit of M. paradisiaca with Trigona sp. honey and their functional properties have hardly been reported. Therefore, the functional attributes of the formulated jelly such as carbohydrate, protein, fiber, fat and phytochemical contents of a palatable jelly containing local M. paradisiaca and Trigona sp. honey were investigated. These natural products are highly accessible and nutritious and, therefore could respond to the growing demand for functional foods among health-conscious consumers.
Material and Methods
The flow chart (Figure 1) below describes the production process of MTJ.
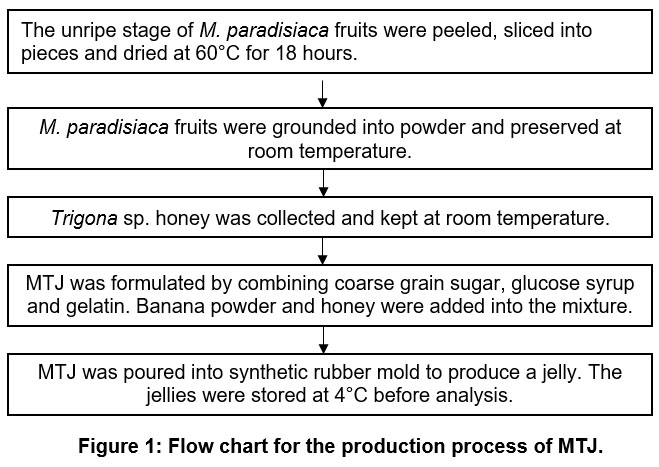 |
Figure 1: Flow chart for the production process of MTJ. |
Sample processing
About 3 kg of the unripe stage of ‘Pisang awak’ (M. paradisiaca) was purchased from a local market. Firstly, the banana was peeled using a knife to remove the skin and then soaked in water for 30 minutes. The banana was then sliced into pieces about 5 to 10 mm thick and placed on a tray before drying in a universal oven drier (Memmert 100-800 Incubator, Germany) at 60°C for 18 hours.11 After drying, the dried banana slices were ground into a fine powder using a multi-purpose swing disintegrator (Z500 medicine crusher, China) and later preserved in an airtight plastic container at room temperature.12 Trigona sp. honey was collected from a selected local controlled farm in Ketereh District, Kelantan, Malaysia, and transferred to the Laboratory of Food Analysis, Kulliyyah of Allied Health Sciences, International Islamic University Malaysia.
MTJ formulation
The formulation was conducted using the method of Zainun.13 About 200 g of coarse grain sugar (Gula Prai, Malaysia), 200 g of glucose syrup (Healthy Baker, Malaysia), and 50 g of water were mixed and heated until 100°C. Then, 40 g of gelatin (Halagel, Malaysia) was mixed with 110 g of water and heated to 60°C in the second phase. The first phase mixture was let cool to 60°C before adding to the mixture of the second phase. Then, 20 g of M. paradisiaca powder and 20 g of Trigona sp. honey were added to the earlier mixture. The mixture was mixed thoroughly using the blender. About 5 g of MTJ was poured into each synthetic rubber mold to produce about 20 jellies per formulation. The jellies were stored at 4°C before analysis.
Physicochemical Analysis
Moisture content was measured in triplicates following the AOAC method.14 The empty dish was dried in the oven (Memmert 100-800 Incubator, Germany) for 24 hours at 110°C. Approximately 2 g of jelly was weighed and dried in the oven at 70°C for 8 hours. The dried sample was cooled in a desiccator for 30 minutes to reduce moisture absorption during weighing. Moisture content was calculated using the following equation:
Moisture content (g/100 g) = (W2 – W1)/Initial sample weight x 100
W2 = Dish with sample weight
W1 = Dried dish weight
Crude protein content was determined in triplicates by the Kjeldahl method following the AOAC method.14 The digestion was performed using a digester machine, KjelDigestor (K-446), and distillation by the Kjeldahl distillation unit.
Soxhlet method was used to determine fat content following the method of Rana et al.15 Fat content was determined in triplicates by extracting 5 g of the sample with petroleum ether in a soxhlet extractor.
The total fiber was determined in triplicates by successive treatment with sulphuric acid and sodium hydroxide as referred to the method by Gindi et al.20 The residue was scraped into a pre-weighed porcelain crucible, and the weight was taken (W1). Incineration of the crucible with residue was performed for 2 hours at 600°C. Subsequently, the crucible was left to cool in the desiccator for another 30 minutes before taking the total weight (W2). The calculation of total fiber was based on the following formula:
Total fiber (%) = (W1 – W2) / WS × 100
W1 = weight of crucible and residue after drying (g)
W2 = weight of crucible and ash after incineration (g)
WS = weight of the jelly sample (g)
Ash content analysis was done in triplicates according to AOAC standard methods with modification.14 Ash was estimated using the dry ashing method, where two grams of sample were incinerated in a muffle oven at 550°C for 12 hours.
The total carbohydrate content was determined in triplicates according to the following formula by Gindi et al.16:
Total carbohydrate (%) = 100 – (moisture content [%] + ash [%] + protein [%] + fat [%] + fiber [%]).
The gross energy was determined in triplicates by using constant energy factors, namely 17 Kj/g (4 kcal/g) for both protein and carbohydrate, 38kJ/g (9kcal/g) for fat, based on the following formula by Gindi et al.16:
Gross energy (kcal/100 g) = (carbohydrate [%] × 4) + (fat [%] × 9) + (protein [%] × 4).
The pH value of the MTJ was measured in triplicates using a pH meter (Mettler Toledo, United States). The method was employed based on the Association of Official Analytical Chemists (AOAC) method.14 The pH meter was calibrated with two buffer solutions, pH4.0 and pH10.0. The sample (10 g) was dissolved in 75 mL of distilled water. Then, the jelly solution was homogenized by a sonicator at 26°C for 30 minutes before the reading was taken using the pH meter.
Total soluble solid was measured using a hand refractometer (Atago, Manual, Japan) according to Rebiai & Lanez.17 About 1-2 drops of the jelly sample were placed on the refractometer’s prism plate. The measuring was carried out in triplicates at 20°C, and the readings were recorded as total soluble solid (°Brix).
Texture Profile Analysis
Texture properties of MTJ determined by a texture profile analysis (TPA) test according to Kavitha et al.18 with slight modifications. TPA was carried out using a TA-TX2 texture analyzer (Stable Micro Systems Ltd., Surrey, UK). A crossed speed of 1 mm/sec with a 5 kg compression load cell of P/75 mm compression probe which were compressed twice to 40% of the original height of the jelly. The TPA settings were as follows: pre-test speed: 2 mm/s; test speed: 1.0 mm/s; post-test speed: 1 mm/s; waiting time between cycles 2 s and trigger force 5 g. The TPA analysis was carried out at ambient temperature (25◦C). Three measurements were made for each sample in the same lot and average value was reported for each parameter. Textural parameters such as hardness, adhesiveness, cohesiveness, springiness, gumminess, chewiness and resilience were generated from the force-time graph using the exponent software.
MTJ Extraction
The extraction method was done according to Mat Alewi et al.12 with modifications. The sample (5 g) was suspended in 25 mL of 80% (v/v) methanol (Merck, Germany). The mixture was heated at 55°C and sonicated for 30 minutes. Then, it was filtered using a syringe filter (0.2 µm). The sample extract was kept at 4°C before TPC and TFC analysis.
Total Phenolic Content (TPC)
The Folin-Ciocalteu method was conducted to measure TPC based on the method by Carvalho et al.19 The samples and measurements were carried out in triplicates. Briefly, 1 mL of Folin-Ciocalteu’s reagent (Merck, Germany) was mixed with 1 mL of the sample extract. Then, 1 mL of 10% sodium carbonate (Na2CO3) solution (Merck, Germany) was added, and the mixture was adjusted to 10 mL with distilled water. Next, after the mixture was standing in the dark room for 90 minutes, the absorbance readings were taken at 725 nm using UV/VIS-spectrophotometer (Schott UVLine 9400, USA). A standard calibration curve of gallic acid (0.0003 to 0.3125 of mg/mL, r2 = 0.9994) was plotted.
Total Flavonoid Content (TFC)
The TFC was determined according to the colorimetric assay based on the method by Carvalho et al.19 Briefly, 100 µL of the extract was mixed with 4 mL of distilled water. Then, 0.3 mL of sodium nitrite (NaNO3) (5%, w/v) was added and followed by 0.3 mL of aluminum chloride (AlCl3) (10%, w/v) (Merck, Germany). About 2 mL of 1M sodium hydroxide (NaOH) (Merck, Germany) was added, and after that, the volume was adjusted to 10 mL with distilled water. The mixture was mixed thoroughly, and the absorbance was taken at 510 nm using UV/VIS-spectrophotometer (Schott UVLine 9400, USA). A standard solution of catechin ranging from 0.25 to 4 µg/mL was used, and the calibration curve was plotted using r2 = 0.8855. The measurement was carried out in triplicates. The result was expressed as mg of catechin equivalence per hundred grams of MTJ (mg CEQ/100 g).
Shelf-life study
Microbiological analysis was conducted for every month interval to estimate the shelf life of the MTJ based on standard plate count and yeast and mold count following the work done by Carvalho et al.19 The MTJ was compared to the control jelly in terms of types of packaging and storage conditions. The jelly (5 g) was prepared in two packaging types: aluminum and polypropylene (PP) plastic (Figure 2) based on the method by Mat Alewi et al.12 Two storage conditions were set at 26°C and 4°C. The storage duration was five months, and the microbiological analyses were conducted every month. In each month interval, eight samples, including the controls, were analyzed, and for each sample, three replicates were prepared.25
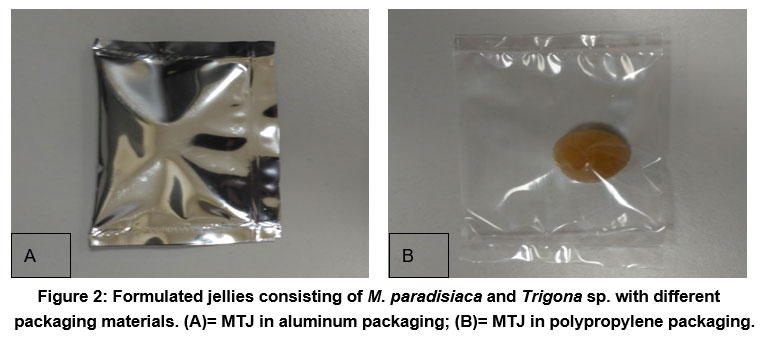 |
Figure 2: Formulated jellies consisting of M. paradisiaca and Trigona sp. with different packaging materials. (A)= MTJ in aluminum packaging; (B)= MTJ in polypropylene packaging. |
Sample jelly preparation
The maximum recovery diluent (MRD) was prepared by diluting 9.5 g of MRD in 1 L of distilled water. The prepared MRD solution was sterilized through autoclaving at 121°C and allowed to cool to room temperature. MTJ sample (10 g) was then mixed with 90 mL of MRD solution using a Seward Stomacher for 2 minutes. Serial dilutions of 1:10, 1:100, and 1:1000 were done from the homogenate according to the method of Mat Alewi et al.12
Control jelly formulation
In the first mixture, 200 g of coarse grain sugar (Gula Prai, Malaysia), 200 g of glucose syrup (Healthy Baker, Malaysia), and 50 g of water were mixed and heated until 100°C. In the second mixture, 40 g of gelatin (Halagel, Malaysia) was mixed with 110 g of water and heated to 60°C. Next, both mixtures were combined. In the formulation of the control jelly, no M. paradisiaca and Trigona sp. honey were incorporated.13
Standard Plate Count (SPC)
The spread plate method was adopted to determine SPC.27 The media, Petri dishes, test tubes, and pipettes were sterilized before the analysis. The culture medium using plate count agar (PCA; Oxoid, UK) was sterilized at 121°C for 15 min and then allowed to cool before transferring to the sterile plate. MTJ sample was pipetted to the plate after the culture medium was solidified. Then, the inoculum was spread evenly over the surface of the culture medium. The plate was incubated at 35°C for 48 hours. After incubation, the numbers of colonies on the plate were within 30 to 300. The calculation of the Colony Forming Unit (CFU) was based on the equation as follows:
CFU/ mL = (no. of colony × dilution factor) / volume of MTJ sample
Yeast and Mould Count (YMC)
The pour plate method was adopted to determine YMC.20 The media, Petri dishes, test tubes, and pipettes were sterilized before the analysis. The culture medium consisting of yeast extract agar (YEA; Merck, US) was autoclaved at 121°C for 5 minutes and then allowed to cool before transferring to the plate. The sample was pipetted to the center of the sterile plate. Then, the prepared culture medium was subsequently poured into the plate containing the inoculum. Then, the plate was inverted and subjected to incubation at 28°C for seven days.
Statistical analysis
All data were presented as mean ± SD and were analyzed using two-way analysis of variance (ANOVA) using Graphpad Prism software (version 7, United States) to test the level of significance at 5% probability (p < 0.05). Tukey test was used to separate the means where significant differences existed.20
Results and Discussion
Physicochemical compositions
The proximate analysis of MTJ is described in Table 1. The comparisons were made with banana peel jellies formulated from the yellow-green ripening stage of banana.21 The banana peel jellies (JF1, JF2, and JF3) were made with sugar, citric acid, and banana peel powder. Based on the comparison, it can be seen that several parameters shown huge differences in proximate compositions especially in moisture, protein and fiber contents. MTJ shows a slightly higher carbohydrate content than JF1, JF2, and JF3. This result is supported by one study, which found that the banana flour that was made from unripe banana fruit resulting a higher carbohydrate content (75.0%) compared to banana peel (11.0%).22 The incorporation of Trigona honey in the formulation also might contribute to the improvement of the nutritional quality of MTJ, as honey is also known for its high carbohydrate content.9 The high content of carbohydrate in the current study evidenced the functionality of MTJ as a source energy. Protein content in our study was found to be higher than values reported in banana peel jelly and bilimbi jam.21,23 According to one report, the peel from unripe fruit presented (on a dry basis) 6–10% of protein, while the fruit from unripe M. paradisiaca consisted of (on a dry basis) 14.7% of protein.24
Our results showed moisture content of 14%, being in accordance with previous studies, which reported water content of 8–18% in the fruit gummy jellies.25 However, the value was slightly lower than those reported by other authors on sapota, banana peel and strawberry jellies (30-42%).19,21,26 The moisture level in each food product varied based on its ingredients and processing methods.26 The low moisture content will preserve and maintain the MTJ quality and extent the spoiling process over time.27
The MTJ also contained significant quantities of ash (0.38%). Ash content represents the quantity of minerals like calcium, phosphorus, and iron present in the sample.28 Ash content in this study was lower when compared to the banana peel jellies 21 but slightly higher than those reported by previous works on fruit jams and jellies.28 The total fat of MTJ was 0.1%, comparable to the previous work that reported 0.11% of total fat in the sapota pulp jelly.19
Table 1: Proximate composition of the MTJ in comparison with the banana peel jellies (JF1, JF2, and JF3)21
| Nutrient compositions | MTJ | JF1 | JF2 | JF3 |
| Moisture (%) | 14.09 ± 0.95 | 42.92 ± 0.28 | 38.72 ± 0.60 | 35.16 ± 0.31 |
| Ash (%) | 0.38 ± 0.03 | 1.04 ± 0.05 | 1.08 ± 0.11 | 1.20 ± 0.06 |
| Protein (%) | 7.07 ± 0.37 | 0.62 ± 0.09 | 1.11 ± 0.12 | 1.52 ± 0.04 |
| Total fat (%) | 0.1 ± 0.03 | 0.22 ± 0.14 | 0.39 ± 0.21 | 0.53 ± 0.23 |
| Carbohydrate (%) | 79.01 ± 0.23 | 54.25 ± 0.24 | 57.41 ± 0.19 | 62.80 ± 0.44 |
| Total fiber (%) | N.D (<0.01) | 4.64 ± 0.50 | 8.50 ± 0.94 | 12.70 ± 1.56 |
| Gross energy (kcal/100 g) | 345.22 | 221.46 | 237.59 | 262.05 |
All values represent the mean ± standard deviation of three replicates analyses.
N.D = Not detected (Below detection limit)
Based on Table 2, the pH of the MTJ was slightly acidic, which is similar to the work reported on coconut water jellies supplemented with guava juice.18 The pH greatly influences the gel formation, shelf life, and flavor. The higher the acidity level, the better the gelation process. However, the pH value must not be too low since it could deteriorate the sensory quality. The gel also will not form if the pH value is less than pH 2.4.29 In this study, the TSS of the MTJ was 74.33°Brix, which satisfies the minimum of 65°Brix soluble solids as stated in the Food Act and Regulation for jellies.30 The high value of TSS is comparable to the works on sapota and coconut water jellies.18,19
Texture profile analysis
Texture profile analysis (TPA) is also known as the two-bite test because the sample will be compressed twice using the suitable probe. The study indicates that the appropriate compression for the sample is 40% from its original height, which is similar to a study done by Sow & Yang.31 The force vs time plot is presented in Fig. 3 and the textural parameters of MTJ are shown in Table 2.
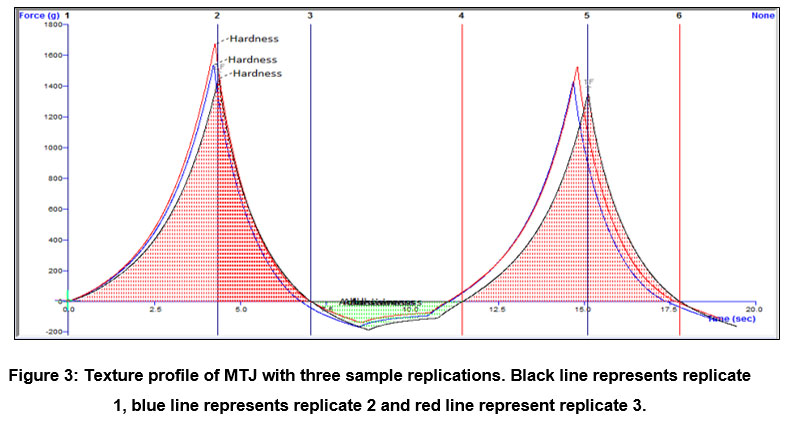 |
Figure 3: Texture profile of MTJ with three sample replications. Black line represents replicate 1, blue line represents replicate 2 and red line represent replicate 3. |
Table 2: Physicochemical properties and texture profile analysis of MTJ.
| Parameters | Values |
| pH | 5.07 ± 0.12 |
| TSS (°Brix)Hardness (N)Adhesiveness (g.sec)CohesivenessSpringiness (mm)Chewiness (N)Gumminess (N)Resilience | 78.33 ± 0.2915.27 ± 1.11-416.14 ± 82.980.88 ± 0.000.85 ± 0.0211.54 ± 1.1313.48 ± 0.940.69 ± 0.02 |
All values represent the mean ± standard deviation of three replicates analyses
The hardness is correlated with the strength of gel structure under compression. MTJ exhibited a hardness value similar to that reported on lychee jelly, produced from high-pressure processing (HPP) gelatin.32 Adhesiveness estimates the strength required to overcome the attractive forces between the probe’s surface and the sample. The result showed that MTJ exhibited less adhesiveness when compared with pomegranate jelly supplemented with honey (-2138 g.sec).33 However, the adhesiveness of MTJ was comparable to L. rohita gelatin (-364.39 ± 138 g.sec).34 Studies have revealed that jellies with a high hardness also have a high adhesiveness.32,35 According to Yusof et al.32 low cohesiveness jelly is easy to chew and swallow. The cohesiveness of MTJ was similar to the lychee jelly with HPP-treated gelatin (0.87 ± 0.05)32 but higher when compared with the grass jelly (0.59 ± 0.08).36
The springiness or the measure of the elasticity of the sample was also determined in MTJ, and the value was similar with coconut water mixed fruit jelly, blended with guava, aonla and pomegranate juices (0.91-0.92 mm)18 and grass jelly (0.88 ± 0.04 mm).36 Meanwhile, the gumminess of MTJ was compared with the lychee jelly with HPP-treated gelatin.32 These authors reported 12.26 ± 0.44 N, which is in accordance with the gumminess value of MTJ. Chewiness indicates the amount of energy necessary to masticate a solid food into a state suitable for swallowing.51
If the degree of hardness is high, the chewiness value is also high.35 The present result showed that the chewiness for MTJ was 11.54 ± 1.13 N, which is higher than the date-lemon jelly with 45% of sugar (9.12 ± 0.33 N).37 The ability of a product to revert to its original position immediately after facing the first compression before undergoing the second compression is referred to as resilience.38 The lower the resilience score, the more likely the jelly product will break. The resilience value for MTJ was 0.69 ± 0.02, which was similar to L. rohita gelatin (0.77 ± 0.03)34 but higher than the cork fish jelly (0.47 ± 0.05).38
Phytochemical content
The phenolic compounds and flavonoids are potent antioxidants by scavenging free radicals and preventing cell damage.21 The detection of TPC and TFC in this study indicated the functionality of MTJ as a source of antioxidant. In this study, the MTJ showed lower values for TPC and TFC than the banana peel jellies (JF1, JF2, and JF3).21 The TPC values of banana peel jellies ranged from 100 to 900 mg GAE/100 g, while TFC ranged from 50 to 100 mg CEQ/100 g. Referring to Table 3, the MTJ was 6-folds to 50-folds lower than JF1, JF2, and JF3 for TPC, where as, for TFC, the MTJ was 143-folds to 285-folds lower than JF1, JF2, and JF3. The yield difference could be due to the drying process. In the processing method of JF1, JF2, and JF3, the banana peels were freeze-dried, therefore could prevent the degradation of the phenolics.21 On the contrary, the banana fruits in the present study were dried at 60°C for 18 hours. This prolonged heat treatment could compromise the yield of phenolic compounds. One study found that the significant losses in phenolic compounds are due to the leaching of antioxidant compounds into the water due to the heat exposure during the jelly preparation.23 It is known that the thermal process might change the chemical structure, alter the biological properties and compromise the nutritive values of the food.39 The previous work also found the reduction of TPC in response to thermal processing in preparing the blackberry jam.39 Despite the low values of TPC and TFC in this study, the MTJ still has antioxidant potential, and further investigation of its antioxidant activity such as 2,2′-diphenyl-1 picrylhydrazyl (DPPH), 2,2′-azino-di 3-ethylbenthiazolinesulfonate (ABTS) and ferric reducing antioxidant potential (FRAP) assays should be conducted.
Table 3: Phytochemical analysis of the MTJ compared to the banana peel jellies (JF1, JF2, and JF3)21
| Parameter | MTJ | Banana peel jellies |
| TPC (mg GAE/100 g) | 18.30 ± 2.67 | 100-900 |
| TFC (mg CEQ/100 g) | 0.35 ± 0.02 | 50-100 |
All values represent the mean ± standard deviation of three replicates analyses
Microbiological analysis
Microbiological analysis of MTJ was done at every month interval for five months with different packaging (aluminum and polypropylene) and storage conditions (4°C and 26°C). The colony count of mesophilic bacteria was measured using standard plate count, and yeast and mold count was conducted using the pour plate method. These methods indicate the degree of microbial contamination in the foods.57 According to the standard guidelines, the CFU values presented in the study for SPC and YMC were within the limit allowed (<log 6 CFU/g) and categorized as satisfactory for level 2.40 Referring to Table 4, the CFU values of SPC for the MTJ (JP4, JP26, JA4, and JA26) were significantly higher (p < 0.05) than the control jellies (CP4, CP26, CA4, and CA26) from month 0 to month 5. The CFU for the control jellies showed no colony present (nil) from month 0 to month 5, indicating that no microbial growth was detected in the control jellies.
In contrast, CFU values for the MTJ remained consistent from month 0 to month 5. The lowest value was recorded in month 0 (JP4), and the highest value was recorded in month 4 (JP26). The higher CFU values in MTJ than in the control jelly may be due to the added ingredients in the product, such as honey. Honey contains few microorganisms coming from primary and secondary sources. The primary sources of contamination are related to digestive tract of the bees, which might contain beneficial microbes. While, the secondary sources are related to the contamination during the postharvest and processing.10 However, the microbial growth in MTJ was under the limit up to the end of the storage period.40 Hence, the prepared jelly was found safe and suitable for consumption for up to five months. In the previous study on the shelf life of ivy gourd jelly, the authors found the increment in total bacteria from nil to 1.32 × 10² cfu/g and 1.26 × 10² cfu/g in control and ivy gourd jelly samples, respectively, on the 21st day.41
Meanwhile, in the case of sapota and beetroot blended jelly, the microbial count was 2 × 10³ cfu/g.42 The microbial count increased slightly from 2 × 10³ cfu/g to 3 × 10³ cfu/g at ambient temperature and from 1 × 10³ cfu/g to 2 × 10³ cfu/g at refrigerated temperature. In contrast with the present study, no difference was found in the CFU values at room temperature and refrigerated temperature. The CFU values of MTJ were also higher than the previous research on dragon fruit jelly.43
Table 4: SPC for the MTJ and control jellies with different packaging materials (polypropylene and aluminum) and storage temperatures (4°C and 26°C) for five months.
| Total viable counts (Log CFU/g) | ||||||
| Samples | Month 0 | Month 1 | Month 2 | Month 3 | Month 4 | Month 5 |
| CP4 | Nila,x | Nila,x | Nila,x | Nila,x | Nila,x | Nila,x |
| CP26 | Nila,x | Nila,x | Nila,x | Nila,x | Nila,x | Nila,x |
| CA4 | Nila,x | Nila,x | Nila,x | Nila,x | Nila,x | Nila,x |
| CA26 | Nila,x | Nila,x | Nila,x | Nila,x | Nila,x | Nila,x |
| JP4 | 4.43±0.00b,x | 4.63±0.06b,xy | 4.72±0.04b,y | 4.44±0.01b,x | 4.83±0.13b,y | 4.76±0.00b,y |
| JP26 | 4.59±0.04b,xy | 4.58±0.06b,xy | 4.44±0.01c,x | 4.43±0.00b,x | 4.52±0.01c,xy | 4.69±0.01b,y |
| JA4 | 4.50±0.07b,x | 4.57±0.20b,xy | 4.80±0.29b,z | 4.43±0.00b,x | 4.48±0.01c,x | 4.74±0.01b,yz |
| JA26 | 4.56±0.07b,x | 4.61±0.20b,xy | 4.46±0.29c,x | 4.43±0.00b,x | 4.56±0.01c,x | 4.78±0.01b,y |
Nil = No colony present; C = Control; J = MTJ; P = Polypropylene; A = Aluminum; 4 = 4°C; 26 = 26°C.
Different superscript letters (a,b,c,d) within the columns for each concentration indicate significant differences (Tukey’s multiple comparisons test, P < 0.05). Different superscript letters (x,y,z) within the rows for each time interval indicates significant difference (Tukey’s multiple comparisons test, P < 0.05).
Referring to Table 5, for YMC, the CFU for MTJ (JP4, JP26, JA4, and JA26) decreased significantly from month 4 to 5. For CP26, the CFU value started to increase from month 3 onward, while for CP4, the CFU value started to increase at month 5. For CA4 and CA26, CFU values began to increase at month 4. In the initial month, the growths of yeast and mold were detected as the CFU values for MTJ were in the range of 3.79 to 3.99 log CFU/g. However, according to the standard guidelines, the CFU values presented were within the limit allowed (<log 6 CFU/g).40 In a separate study, the shelf life of ivy gourd jelly showed that the mold population increased from nil to 1.23×10² cfu/g in control and nil to 1.00×10² cfu/g on the 21st day.60
Table 5: YMC for the MTJ and control jellies with different packaging materials (polypropylene and aluminum) and storage temperatures (4°C and 26°C) for five months.
| Total viable counts (Log CFU/g) | ||||||
| Samples | Month 0 | Month 1 | Month 2 | Month 3 | Month 4 | Month 5 |
| CP4 | Nila,w | Nila,w | Nila,w | Nila,w | Nila,w | 5.04±0.03a,x |
| CP26 | Nila,w | Nila,w | Nila,w | 2.72±0.11b,x | 4.24±0.02be,y | 3.43±0.44b,z |
| CA4 | Nila,w | Nila,w | Nila,w | Nila,w | 3.18±0.02c,x | 3.08±0.04c,x |
| CA26 | Nila,w | Nila,w | Nila,w | Nila,w | 3.46±0.05d,x | 2.61±0.05df,y |
| JP4 | 3.99±0.06b,vw | 3.79±0.00b,w | 3.89±0.05bd,wx | 4.28±0.01c,y | 4.10±0.13b,vxy | 3.09±0.04c,z |
| JP26 | 3.79±0.00b,vw | 3.84±0.05b,vw | 3.62±0.17c,v | 4.47±0.20c,x | 4.04±0.04b,w | 3.02±0.06ce,y |
| JA4 | 3.90±0.05b,vwx | 3.78±0.00b,v | 4.13±0.00b,wx | 4.53±0.06ce,y | 4.15±0.04b,x | 2.74±0.13df,z |
| JA26 | 3.92±0.01b,v | 3.73±0.03b,v | 3.80±0.06cd,v | 4.76±0.01de,w | 4.43±0.00e,x | 2.78±0.09ef,y |
Nil = No colony present; C = Control; J = MTJ; P = Polypropylene; A = Aluminum; 4 = 4°C; 26 = 26°C.
Different superscript letters (a,b,c,d) within the columns for each concentration indicate significant differences (Tukey’s multiple comparisons test, P < 0.05). Different superscript letters (x,y,z) within the rows for each time interval indicates significant difference (Tukey’s multiple comparisons test, P < 0.05).
In terms of packaging material, polypropylene packaging (JP4) exhibited the highest value of CFU in month 4 (SPC). Polypropylene packaging also exhibited an earlier CFU value of YMC (CP26) than aluminum packaging (CA4 and CA26), and these findings indicate that aluminum could preserve the quality of MTJ. In terms of storage temperature, a similar trend was observed in the CFU values of all samples (SPC). However, in YMC, CP4 (4°C) exhibited a CFU value later than CP26 (26°C). This result indicates that the refrigerated temperature (4°C) could provide a suitable storage condition to slow down the growth of yeast and mold in the jellies. Maintaining the foods between 1-8°C can reduce the rate of biochemical and microbiological activities and extend the shelf life of the foods.12
Conclusion
The innovative nature of this research was highlighted since no similar products are available on the market, offering the combination of M. paradisiaca and Trigona sp. honey in the jelly formulation with natural coloring and flavoring. Moisture, ash, protein, fat, carbohydrate, and energy content were 14.09%, 0.38%, 7.07%, 0.1%, 79.01%, and 345.22 kcal, respectively. The pH and total soluble solids were 5.07 and 78.33 °Brix, respectively. TPA showed that MTJ is firm, adhesive and easy to chew and swallow. The current research results revealed that MTJ could be promoted as a healthy food for daily consumption by being nutritionally sufficient. However, reducing sugar in the jelly processing could be done in the future to create a less sweet jelly. Microbiological analysis showed that the incorporation of M. paradisiaca and Trigona sp. honey induced the presence of microorganisms but were still within the limit allowed by the standard guidelines and safe to be consumed for up to five months. The MTJ presented with low values of TPC (18.30 mg GAE/100 g) and TFC (0.35 mg CEQ/100 g) compared with the previous works. Nevertheless, regardless of the degradation of TPC and TFC, the present results suggest that the MTJ remains a good choice of functional food with adequate nutrients, antioxidant potential, and satisfactory shelf life.
Acknowledgment
The authors would like to thank Kulliyyah of Allied Health Sciences, International Islamic University Malaysia (IIUM), for the facilities.
Conflict of interest
The authors declared no potential conflict of interest concerning the research, authorship, and publication of these articles.
Funding Sources
Malaysian Ministry of Higher Education (MOHE) under the Prototype Research Grant Scheme (PRGS15-015-0025).
References
- Amit S. K., Uddin M. M., Rahman, R. et al. A review on mechanisms and commercial aspects of food preservation and processing. Food Secur. 2017; 6: 51.
CrossRef - Donno D., Mellano M. G., Hassani S., De Biaggi M., Riondato I., Gamba G., Giacoma C., Beccaro G. L. Assessing Nutritional Traits and Phytochemical Composition of Artisan Jams Produced in Comoros Islands: Using Indigenous Fruits with High Health-Impact as an Example of Biodiversity Integration and Food Security in Rural Development. 2018; 23(10): 2707.
CrossRef - Yuliana M., Rivero S., García M. A. Functional Jelly Beans Based On Hydrocolloids And Citrus Cremogenates. Multidiscip. Engin. Sci. Tech. 2017; 4(10): 8359-8369.
- Mohd Nur Nasyriq A., Muhammad I., Badr Eddin K., Nur Aizura M. A., Norazlanshah H., Ainin Azwani A. R. et al., Response surface optimization of high antioxidant jelly from Musa paradisiaca and Trigona Honey using central composite design as a convenient functional food. Int. Food Res. J. 2019; 26(4): 1201-1209.
- Kapadia S. P., Pudakalkatti P. S., Shivanaikar S. Detection of antimicrobial activity of banana peel (Musa paradisiaca) on Porphyromonas gingivalis and Aggregatibacter actinomycetemcomitans: An in vitro study. Contem. Clin. Dent. 2015; 6(4): 496–499.
CrossRef - Laeliocattleya R. A., Estiasih T., Griselda G., Muchlisyiyah J. The bioactive compounds and antioxidant activity of ethanol and ethyl acetate extracts of Candi Banana (Musa paradisiaca). IOP Conf. Series: Earth and Environ. Sci. 2018; 131:12-13.
CrossRef - Mostafa H. S. Banana plant as a source of valuable antimicrobial compounds and its current applications in the food sector. Food Sci. 2021; 98.
CrossRef - Siti Norfitrah M. S., Logaraj R., Chng Saun F., Ridhwan Abdul W., Mohammad Syaiful Bahari Abdul A. R. In-vitro cytotoxicity of Trigona itama honey against human lung adenocarcinoma epithelial cell line (A549). J. Integrat. Med. 2019; 30:100955.
CrossRef - Zulkhairi Amin F. A., Sabri S., Mohammad S. M., Ismail M., Chan K. W., Ismail, Mohd Esa Norhaizan N., Zawawi N. Therapeutic Properties of Stingless Bee Honey in Comparison with European Bee Honey. Pharmacol. Pharm. Sci. 2018: 6179596.
CrossRef - Badr Eddin K. Physicochemical and Antioxidant Properties of Malaysian Trigona and Tualang Bee Honey. Master Thesis. International Islamic University Malaysia. 2017.
- Patel N. V., Naik A. G., Senapati A. K. Quality Evaluation and Storage Study of Banana – Pineapple Blended Jam. J. Food Quali Safety. 2015; 1: 45-51.
- Mat Alewi N. A., Ibrahim M., Md Isa M. L., Abdul Rasad M. S. B., Abdul Rafa A. A., Anuar M. N. N. Response surface optimization and antioxidant characterization of high antioxidant soft jelly prepared from Baccaurea angulata fruit juice and Trigona honey using central composite design. Int. Food Res. J. 2020; 27(3): 454-464.
- Zainun C. A. Food Products from Ananas. Acta Hortic. 2011; 902: 533-538.
CrossRef - Association of Official Analytical Chemists (AOAC). Official Methods of Analysis (17ed.). USA: AOAC Inc. 2003.
- Rana K. R., Chongtham N., Bisht M. S. Evaluation of Proximate Composition, Vitamins, Amino Acids, Antioxidant Activities and Bioactive Compounds of Young Edible Bamboo (Phyllostachys Mannii Gamble). Res. Nutr. Food Sci. 2021; 10(1).
CrossRef - Gindi S. R., Chung K. C., Lun S. C. P., Ling H. S. Physicochemical Characteristics and Proximate Analysis of Fruit Jam from Baccaurea angulata Borneo J. Sci. Tech. 2019; 1(2): 74-77.
- Rebiai A., Lanez T. Comparative study of honey collected from different flora of Algeria. Fund. Appl. Sci. 2014; 6(1): 48–55.
CrossRef - Kavitha B., Sugasini D., Yalagala C. R., Kumar P. Development of Nutraceutical Rich Tender Coconut Water Mixed Fruit Juices Jelly and Its Physico-Chemical Characteristics. Food Nutr. Disor. 2019; 8:1.
CrossRef - Carvalho V. S., Damiani C., Asquieri E. R., Orsi D. C., Nishi A. C. F. Development and antioxidant capacity of sapota pulp Jelly. Ciênc. Agrotec. Lavras. 2012; 36(3): 341-347.
CrossRef - Ampofo-Asiama J., Quaye B. Effect of storage temperature on the physicochemical, nutritional and microbiological quality of pasteurized soursop (Annona muricata) Juice. Afri. J. Food Sci. 2019; 13(2): 38-47.
CrossRef - Lee E. H., Yeom H. J., Ha M. S., Bae D. H. Development of banana peel jelly and its antioxidant and textural properties. Food Sci. Biotechnol. 2010; 19(2): 449–455.
CrossRef - Amini Khoozani A., Birch J., Bekhit A. E. A. Production, application and health effects of banana pulp and peel flour in the food industry. Food Sci. Technol. 2019; 56(2): 548-559.
CrossRef - Anuar N. A.,Mohd Salleh R. Development of fruit jam from Averrhoa bilimbi J. Food Process. Preserv. 2019; 43: e13904.
CrossRef - Eleazu C. O., Okafor P. Use of unripe plantain (Musa paradisiaca) in the management of diabetes and hepatic dysfunction in streptozotocin-induced diabetes in rats. Med. Appl. Sci. 2015; 7(1): 9-16.
CrossRef - Leixeira-Lemos E., Almeida A., Vouga B., Morais C., Correia I., Pereira P. Guiné, R. Development and characterization of healthy gummy jellies containing natural fruits. Open Agric. 2021; 6(1): 466-478.
CrossRef - Zubair M. A., Haque A., Sultana M. M., Akter S. Compositional Analysis and Development of Jam, Jelly and Squash from Strawberry Cultivated in Bangladesh. J. Environ. Sci. Nat. Res. 2014; 7(2): 185–190.
CrossRef - Samsudin N. I. P., Roslan N. A., Nor Khaizura M. A. R., Hasan H. Shelf life extension of ambient-stored banana cake using banana powder. Food Res. J. 2019; 26(1): 305 – 312.
- Rana M. S., Yeasmin F., Khan M. J., Riad M. H. Evaluation of quality characteristics and storage stability of mixed fruit jam. Food Res. 2021; 5(1): 225 – 231.
CrossRef - Susan F. Jams, jellies, and related products, In Woodhead Publishing Series in Food Science, Technology and Nutrition. A Complete Course in Canning and Related Processes (Fourteenth Edition), Woodhead Publishing, United Kingdom. 2016; pp. 313-349.
CrossRef - Food Act and Regulation. Regulation 247—Fruit Jelly. 2014; 169.
- Sow L. C., Yang H. Effects of salt and sugar addition on the physicochemical properties and nanostructure of fish gelatin. Food Hydrocoll. 2015; 45: 72–82.
CrossRef - Yusof N., Jaswir I., Jamal P., Jami S. E. Texture profile analysis (TPA) of jelly dessert prepared from halal gelatin extract using high pressure processing (HPP). J. Fund. Appl. Sci. 2019; 15(4): 604-608.
CrossRef - Cano-Lamadrid M., Calín-Sánchez Á., Clemente-Villalba J., Hernández F., Carbonell-Barrachina Á. A., Sendra E., Wojdyło A. Quality Parameters and Consumer Acceptance of Jelly Candies Based on Pomegranate Juice “Mollar de Elche“. Foods. 2020; 9(4): 516.
CrossRef - Chandra M. V., Shamasundar B. A. Texture Profile Analysis and Functional Properties of Gelatin from the Skin of Three Species of Fresh Water Fish. J. Food Proper. 2015; 18(3): 572-584.
CrossRef - Mutlu C., Tontul S. A., Erbaş M. Production of a minimally processed jelly candy for children using honey instead of sugar. LWT – Food Sci. Technol. 2018; 93: 499-505.
CrossRef - Leelawat B., Permpoonchokkana P., Jirapornsirikun T. Development of grass jelly processing using modified starches and higher efficient extraction method. J. Agric. Technol. 2020; 16(2): 297-308.
- Masmoudi M., Besbes S., Blecker C., Attia H. Preparation and characterization of jellies with reduced sugar content from date (Phoenix dactylifera) and lemon (Citrus limon L.) by-products. Fruits. 2010; 65(1): 21-29.
CrossRef - Basmal J. Analysis of The Texture Profile and Sensory Quality of The Jelly with The Addition of Liquid Cork Fish (Channa striata). IOP Conf. Ser.: Earth Environ. Sci. 2021; 934.
CrossRef - Poiana M. A., Munteanu M. F., Bordean D. M., Gligor R.Alexa E. Assessing the effects of different pectins addition on color quality and antioxidant properties of blackberry jam. Central J. 2013; 7: 1–13.
CrossRef - Food Standards Australia New Zealand. Guidelines for the microbiological examination of ready-to-eat foods. 2001. Retrieved 28 December 2021 from, http://www.foodstandards.gov.au/_srcfiles/Guidelines%20for%20Micro%20exam.pdf
- Shigihalli S., Vijayalakshmi K. G., Joshi N., Deshapande B. Acceptability and shelf-life studies on ivy gourd jelly. Pharmacog. Phytochem. 2018; 7(6): 2769-2774.
- Gaikwad S. U. Studies on preparation of sapota (Manilkara achras (Mill.) Fosberg): beetroot (Beta vulgaris) blended jelly. M.Sc. (Phm) Thesis, India, 2016.
- Panchal J. B., Gaikwad R. S., Dhemre J. K., Chavan U. D. Studies on preparation and storage of jelly from dragon fruit (Hylocereus undatus). J. Pharmacog. Phytochem. 2018; 7(4): 2648-2655.

This work is licensed under a Creative Commons Attribution 4.0 International License.


