Functional and Biochemical Properties of some Economically Important Edible Seaweeds
 , Pratibha Kushwaha and K. Suresh Kumar*
 Department of Botany, University of Allahabad, Prayagraj, U. P.
Corresponding Author E-mail: ksuresh2779@allduniv.ac.in
DOI : http://dx.doi.org/10.12944/CRNFSJ.10.2.32
Download this article as:
![]()
We evaluated the functional properties and nutritional composition of six dried commercially valuable edible seaweeds Porphyra sp., Undaria pinnatifida, Saccharina sp., Hizikia fusiformis, Gracilaria sp., and Sargassum sp. in the current study. The proximate composition of the dried seaweeds revealed that Porphyra sp. had a high total crude protein content (38.58 ± 0.16 %) followed by Undaria sp. (23.03 ± 0.30%), Saccharina sp. (11.39 ± 0.09%), H. fusiformis (18.77 ± 0.01%), Gracilaria sp. (18.30 ± 0.13%), and Sargassum sp. (13.56 ± 0.04%). Fatty acid profiling showed high MUFA content in Sargassum sp. (1.09 %); this seaweed also contained 0.84% saturated fatty acid and 0.48% PUFA. On the other hand, U. pinnatifida was rich in macro elements (297.57 ± 11.09 mg/100g) and Gracilaria sp. had high micromineral content (6397.35 ± 89.42 µg/100g). Functional properties of the powdered seaweed were also evaluated. The water–holding capacity of Porphyra sp. (8.82 ± 0.40 g water/g algal sample) was better than H. fusiformis (6.22 ± 0.30 g water/g algal sample). Oil holding capacity of Gracilaria sp. (3.23 ± 0.08 g oil/g algal samples) was higher than U. pinnatifida (1.92 ± 0.22 g oil/g algal sample). Further, H. fusiformis had a good foaming capacity (38.0 ± 2.0 %). Based on the results obtained herein, it could be summarized that the seaweeds studied were nutritionally rich (containing minerals that are vital for human health), and could be used as a functional food and in various food formulations.
KEYWORDS:Food; Functional; Mineral Composition; Proximate Composition; Seaweeds
Introduction
Depleting natural resources and increasing population has awakened concerns towards human health globally. While population rise has caused a hike in the demand for food grain production, the emerging climatic change and lack of availability of land, impede production of adequate terrestrial food crop. With the rise in consumer awareness, people seek a healthy, wholesome diet with optimum nutrition. This has led to an amplified interest in carrying out fundamental research to seek novel functional foods (i.e. foods that have health benefits apart from basic nutrition). In attempts to search for novel alternative foods, people have diverted their attention from terrestrial crops to seafood products. The sea offers a range of edible products ranging from fish to algae.
Seaweeds are a group of marine photosynthetic macroscopic algae that are abundantly found in the ocean. They are categorized into three main classes or phyla: Chlorophyceae (green algae), Phaeophyceae (brown algae), and Rhodophyceae (red algae)1. Seaweeds are an integral part of the coastal ecosystems and support marine life. Due to their ubiquitous presence and nutritional benefits, seaweeds have been used in food, cosmeceutical, pharmaceutical, and nutraceutical industries. Out of the 630 species of marine algae available, nearly 250 seaweeds have been commercially used worldwide. However, approximately 150 species are favourably consumed by humans as food2. For example, seaweeds have been traditionally consumed as food or medicine in Asian countries like Japan, Korea, and China3. Porphyra sp., Laminaria sp., and Undaria sp. are the most recognized seaweeds are used for human consumption.
Seaweeds produce a plethora of bioactive compounds including terpenes and phenolics4. They contain polysaccharides such as agar, alginates, and carrageenans. Apart from their low–calorie content, seaweeds (or macroalgae) are important marine bio–resources that contain proteins, peptides, beneficial amino acids, dietary fibres, health–promoting bioactive compounds, and polyunsaturated fatty acids (PUFAs)5-7. Seaweeds are an outstanding source of vitamins A, B1, B12, and C; additionally, they also contain water–soluble and liposoluble vitamins such as b–carotene, riboflavin, thiamine, and tocopherol8. While their functional properties and biochemical composition make seaweed products nutritionally rich, their natural abundance make them economic. Functional foods containing seaweed–derived components have several pharmacological properties (antibacterial, anticancer, antioxidant, gut health benefits, and neuro-protective effects) that are reported to prevent or cure diseases 9,10. Seaweeds are regularly exposed to sunlight in the marine environment; this explains the fact that they contain antioxidants including vitamins and pigments. The marine environment helps the seaweeds acquire their high content minerals (8–40% DW). Seaweeds are an abundant natural source of essential minerals macronutrients and micronutrients such as sodium, calcium, magnesium, potassium, chloride, sulphate, phosphorus, iodine, zinc, iron, copper, selenium, molybdenum, fluoride, boron, and nickel11. Forming a significant part of daily food in Asia, seaweeds are particularly consumed in South Korea as they help fulfil the daily essential minerals and trace elements intake requirement12, 13. Nevertheless, minerals composition of the seaweeds depends upon season, geographical conditions, species, sampling conditions, physiological variations, processing, etc.14, 15. Being a primary source of iodine, they could fulfil the daily iodine requirement (150 mg/day)16. The enigma of obesity, as well as, vitamin and mineral deficiency, has become a health rife in Europe, USA, and Australia17. Global dietary studies report that countries, where seaweed is consumed on a regular basis, have less diet–related diseases and obesity 18.
Fundamental functional properties such as emulsification capacity, foaming capacity, as well as, oil and water holding capacity of the ingredients, maintain the texture modification, colour control, and whipping properties of a food product. Seaweed biomass and protein offer various functional and nutritional properties that help its utility as a food ingredient or in functional foods. Functional property of a product (i.e. water/oil holding capacity, foaming capacity, nitrogen solubility, and, emulsifying stability) determines its utility in the food, pharmaceutical or cosmetic industry. These functional properties however depend on various factors such as temperature, pH and salinity19. The objective of the present study is to investigate the functional and biochemical properties of the economically important seaweeds, considering their use as a functional food.
Materials and method
Sample preparation
Two seaweed samples (Gracilaria sp., Saragassum sp.) were collected from Mandapam coast (9.28°N 79.12°E) Tamil Nadu, while seaweeds Undaria pinnatifida, Hizikia fusiformis, Saccharina sp. and Porphyra sp. were purchased from a commercial market in Wando Island, South Korea. The dried seaweed samples that were brought to the laboratory, washed with distilled water to remove epiphytes, and re-dried under the sunlight. The sun–dried seaweeds were oven-dried (40o C, 24 h; or until they had a constant weight). After this, the dried moisture–free samples were pulverized and sieved to obtain a nearly uniform particle size (0.5 mm). The milled seaweed samples were then stored in an airtight container at room temperature and used for further experimentation.
Protein content
The percentages of crude protein in the milled seaweed biomass was calculated. For this, the nitrogen content (determined using a CHN elemental analyser, EuroVector EA 3000) of each sample was multiplied by a factor of 6.25.
Water (WHC) and Oil-holding capacity (OHC)
Water–holding capacity (WHC) and oil–holding capacity (OHC) of the seaweed samples were determined according to the procedure of Kumar et al.19. Here, 100 mg seaweed powder was mixed with 1.5 mL of distilled water or coconut, mustard, sunflower oil respectively in pre–weighed tubes and centrifuged at 12000 x g for 30 min. The supernatants obtained were thereby decanted and the centrifuge tubes containing sediment were weighed. WHC and OHC were expressed as grams of water or oil held by 100 mg of algal biomass by using the formula mentioned below.
WHC/OHC g H2O or oil/g biomass= {(W2 − W1)/W0} × 100
where,
W0 is the weight of the dry biomass sample (g), W1 is the weight of the tube plus the dry biomass sample (g), while, W2 is the weight of the tube plus the sediment (g).
Foaming Capacity and Stability
The foaming capacity and foaming stability of the seaweed biomass were determined by a modified method of Nath et al.20 For this, a 10 ml solution of the algal biomass (100 mg, 250 mg, 500 mg) was vortexed (5 min, 2000 rpm, room temperature) and transferred to a measuring cylinder. The increase in volume was expressed as percent foaming capacity.
![]()
where, V1 is the volume of biomass solution before whipping, and V2 is the volume of biomass solution after whipping.
The foam stability was determined by measuring the decrease in foam volume as a function of time at intervals of 30 min (up to a period of 90 min).
![]()
Biochemical composition of seaweeds
Ash Content Analysis
The ash content was determined by placing the dried seaweed powder in an oven (80 °C, 1 h). A gram of this powdered sample (accurately measured) was then placed in a pre- weighed crucible and ashed in muffle furnace (550 °C, 6 h to a constant weight). The ash obtained was allowed to cool down to room temperature in a desiccator and subsequently quantified gravimetrically21.
Mineral analysis using inductively coupled plasma Mass spectroscopy (ICP-MS)
Dried seaweed (1g) was ashed and cooled (as mentioned above). The ash obtained was moistened with 10 drops of distilled (Milli-Q) water (in a crucible) and carefully dissolved in 3 ml HNO3 (1:1 v/v), followed by heating at 100–120 °C until the solution totally evaporated. Thereafter, the crucible was again placed in a furnace for ashing for 1 h at 550°C, followed by which the samples in the crucible were cooled. Subsequently, the ash obtained was dissolved in 3ml of 10 M HCl (1:1 v/v), and the solution was filtered using a Millipore syringe filter (0.25µm) into 50 ml volumetric flask and 2 ml 0.1N HCl was added to the filtrate and the final volume was made up to 50 ml using distilled water (Milli–Q) 22. This solution was sent for mineral analysis using inductively coupled plasma atomic mass spectroscopy (ICP–MS, Perkin–Elmer, Optima 2000).
Fatty acid analysis
The fatty acid analysis was determined by using the fatty acids methyl esters (FAMEs) extraction method of Levy et al.23 Fat extraction was carried using the soxhlet method for oil extraction. Gas chromatography–mass spectrometry [Agilent: GC: (G3440A) 7890A.MS MS: 7000 Triple Quad GCMS] equipped with Mass spectrometry detector was used.
Vitamin analysis
Fat–soluble vitamins
In order to determine the fat-soluble vitamins, the following procedure was carried out. Exactly 2 g of dry seaweed sample was taken in a 250 mL flask followed by addition of 10 ml Vitamin C (10 mL of 1.5 g vitamin C in 0.1 L ethanol). This solution was mixed thoroughly. Thereafter, 2.5 ml of aqueous potassium hydroxide (i.e. 250 g solid KOH in 200 mL water) was added. The flask was placed in a water bath (53 °C ± 2 °C). After shaking and saponification for about 45 min, the flask was immediately cooled to room temperature. The saponification liquid along with a bit of water was transferred to a 500 mL separating funnel. Thereafter, 100 mL petroleum ether was added, followed by gentle shaking. The aqueous phase was transferred to another 500 mL separating funnel and the second extraction was carried out in the manner mentioned before. The ether was filtered and dehydrated with anhydrous sodium sulphate. Thereafter, it was evaporated to near dryness on a rotary evaporator at 40 °C ± 2 °C under nitrogen. Methanol was used to transfer the residue to a 10 mL volumetric flask 2 mL. The residue was thereafter brought to a constant volume with methanol followed by thorough mixing (shaking). The solution was passed through a 0.22 μm filter and stored until further testing.
Water–soluble vitamins
Seaweed sample (10 gm) was weighed in a screw–capped conical flask and dissolved in 10–15 mL of water; the flask was covered with an aluminium foil. Thereafter, 10 mL of 0.1N hydrochloric acid was added followed by thorough mixing. The sample was heated for half an hour over a boiling water bath and stirred frequently. The sample was then cooled in a basin of water and pH adjusted to 4–4.5with 2.5M sodium acetate solution. The extract was then moved into a 100 mL volumetric flask (the volume was adjusted using distilled water). After shaking well, a portion of the extract was filtered through 0.22 μm membrane filter. Nearly 20 μl of the filtrate was injected into a LC–MS. Known concentrations of a mixture of standards were used as for comparison.
Statistical analysis
One–way analysis of variance (one–way ANOVA) was carried out to confirm significant differences in response at p< 0.05.
Result and Discussion
Seaweeds are known to demonstrate intriguing nutritional characteristics depending on particularly on species and environmental conditions. The seaweeds investigated in our study had unique biochemical composition.
Total protein content
The protein content of seaweeds investigated ranged from 11.4–38.58 % DW (dry weight) and showed significant differences between species (P˂0.05). Fleurence24 reported a protein content of 10–47% DW in case of red and green seaweeds. In our investigation, Porphyra sp. (38.58 ± 0.16 %), Undaria pinnatifida (23.03 ± 0.30%), Saccharina sp. (11.39 ± 0.09%), Hizikia fusiformis (18.77 ± 0.01%), Gracilaria sp. (18.30 ± 0.13%) and Sargassum sp. (13.56 ± 0.04) had distinct total protein contents.25 report the crude protein of dried Porphyra sp. was to be 42.99 ± 0.051% DW, which was slightly lower than that obtained for Porphyra sp. in our study (38.58 ± 0.16 %). As evidenced in our studies and in other reports, the protein content of seaweed varies with species; for example Bryopsis corticolans (38.20%), Sirophysa listrinodis (14.64%) and Galaxaura rugosa (17.82 %), Kappaphycus alvarezii (18.16 ± 0.03%), Caulerpavera velensis (7.77 ± 0.59%), Caulerpa scalpelliformis (10.50 ± 0.91%), Caulerpa racemosa (12.88 ± 1.17%), Plocamium brasiliense (15.72%), Laminaria japonica (9.1%), Ochtodes secundiramea (10.1%), Palmaria palmate (13.5%), Sargassum oligocystum (5.63%)and Ulva rigida (17.8%), have distinct protein content26, 27, 19, 28 . However, the total protein content of the same species collected at different locations and time also vary; for example, Garcia–Vaquero et al. (2016)29reported protein content of H. elongata to be 6.5 ± 0.7 % DW while Cofrades et al.30 reported protein content of 5–11% DW for the same species. Differences in seasonality and growth conditions in the environment31 could be the cause of variation in protein content of seaweeds.
Water – Holding Capacity (WHC)
At ambient temperature, the water–holding capacity of Porphyra sp. was 8.82± 0.40 g water/g sample (Figure 1). This was higher than the U. pinnatifida (7.991 ± 0.245g water/g sample), Gracilaria sp. (7.67 ± 0.30g water/g sample), Sargassum sp. (6.91 ± 0.15g water/g sample), Saccharina sp. (6.59 ±0.23g water/g sample) and H. fusiformis (6.22 ± 0.30g water/g sample). It is essential to note that sparse researches have been conducted on seaweeds for their WHC, especially whole seaweed powder. WHC values for certain powdered seaweeds reported previously include: Hypnea charoides (10.9–12.4 g water/g sample), Hypnea japonica (11.8–14 g water/g sample), Ulva lactuca (8.68-316 9.71 g water/g)32 and U. pinnatifida (19–44 g water/g sample)33; however, these values are higher than the values obtained in our study. The WHC of Sargassum tenerrimum 34 is reported to vary with temperature (13.5g and 15.5g water/g dry matter at 25°C and 37°C respectively). However, WHC of the protein concentrate from H. elongata29 has been reported to be 10.27±0.09 g water /g protein concentrate. K. alvarezii seaweed extracts have WHC value of 2.22±0.04 g water/g protein19.
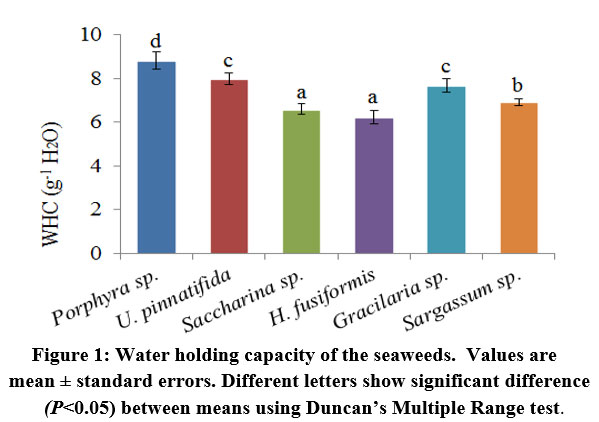 |
Figure 1: Water holding capacity of the seaweeds. Values are mean ± standard errors. Different letters show significant difference (P<0.05) between means using Duncan’s Multiple Range test. |
Water–holding capacity and oil–holding capacity of products determine their application in food products (e.g. as a texture enhancer); they also determine the suitability of a product to improve viscosity of food formulations. If a product has a capacity to hold water without dissolution of protein and provides thickening and viscosity, it is said to have a good WHC. A high WHC value aids in maintaining freshness and moist mouth-feel of baked foods; moreover, it is also associated with reduced moisture loss in packed bakery goods. Viscous food products, like sausages, custards, dough, and baked products, require high WHC values. Nevertheless, researchers35 advocate that the physicochemical properties of seaweed powder could be assumed to reflect its fibre content. As the seaweed samples investigated here demonstrated good WHC, they could be explored for their utilization in food products.
Oil Holding capacity (OHC)
The oil holding capacity essentially determines the utility of food ingredients in formulated food and cosmetics. High OHC is essential for flavour retention, and improving the palatability of products36. In our study, the OHC of Gracilaria sp. was the highest (3.22 ±0.08 g oil/g sample), while U. pinnatifida showed least OHC values (1.98 ± 0.22g oil/g sample; Figure 2). Fat absorption capacity of Sirophysa listrinodis and Polycladia myrica extracts are reported to be 2.26 ± 0.22 and 2.65 ± 0.11 g oil/g sample37 respectively. K. alvarezi powder TM is reported to have a OHC of 5.11 ± 0.36 g oil/g) 38. However, Kumar et al. (2014)19 obtained OHC values for protein concentrate of K. alvarezi (1.29±0.20 g oil/g). OHC of H. elongata protein concentrate29 to be 8.1±0.07 g oil / g.
The OHC of the food ingredients that are incorporated in formulated food essentially determines its use. Appropriate interactions of water and oil with proteins indirectly affect the flavour and texture of foods. Food processing methods have significant an influence on protein conformation and hydrophobicity. High oil absorption/holding is indispensable for the formulation of foods such as cake batters, sausages, salad, and mayonnaise 39. The ability of a product to bind fat is very vital, especially if it is being used in meat replacers or extenders40.
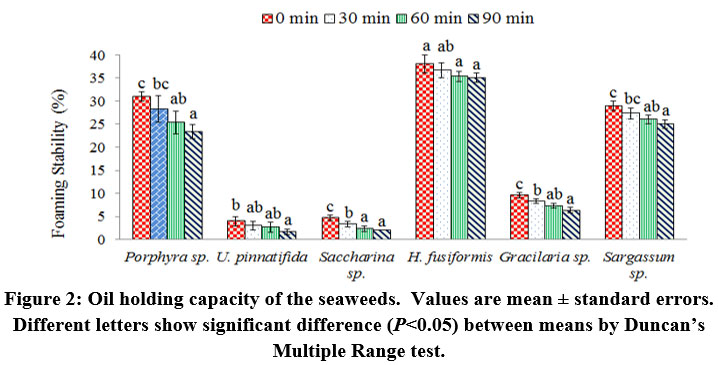 |
Figure 2: Oil holding capacity of the seaweeds. Values are mean ± standard errors. Different letters show significant difference (P<0.05) between means by Duncan’s Multiple Range test. |
Foaming Capacity and Stability
The foaming capacity of the seaweeds examined in the present study, not only depended on the mass used but also on time (Figure 3). Saccharina sp.shows the lowest foaming capacity (2.66 ± 0.57 %), while highest FC found recorded in case of H. fusiformis (38.0 ± 2.0 %), followed by Porphyra sp. (31.0 ± 1.0 %), Sargassum sp. (29.0± 1 %), Gracilaria sp. (11.0 ± 1.0 %) and U. pinnatifida (9.6 ± 0.5 %) respectively.
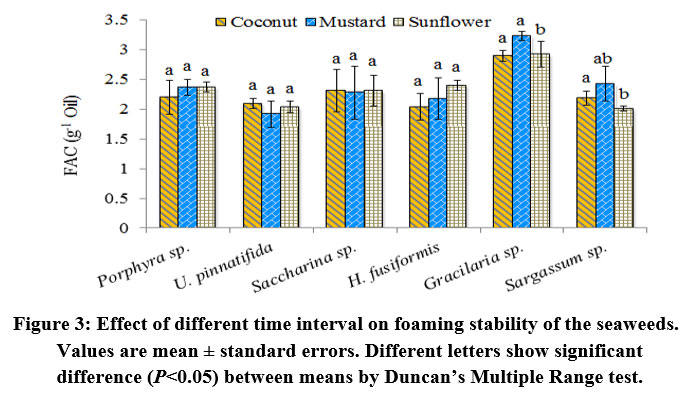 |
Figure 3: Effect of different time interval on foaming stability of the seaweeds. Values are mean ± standard errors. Different letters show significant difference (P<0.05) between means by Duncan’s Multiple Range test. |
The basic necessities for algal biomass to be a good foaming agent include: (i) the ability to undergo rapid conformational changes at the interface, and (ii) the ability to rapidly adsorb at the air–water interface during bubbling. Kumar et al.19 observed that the protein concentrate K. alvarezii showed the lowest FC (38 ± 2%) at pH 6.0, and highest FC (53.33 ± 2.31%) at pH 4.0; this value was slightly lower than that of E. compressa (55.0 ± 2.6%)41 and much lower than the fenugreek protein concentrate i.e. 89.5% 42 which is much higher than FC of E. linza (33.3 ± 5.7%) and E. tubulosa (31.9 ± 2.7%) 41.
In our study, maximum foaming stability (FS) found in case of Porphyra sp. (28.33 ± 2.89%), H. fusiformis (36.67 ± 1.52 %) and Sargassum sp. (27.33 ± 1.15 %), recorded after 30 min at pH 6.0, was higher than that reported for E. tubulosa and E. linza (16.7 ± 1.5% and 4.4 ± 2.0% respectively)41. Stable foams are vital for the production of a variety of foods. The foaming property usually depends on the source, method of foaming, temperature, pH, mixing time, processing parameters, etc. Among the various factors influencing foaming capacity (FC), the type of foaming equipment, method of agitation, and, speed of whipping, are also important.
Ash Content
Sea vegetables have high amount of ash as compared to terrestrial vegetables43. The ash content of a sample generally reflects its mineral content; Mushollaeni (2011)44 particularly stated that the presence of ash content in the seaweed indicated the presence of mineral salt in the sample. The ash content of the investigated seaweeds ranged from 10.33±0.58 to 50.33 ± 0.58 mg/100g DW. This high ash could be associated with high mineral elements. Highest ash content was observed in H. fusiformis 50.33 ± 0.53 mg/100g followed by Sargassum sp. 40.33±0.58 mg/100g and least in Gracilaria sp. 7.33±0.58 mg/100g. As edible seaweeds rich in minerals have significant food utility, the investigated samples do promising applications.
Mineral content
Table 1 compares the mineral content of the seaweeds Gracilaria sp., U. pinnatifid a, Saccharina sp., H. fusiformis, Porphyra sp. and Sargassum sp. studied herein; as shown, 16 minerals were analysed. Gracilaria sp. (Table 1) had high Na (136.05 ± 1.96 mg/100g DW) and low Mo content (1.03 ± 0.01 µg/100g DW). U. pinnatifida also had high Na (234.57 ± 7.96 mg/100g DW) content, but it had low Se value (0.15 ± 0.02 µg/100g). Sargassum sp. recorded high Mg (107.16 ± 9.55 mg/100g DW) content and low Se (0.38 ± 0.01 µg/100g DW) content. The Na, K, Ca, Mg and P content however differed significantly among all seaweeds studied. A comparison of macro-elements revealed that U. pinnatifid a contained high amount of minerals (Na+ K+ Ca +Mg+ P) (297.57 ± 11.09 mg/100g) than H. fusiformis (222.07 ±14.18 mg/100g), Saccharina sp. (220.69 ± 11.09 mg/100g), Gracilaria sp. (196.12 +0.07mg/100g), Sargassum sp. (157.6 ± 11.62 mg/100mg) and Porphyra sp. (132.12 ± 3.37 mg/100 g). Highest Na content was observed in Undaria sp. (234.57 ± 7.96 mg/100g) and least in Sargassum sp. (20.17 ± 0.89 mg/100g). The K content was higher in H. fusiformis (78.84 ±1.82 mg/100g) and least in the U. pinnatifida (1.25 ± 0.04mg/100g).
Table 1: Macro (mg/100g DW), Micro and trace elements(µg/100g DW) determined by ICP-MS; Below Detection Limit: the values that have a similar superscript in the same row are not significantly different (P > 0.05).
| Gracilaria sp. | U. pinnatifida | Saccharina sp. | H. fusiformis | Porphyra sp. | Sargassum sp. | ||
| mg/100g | Na | 136.05 ± 1.96e | 234.57 ± 7.96f | 121.9 ± 10.48d | 74.4 ± 9.94c | 59.92 ± 2.58b | 20.17 ± 0.89a |
| K | 7.62 ± 0.21b | 1.25 ± 0.04a | 42.89 ± 1.12e | 78.84 ± 1.82f | 28.01 ± 0.22d | 13.25 ± 0.58c | |
| Ca | 5.66±0.05e | 0.49±0.00c | 0.28±0.01b | 1.99±0.01d | 0.1±0.00a | 12.28±0.05f | |
| Mg | 42.77 ± 0.69b | 54.12 ± 2.37d | 46.35 ± 1.44b | 50.72 ± 0.81d | 22.3 ± 0.36a | 107.16 ± 9.55e | |
| P | 4.02 ± 0.07a | 7.14 ± 0.23b | 9.33 ± 0.12c | 16.12 ± 1.60d | 21.79 ± 0.21e | 4.74 ± 0.55a | |
| Total | 196.12 ± 0.07 | 297.57 ± 11.09 | 220.69 ± 11.09 | 222.07 ± 14.18 | 132.12 ± 3.37 | 157.6 ± 11.62 | |
| µg/100g | S | 81.83 ± 1.08c | 8.57 ± 0.10a | 9.18 ± 0.17a | 103.03 ± 1.56d | 24.82 ± 0.25b |
101.84 ± 13.15d |
| Cd | 1.88 ± 0.48d | 1.21 ± 0.01c | 0.18 ± 0.01a | 1.49 ± 0.01c | 1.05 ± 0.12b | 3.71 ± 1.04e | |
| Co | 6.28 ± 0.03f | 0.34 ± 0.04c | 0.05 ± 0.00a | 1.15 ± 0.00d | 0.29 ± 0.01b | 3.32 ± 0.04e | |
| Cr | 79.38 ± 2.88f | 21.58 ± 1.79a | 24.46 ± 0.87b | 59.08 ± 0.51e | 36.49 ± 0.69c | 47.56 ± 3.09d | |
| Cu | 39.77 ± 0.38f | 3.5 ± 0.20b | 1.26 ± 0.21c | 38.76 ± 1.28e | 12.58 ± 0.09c | 23.97 ± 0.11d | |
| Fe | 5331.44 ± 78.09f | 412.32 ± 22.22b | 102.39 ± 11.73a | 2914.24 ± 19.56e | 513.38 ± 79.14c | 878.25 ± 22.62d | |
| Mn | 769.04 ± 5.82f | 17.21 ± 0.82b | 9.6 ± 0.69a | 180.26 ± 2.59e | 64.09 ± 1.04c | 73.05 ± 1.26d | |
| Zn | 83.76 ± 0.47f | 57.47 ± 0.61c | 7.78 ± 0.47a | 77.61 ± 0.35e | 51.06 ± 1.14b | 66.87 ± 2.32d | |
| Hg | – | – | – | – | – | – | |
| Mo | 1.03 ± 0.01c | 0.38 ± 0.04b | 0.20 ± 0.00a | 1.02 ± 0.02c | 1.63 ± 0.01d | 2.08 ± 0.11e | |
| Se | 2.94 ± 0.18f | 0.15 ± 0.02b | 0.05 ± 0.01a | 0.45 ± 0.03e | 0.24 ± 0.01c | 0.38 ± 0.01d | |
| Total | 6397.35 ± 89.42 | 522.73 ± 25.85 | 155.15 ± 14.16 | 3377.09 ± 25.91 | 705.63 ± 82.5 | 1201.03 ± 43.75 |
Micro minerals namely Cd, Co, Cr, Cu, Fe, Hg, Mn, Mo, S, Se, and, Zn, although needed only in trace amounts, are significant in regular functioning of the human body. Among the seaweeds studied, Fe content was significantly higher in Gracilaria sp. (5331.44± 78.09μg/100g), followed by H. fusiformis (2914.24 ± 19.56 μg/100g), Sargassum sp. (878.25±22.62μg/100g), Porphyra sp.(513.38 ± 79.14 μg/100g), U. pinnatifida (412.32 ± 22.22μg/100mg), and Saccharina sp. (102.39 ± 11.73 μg/100g). Zn content of the seaweeds varied from 83.76 ± 0.47 μg/100g (Gracilaria sp.) to 7.78 ± 0.47 μg/100g (Saccharina sp.). The Se content of the six seaweeds varied from 0.05 ± 0.01 μg/100g to 2.94 ± 0.18μg/100 g, with highest content in Gracilaria sp. (2.94 ± 0.18μg/100g); the lowest Se content was observed in Saccharina sp. (0.05 ± 0.01 μg/100g).
All the six seaweeds evaluated were rich in Mn (ranging from 9.6 ± 0.69 μg/100g in Saccharina sp. to 769.04 ±5.82μg/100g in Gracilaria sp. The selected micronutrients (Cd + Co + Cr + Cu + Fe + Hg + Mn + Mo + S + Se + Zn) in Gracilaria sp. (6397.35 μg/100g) were higher than land plantsand vegetables like apple, brinjal, broad beans, cabbage, cauliflower, Lettuce, lichi, mangoripe, papaya ripe, potato, spinach, and, wood apple45. The tolerable daily intake of these elements that were established by the FAO/ WHO Expert Committee46,47,48 has been provided in table 2. It should be noted that Cd, Cu, Cr, Mo, Co and Zn are relevant elements that need to be tested when it comes to edible seaweeds; due to its potential toxicity to living organisms, absence of Hg in the seaweed is vital. The recommended daily intake of seaweeds Porphyra sp., U. pinnatifida, Gracilaria sp., Saccharina sp., H. fusiformis and Sargassum sp. were calculated and provided in Table 2 (depending upon the permissible daily dose outlined for different toxic elements46,49). Based on toxicity limits of the mentioned elements, it is recommended that not more than 12.56 g DW of Gracilaria sp., 204 g DW of U. pinnatifida, 15g DW of Saccharina sp., 230 g DW of H. fusiformis, 72.5 g DW of Porphyra sp. and 215.8 g DW of Sargassum sp. be used. These values were determined as per the tolerable daily intake of these elements provided by the FAO/WHO Expert Committee46,47,48. The results indicate the possibility of using of seaweeds as a condiment in food supplements to improve the nutritive value of food in the human diet.
Table 2: Daily recommended dose of seaweeds based on permissibility of intake of toxic elements46,49 .
| Elements | Permissibledaily dose (µg) | Recommended daily intake g per day | |||||
| Gracilaria sp. | U.pinnatifida | Saccharina sp. | H.fusiformis | Porphyra sp. | Sargassum sp. | ||
| Cd | 50-150 | 112.8 | 72.6 | 14.4 | 74.5 | 63 | 110.5 |
| Co | 200-1300 | 12.56 | 204 | 15 | 230 | 72.5 | 215.8 |
| Mo | 2-50 | 12.36 | 3.8 | 10 | 40.75 | 40.75 | 10.4 |
| Cr | 5.5-45 | 40.38 | 35 | 35 | 40.5 | 45 | 10.12 |
Fatty acid composition
The seaweed samples contained saturated, monounsaturated and polyunsaturated fatty acids. The total fat content of the seaweeds varied from 0.36 % to 2.33% (Table 3). The total saturated fatty acids ranged from 0.34 to 0.84%. The total saturated fatty acids (0.84%) content Sargassum sp. recorded in this study was lesser than the value reported by Kumari et al. (2013)50 (i.e. 49.6%).
The total fatty acid content was expressed as g/100g total fat of each sample; Porphyra sp., U. pinnatifida, Saccharina sp., H. fusiformis, Gracilaria sp., and Sargassum sp., had a fatty acid contents of 0.71 ± 0.1, 0.36 ± 0.015, 1.04 ± 0.020, 0.76 ± 0.043, 1.23 ± 0.030, 2.33 ± 0.01 g/100g respectively. The main saturated fatty acids (SFA) observed were Myristic acid (C14:0), Palmitic acid (C16:0), Steric acid (C18:0), Lauric acid (C12:0), Archidic acid (C20:0), Behenic acid (C22:0), Cis-10 Heptadecenoic acid (C17:0). Palmitic acid was the most dominant saturated fatty acid; lowest amount of palmatic acid were recorded in U. pinnatifida (0.14%) and Saccharina sp. (0.24%), while the rest of the species had higher amounts of palmataic acid. The results obtained herein are in agreement with that of Gressler et al.51 who observed palmatic acid as the dominant saturated fatty acid in seaweeds. Arachidic acid was only found in Saccharina sp., Sargassum sp., Gracilaria sp. and H. fusiformi. The differences in the fatty acids among the seaweeds are associated with species and habitat52.
Sargassum sp. had the maximum amount (1.09%) of total mono-unsaturated fatty acids (MUFA) and U. pinnatifida had the least amount of total MUFA (0.12%) (P˂0.001). The total MUFA in Sargassum sp. was lower than the range reported for seaweeds (3-56%)53. The variation in MUFA content could be as a result of exclusion of palmitoleic and eicosenoic fatty acids. In case of monounsaturated fatty acids (MUFAs), Cis-Oleic Acid (C18:1) was detected in U. pinnatifida, Saccharina sp., H. fusiformis, Gracilaria sp., and Sargassum sp. Palmitoleic acid (C16:1) was found in Saccharina sp., H. fusiformis, and Gracilaria sp.
Table 3: Fatty acid composition (%) of seaweeds; SFA: saturated fatty acids; MUFA: mono-unsaturated fatty acids; PUFA: polyunsaturated fatty acids; Values with the similar superscript in the same row are not significantly different (P > 0.05).
| Fatty acid (wt%) | Gracilaria sp. | U.pinnatifida | Saccharina sp. | H.fusiformis | Porphyra sp. | Sargassum sp. |
| SFA | 0.76 ± 0.01 | 0.34 ± 0.17 | 0.44 ± 0.02 | 0.40 ± 0.02 | 0.51±0.12 | 0.84 ± 0.01 |
| Myristic acid(C14:0) | 0.02 ± 0.003a | 0.03 ± 0.004a | 0.14 ± 0.005c | 0.05 ± 0.005c | 0.02±0.009a | 0.15 ± 0.001b |
| Palmitic acid (C 16:0) | 0.65 ± 0.002d | 0.14 ± 0.004a | 0.24 ± 0.009d | 0.33 ± 0.004d | 0.47±0.10b | 0.57 ± 0.004f |
| Steric acid(C18:0) | 0.03 ± 0.001b | 0.02 ± 0.001a | 0.04 ± 0.002b | 0.011 ± 0.003b | 0.02±0.007a | 0.06 ± 0.001d |
| Lauric acid(C12:0) | – | 0.15 ± 0.16a | – | – | – | 0.01 ± 0.001b |
| Archidic acid (C20:0) | 0.04 ± 0.001c | – | 0.02 ± 0.003a | 0.004 ± 0.002a | – | 0.01 ± 0.001b |
| Behenic acid (C22:0) | 0.02 ± 0.002a | – | – | 0.006 ± 0.001ab | – | 0.03 ± 0.001c |
| MUFA | 0.36 ± 0.02 | 0.12 ± 0.004 | 0.46 ± 0.04 | 0.29 ± 0.01 | – | 1.09 ± 0.00 |
| Cis-Oleic acid (C18:1) | 0.20 ± 0.01c | 0.12 ± 0.004 | 0.40 ± 0.030c | 0.22 ± 0.002c | – | 1.09 ± 0.00 |
| Palmitoleic acid (C16:1) | 0.02 ± 0.003a | – | 0.05 ± 0.004b | 0.06 ± 0.003b | – | – |
| Erucic acid (C22:1) | 0.14 ± 0.002b | – | – | 0.01 ± 0.001a | – | – |
| Cis-10 Heptadecenoic acid (C 17:1) | – | – | 0.01 ± 0.004a | – | – | – |
| PUFA | 0.12 ± 0.002 | 0.02 ± 0.003 | 0.18 ± 0.009 | 0.06 ± 0.003 | 0.12 ± 0.002 | 0.48 ± 0.002 |
| Cis-Linoleic acid(C18:2) | – | 0.02 ± 0.003 | 0.12 ± 0.004c | 0.06 ± 0.003 | 0.12 ± 0.002 | – |
| ϒ Linoleic acid (C18:3) | 0.09 ± 0.001 | – | 0.05 ± 0.003b | – | – | 0.09 ± 0.001 |
| Cis-11,14,17-Eicosatrienoic acid (20:3) | 0.03 0.001 | – | 0.01 ± 0.002a | – | – | 0.39 ± 0.001 |
| Total Fat | 1.23 ± 0.030 | 0.36 ± 0.015 | 1.04 ± 0.020 | 0.76 ± 0.043 | 0.71±0.1 | 2.33 ± 0.01 |
Nevertheless, Erucic acid (C22:1) was observed in H. fusiformis and Gracilaria sp.; Cis-10 Heptadecenoic acid (C17:1) was observed in Saccharina sp. in this study.
Further, the total polyunsaturated fatty acids (PUFA) included Linoleic acid and Linolenic acid. Although Sargassum sp. had the most amount of PUFA (0.48%), it was lower than the range (34- 74%) reported by Dawczynski et al. (2007)31. It has been reported that when there is a decrease in environmental temperature, algae normally accumulate PUFAs 54. Therefore, the variation in PUFA could be attributed to environmental temperature.
Incorporation of seaweed in low salt meat emulsion models is reported to increase the PUFA content55; this shows the potential of seaweeds as a substrate in food processing. In our study, estimations of PUFA revealed the following facts. Cis-Linoleic acid (C18:2) was found in Porphyra sp., U. pinnatifida, Saccharina sp., and H. fusiformis; further, ϒ-Linoleic acid (C18:3) was found in Saccharina sp., Gracilaria sp., and Sargassum sp. and Cis-11, 14, 17-Eicosatrienoic acid (20:3) was found in Saccharina sp. and Sargassum sp.
Fatty acids are of great prominence in human nutrition and health. Low intake of saturated fat and an increased PUFA-to-SFA ratio is associated with a lower risk of human coronary heart disease. Nonetheless, red seaweed Champia parvula showed long chain saturated fatty acid like eicosanoic acid in its structure56 which is also seen in Saccharina sp., Gracilaria sp. and Sargassum sp.
Vitamin content
In the marine environment, the habitat of seaweeds usually varies from species to species; many of them are often exposed to direct sunlight. Consequently, seaweeds contain many forms of antioxidants (including vitamins and protective pigments). Seaweeds contain both water- and fat-soluble vitamins (Table 4). Water soluble vitamins (Vitamin B2, Vitamin B3, Vitamin B9) and fat soluble vitamins (Vitamin E) were found in Porphyra sp., U. pinnatifida, Saccharina sp., and Sargassum sp. The Vitamin E content of Porphyra sp. and Sargassum sp. was 0.09 ±0.01 and 0.63 ± 0.01 (m/100g) respectively. The water soluble vitamins, vitamin B2 was found in Porphyra sp. (0.01 ± 0.001 mg/100g) and Undaria 0.01 ± 0.004 mg/100g). Vitamin B3 was detected in U. pinnatifida (0.02 ± 0.004 mg/100g) and Saccharina sp. (0.01 ± 0.001 mg/100g), while Vitamin B9 found in Porphyra sp. (0.006 ± 0.001 mg/100g).
Table 4: Vitamin composition of seaweeds in mg/100g
| Vitamins Profile | Seaweeds | |||||
| Fat Soluble Vitamins | Gracilaria sp. | Undaria sp. | Saccharina sp. | Hizikia sp. | Porphyra sp. | Sargassum sp. |
| Vitamin E | – | – | – | – | 0.09 ± 0.01 | 0.63±0.01 |
| Water Soluble Vitamin | ||||||
| Vitamin B2 | – | 0.01 ± 0.004 | – | – | 0.01 ± .001 | – |
| Vitamin B3 | – | 0.02 ± 0.004 | 0.01 ± 0.001 | – | – | |
| Vitamin B9 | – | – | – | – | 0.006 ± 0.001 | – |
Based on previous reports, it could be said that the vitamin content of seaweeds vary based on their occurrence and species (thus values for Porphyra sp., U. pinnatifida, Saccharina sp., Gracilaria sp. and Sargassum sp. would vary). G. edulis is reported to contain 2.14 ± 0.17 mg/g vitamin A and 1.34 ± 0.10 mg/g vitamin E57. These values are lower than that obtained by us in this study. The variation in vitamin content could be due to certain environmental factors e.g. atmospheric temperature, salinity, seasonality, methods of preservation and processing. Considering that Ortiz et al.58 suggested that the daily vitamin requirements of the human body could be met by consuming 100 g of seaweeds, it is recommended to consume seaweeds to meet the daily nutritional requirement.
Conclusion
Seaweeds are nutritionally rich as they possess protein, fatty acids, minerals, and vitamins that are essential for human and animal consumption. Seaweeds also a good source of various bioactive compounds. They have therefore been used for various food applications and as a functional food. The value of the global seaweed market in 2015 was $10.4 billion and has now reached $14.7 billion in 2021. Being rich in minerals, fatty acids, vitamins, and proteins, edible seaweeds are low caloric food supplements that serve as a perfect food supplement; they could be incorporated in the daily diet, to make it balanced. As compared to the terrestrial food crops, seaweeds are abundant with trace elements, minerals, and PUFA; moreover they do not require terrestrial space for growth. These attributes, make seaweeds a healthy, consumer-friendly food commodity. They SFA/PUFA ratios lower than one which gives them an added advantage. Seaweeds are valuable and under-utilized resources, that present a variety biochemical composition (based on species). However various factors such as temperature, light, salinity, pH, seasonal variation, geography, etc. determine their biochemistry. Popularizing the utility of this product would mean providing a new opportunity for employment and income for the coastal dwellers, and thereby prove to be socioeconomically beneficial.
Acknowledgement
The authors are thankful to the Head, Department of Botany, University of Allahabad, India, for the support provided.
Conflicts of Interest
The authors declare that they have no known competing financial interests or personal relationships that could have appeared to influence the work reported in this paper.
Funding Sources
This study was supported by UGC-BSR Start-Up-Grand {Ref. No. F.30-373/2017 (BSR)} New Delhi. The author, Sushma Kumari, is thankful to NFSC Fellowship for the financial assistance provided.
Reference
- Shannon E., Abu-Ghannam N. Seaweeds as nutraceuticals for health and nutrition. Phycologia. 2019; 58(5): 563-577.
CrossRef - Subramanian G., Ambiga K. Studies on pharmaceutical and commercial significance amino acids from marine green algal species of Caulerpaceae. World J. Pharma. Res. 2017; 6(11): 844-852.
CrossRef - Koirala P., Jung H. A., Choi J. S. Recent advances in pharmacological research on Ecklonia species: A review. Pharmacol. Res. 2017; 40(9): 981–1005.
CrossRef - Santos S. A., Vilela C., Freire, C. S., Abreu M. H., Rocha S. M., & Silvestre A. J. Chlorophyta and Rhodophyta macroalgae: A source of health promoting phytochemicals. Food Chemistry. 2015; 183, 122–128. https://doi.org/10.1016/j.foodchem.2015.03.006.
CrossRef - Biancarosa I., Belghit I., Bruckner C. G., Liland N. S., Waagbo R., Amlund H., Lock E.J. Chemical characterization of 21 species of marine macroalgae common in Norwegian waters: Benefits of and limitations to their potential use in food and feed. Sci. of Food Agri. 2018; 98(5): 2035–2042.
CrossRef - Hannan M. A., Sohag A. A. M., Dash R., Haque M. N., Mohibbullah M., Oktaviani D. F., Moon I. S. Phytosterols of marine algae: Insights into the potential health benefits and molecular pharmacology. Phytomedicine. 2020; 69: Article 153201.
CrossRef - Miyashita K., Beppu F., Hosokawa M., Liu X., Wang S. Nutraceutical characteristics of the brown seaweed carotenoid fucoxanthin. Biochem. Biophy. 2020; 686: Article 108364. https://doi.org/10.1016/j.abb.2020.108364.
CrossRef - Kumar V. V., Kaladharan P. Amino acids in the seaweeds as an alternate source of protein for animal feed. Mar. Biol. Assoc. India. 2007; 49(1): 35–40. http://eprints.cmfri.org.in/id/eprint/2111.
- Sun Z., Dai Z., Zhang W., Fan S., Liu H., Liu R., & Zhao T. Antiobesity, Antidiabetic, Antioxidative, and Antihyperlipidemic Activities of Bioactive Seaweed Substances. In: Qin Y., Bioactive Seaweeds for Food Applications. 12: Academic Press. 2018; 239–253.
CrossRef - Alghazwi M., Charoensiddhi S., Smid S., Zhang W. Impact of Ecklonia radiate extracts on the neuroprotective activities against amyloid beta (Aβ1-42) toxicity and aggregation. Funct. Foods. 2020; 68: Article 103893.
CrossRef - Lorenzo J.M., Agregán R., Munekata P.E.S., Franco D., Carballo J.; ¸Sahin, S., Lacomba R., Barba F.J. Proximate composition and nutritional value of three macroalgae: Ascophyllum nodosum, Fucus vesiculosus and Bifurcaria bifurcata. Mar. Drugs. 2017; 15: 360.
CrossRef - Rioux L.E., Beaulieu L., Turgeon S. L. Seaweeds: A traditional ingredients for new gastronomic sensation. Food Hydrocol. 2017; 68: 255–265.
CrossRef - Rengasamy K. R. R., Mahomoodally M. F., Aumeeruddy M. Z., Zengin G., Xiao J., Kim D. H. Bioactive compounds in seaweeds: An overview of their biological properties and safety. Food Chem. Toxicol. 2020; 135: Article 111013.
CrossRef - Mabeau S., Fleurence J. Seaweed in food products: Biochemical and nutritional aspects. Trends Food Sci Technol.1993; 4: 103–107.
CrossRef - Rupérez P., Saura-Calixto F. Dietary fibre and physicochemical properties of edible Spanish seaweeds. Food Res. Technol. 2001; 212: 349–354.
CrossRef - Rajapakse N., Kim S.K. Nutritional and digestive health benefits of seaweed. Advances in Food and Nutrition Research.2011; 64:17–28.
CrossRef - World Health Organization (WHO). Double burden of malnutrition.https://www.who.int/nutrition/double-burdenmalnutrition/ en/. Accessed on 13 April 2019.
CrossRef - Nanri A., Mizoue T., Shimazu T., Ishihara J., Takachi R., Noda M. Japan Public Health Centre-Based Prospective Study Group. Dietary patterns and all-cause, cancer, and cardiovascular disease mortality in Japanese men and women: The Japan public health centre-based prospective study. PloS one. 2017; 12(4): e0174848.
CrossRef - Kumar K. S., Ganesan K., Selvaraj K., Rao P. S. Studies on the functional properties of protein concentrate of Kappaphycus alvarezii (Doty) Doty– An edible seaweed. Food Chem. 2014; 153: 353-360.https://doi.org/10.1016 /j.foodchem.2013.12.058.
CrossRef - Nath J. P., Rao M. S. N. Functional properties of guar proteins. J. Food Sci. 1981; 46: 1255–1259.
CrossRef - Official methods of analysis. In: Horwitz W. Association of Official Analytical Chemists, Washington, DC; 1995.
CrossRef - Kumar S. K., Ganesan K., SubbaRao P. V. Phycoremediation of heavy metals by the three-color forms of Kappaphycus alvarezii. J Haz. Mat. 2007; 143:590–592.
CrossRef - Levy I., Maxim C., Friedlander M. Fatty acid distribution among some red algal macrophytes 1. Phycol. 1992; 28(3): 299-304.
CrossRef - Fleurence J. Seaweed Protein: Biochemical, nutritional aspects and potential uses. Food Sci.Technol.1999; 10: 25-28.
CrossRef - Admassu H., Abera T., Abraha B. Proximate, mineral and amino acid composition of dried laver (Porphyra) seaweed. J. Acad. Indus. Res. (JAIR) 2018; 6(9): 149-154.
- Gressler V., Fujii M. T., Martins A. P., Colepicolo P., Mancini Filho J., Pinto E. Biochemical composition of two red seaweed species grown on the Brazilian coast. Sci. Food Agricul. 2011; 91(9): 1687-1692.
CrossRef - Kumar M., Gupta V., Kumari P., Reddy C. R. K., Jha B. Assessment of nutrient composition and antioxidant potential of Caulerpaceae seaweeds. Food Comp. Anal. 2011; 24(2), 270-278.
CrossRef - Pirian K., Jeliani Z. Z., Arman M., Sohrabipour J., Yousefzadi M. Proximate Analysis of Selected Macroalgal Species from the Persian Gulf as a Nutritional Resource. Life Sci. Res. 2020; 31(1): 1.
- Garcia-Vaquero M., Hayes M. Red and green macroalgae for fish and animal feed and human functional food development. Food Rev. Internatl.2016; 32(1): 15-45.
CrossRef - Cofrades S., López-Lopez I., Bravo L., Ruiz-Capillas C., Bastida S., Larrea M. T., Jiménez-Colmenero F. Nutritional and antioxidant properties of different brown and red Spanish edible seaweeds. Food Sci. Technol. Internatl. 2010; 16(5): 361-370.
CrossRef - Dawczynski C., Schubert R., Jahreis G. Amino acids, fatty acids, and dietary fibre in edible seaweed products. Food Chem. 2007;103(3): 891-899.
CrossRef - Wong K.H, Cheung P.C.K. Nutritional evaluation of some subtropical red and green seaweeds. Part I. Proximate composition, amino acid profiles and some physico-chemical properties. Food Chem. 2000; 71: 475–482.
CrossRef - Suzuki T., Ohsugi Y., Yoshie Y., Shirai T., Hirano T. Dietary fiber content, water-holding capacity and binding capacity of seaweeds. Sci. 1996; 62(3): 454-461.
CrossRef - Raj A., Ganasundari G., Mala K., Prakash A. Preliminary physico-chemical properties of marine macroalga Sargassum tenerrimum (J. Agardh) (Fucales, Sargassaceae). Internatl. Res. J. Chem. 2015; 11.
- Fleury N., Lahaye M. Chemical and physico-chemical characterisation of fibres from Laminaria digitata (kombubreton): A physiological approach. J. Sci. Food Agri. 1991; 55(3): 389-400.
CrossRef - Tiwari B., Tiwari U., Mohan R. J., &Alagusundaram K. Effect of various pre-treatments on functional, physiochemical, and cooking properties of pigeon pea (Cajanuscajan L.). Food Sci. Technol. Internatl. 2008; 14(6): 487–495.
CrossRef - Etemadian, Y., Shabanpour, B., Ramzanpour, Z., Shaviklo, A. R., Kordjazi, M. Studies on the functional properties of water extracts of the brown seaweeds Sirophysalistrinodis and Polycladiamyrica. J. Appl. Phycol. 2018; 30(3):1989-1999.
CrossRef - Ramli, N., Daik, R., Yarmo, M., Ajdari, Z. Nutritional study of Kapparazii powder ™ as a food ingredient. J. Appl. Phycol. 2014; 26(2): 1049–1055.
CrossRef - Chandi G. K., Sogi D. S. Functional properties of rice bran protein concentrates. J. Food Engin. 2007; 79: 592–597.
CrossRef - Ogunwolu S. O., Henshaw F. O., Mock H. P., Santros A., Awonorin S. O. Functional properties of protein concentrates and isolates produced from cashew (Anacardiumoccidentale L.) nut. Food Chem. 2009; 115: 852–858.
CrossRef - Ganesan K., Kumar K. S., SubbaRao P. V. Salt- and pH-induced functional changes in protein concentrate of edible green seaweed Enteromorpha species. Fish. Sci. 2012; 78: 169–176.
CrossRef - El-Nasri A. H., El-Tinay A. H. Functional properties of fenugreek (Trigonellafoenumgraecum) protein concentrate. Food Chem. 2007; 103: 582–589.
CrossRef - Thennarasan S., Murugesan S. Biochemical composition of marine brown alga Lobophoravariegata from Mandapam in the South East Coast of Tamil Nadu. Int. J. Pharm. Sci. 2015; 5: 25-29.
- Mushollaeni W. The physicochemical characteristics of sodium alginate from Indonesian brown seaweeds. Afri. J. Food Sci. 2011; 5(6): 349-352.
- Seal T. Antioxidant activity of some wild edible plants of Meghalaya state of India: A comparison using two solvent extraction systems. Internatl. J. Nutri. Metabol. 2012; 4(3): 51-56.
CrossRef - Concon J. M. Food Toxicology. Part A. Concon J. M. Principles and Concepts, Part B: Contaminants and Additives. New York, Basel: Marcel Dekker Inc. 1988; 1049–1073.
- U. S. EPA IRIS: Integrated risk information system. Englewood, CO: U.S. Environmental Protection Agency, Micromedex, Inc.1996.
- World Health Organization. Guidelines for Drinking Water Quality: Health Criteria and other Supporting Information (Vol. 2) (2nd Ed.). Geneva: World Health Organization.1996.
- Phaneuf D., Cote I., Dumas P., Ferron L. A., LeBlanc A. Evaluation of the contamination of marine algae (seaweed) from the St. Lawrence River and likely to be consumed by humans. Environ. Res. Sec. A. 1999; 80: S175–S182.
CrossRef - Kumari P., Kumar M., Reddy C. R. K., Jha B. Algal lipids, fatty acids and sterols. In Functional ingredients from algae for foods and nutraceuticals. Woodhead Publishing. 2013; 87-134.
CrossRef - Gressler V., Yokoya N. S., Fujii M. T., Colepicolo P., Mancini Filho J., Torres R. P., Pinto E. Lipid, fatty acid, protein, amino acid and ash contents in four Brazilian red algae species. Food Chem. 2010; 120(2): 585-590. https://doi.org/10.1016/j.foodchem.2009.10.028.
CrossRef - Khotimchenko S. V., Vaskovsky V. E., Titlyanova T. V. Fatty acids of marine algae from the Pacific coast of North California. Bot. Mar. 2002; 45(1): 17-22. DOI: https://doi.org/10.1515/BOT.2002.003.
CrossRef - Van Ginneken V. J., Helsper J. P., de Visser W., van Keulen H., Brandenburg W. A. Polyunsaturated fatty acids in various macroalgal species from north Atlantic and tropical seas. Lipids Heal. Dis. 2011; 10(1): 594-619.
CrossRef - Kayama M., Iijima N., Kuwahara M., Sado T., Araki S., Sakurai T. Effect of water temperature on the fatty acid composition of Porphyra spp. Nippon Suisan Gakkaishi. 1985; 51(4): 680-687. https:/doi.org/10.1016/j.2009.11.006.
CrossRef - López-López I., Bastida S., Ruiz-Capillas C., Bravo L., Larrea M. T., Sánchez-Muniz F., Jiménez-Colmenero F. Composition and antioxidant capacity of low-salt meat emulsion model systems containing edible seaweeds. Meat Sci. 2009; 83(3): 492-498.
CrossRef - Kumar V. R., Subbiah M., Ganesan A.R., Recovery of aliphatic fatty acids from red seaweed Champiaparvula (C. Agardh) and its antifungal action. J. Aquat. Food Prod. Technol. 2019; 28(9): 922-932.
CrossRef - Sakthivel R., Devi K. P. Evaluation of physicochemical properties, proximate and nutritional composition of Gracilaria edulis collected from Palk Bay. Food Chem. 2015; 174: 68-74.
CrossRef - Ortiz J., Romero N., Robert P., Araya J., Hernandez J. L. Bozzo C. Dietary fiber, amino acid, fatty acid and tocopherol contents of the edible seaweeds Ulva lactuca and Durvillaea antarctica. Food Chem. 2006; 99: 98-104.
CrossRef
Accepted on: 10 June 2022
Second Review by: Divyang Solanki India
Final Approval by: Dr. Adele Papetti


Web of Science Coverage
Emerging Sources Citation Index (ESCI)
2024 Journal Impact Factor: 1.1
Scopus Journal Metrics
CiteScore 2025: 2.6
CiteScore Details
Sustainable Nutrition: Food Systems, Nutrient Retention, and Public Health Impact
![]()
This journal is a member of, and subscribes to the principles of, the Committee on Publication Ethics (COPE)


