Cheese Whey Catalytic Conversion for Obtaining a Bioactive Hydrolysate With Reduced Antigenicity
1Federal Research Centre “Fundamentals of Biotechnology” of The Russian Academy of Sciences 119071, Russia, Moscow, Leninskiy Prospekt, 33, bld. 2 2Federal State Budgetary Scientific Institution “All-Russian Research Institute of Dairy Industry” 115093, Russia, Moscow, Lusinovskaya str., 35, bld. 7.
Corresponding Author Email: snowsurfers1@gmail.com
DOI : http://dx.doi.org/10.12944/CRNFSJ.4.Special-Issue-October.24
Download this article as:
![]()
Bioinformatics was used to design a procedure for industrial enzymatic proteolysis of cheese whey. The specificity rules for commercial enzymes were applied to in silico proteolysis of cheese whey proteins. The pattern of antigens was considered, along with molecular descriptors of bitter taste, antioxidant capacity, and anti-hypertensive activity.
The main objective was to obtain hydrolysates with reduced antigenicity and satisfactory sensory properties; an additional goal was to characterize their bioactivity profiles.
Protamex/Alcalase mixtures were first used as multienzyme compositions to obtain non-bitter cheese whey hydrolysates. The multifactor optimization performed for degree of hydrolysis, free amino acid content, and residual antigenicity has revealed the optimal Protamex/Alcalase ratio of 3.5:0.5 and the optimal hydrolysis duration of 90 min.
The hydrolysate obtained using Protamex/Alcalase 3.5:0.5 mixture had a double antioxidant capacity and a 15 times lower ACE-I inhibition concentration IC50 compared to cheese whey concentrate, and an 11 times lower β-LG residual antigenicity.
KEYWORDS:cheese whey hydrolysis, bioinformatics, debittering, β-lactoglobulin antigenicity. † DH – degree of hydrolysis; FAAC – free amino acid content; RA – residual antigenicity; BT – bitter taste points
Introduction
Diary industry produces over 285 million tons of milk annually1. Cheese whey represents about 85-95% of the milk volume and retains 55% of milk nutrients (Siso, 1996). Among the most abundant of cheese whey nutrients are lactose (4.5-5% w/v) and soluble proteins (0.6-0.8% w/v). Several possibilities for cheese whey exploitation have been assayed. Approximately half of its total volume is treated and transformed into various food products, which results in annual production of 0.5 million tons of condensed cheese whey and 2.5M tons of dry cheese whey2. The other half is discarded as effluent. The industrial approaches to whey processing include condensation, ultrafiltration, electrodialysis, reverse osmosis, and reagent complexation. The resulting whey concentrate preparations are highly variable in their composition, depending on cheese production technology3.
Whey concentrates can be further transformed to peptide mixtures by fermentation or enzymatic hydrolysis. Enzymes are more widely used due to the evident advantage of low process diration (0.5-4 hrs versus 24-72 hrs for fermentation). The important limitations for whey hydrolysis conditions are pH > 7.5 and temperature above 40°C – the conditions of reversible dissociation of β-LG, the major milk allergen, from dimeric to monomeric form4. Further increase of pH to 8.0 leads to denaturation of whey proteins. The pH can be reduced to 7.0 to better control the hydrolysis process using low-specific proteases, such as Alcalase.
The enzymatic hydrolysis of milk proteins can be directed to create milk products with reduced antigenicity. Intolerance to bovine milk proteins is the most common (70-80 %) type of food allergy: prolonged use of milk-products in this case can lead to failures in the immune system and result in dermatitis and bronchial asthma. One more problem related to cheese whey hydrolysis is bitter taste minimization5. Ultra-filtration itself6, as well as other technological approaches7, can be used to remove bitter peptides. The degree of hydrolysis should be controlled at low levels, since high degree of hydrolysis, short peptide content (3-9 a.a.) and high content of free amino acids are often reported as related to bitterness6,8. The challenge is to combine the anti-allergenic potential of low-selectivity enzymes with rational design of hydrolysis conditions to control the sensory properties.
The additional objective is the production of added-value products with broad bioactivity profiles. Various types of biological activity are described for cheese whey products, among which antioxidant capacity, anti-hypertensive activity, and antimicrobial activity are the most often reported9. The approaches to obtain hydrolysates with enhanced functional properties consist in optimization of hydrolysis parameters, including multifactor statistical analysis10. Rational design of multienzyme composition using the enzyme specificity rules allows obtaining hydrolysates with desired properties5,9 and also preventing the release of allergens.
The principles of experiment design described in this paper were previously used to devise a multienzyme composition for poultry processing leftovers hydrolysis, to obtain a hydrolysate with low antigenicity and high antioxidant capacity, and to optimize protein recovery11. Also, a fermented milk product Biokefir was produced by 20 % replacement of milk proteins with whey hydrolysate obtained using Protamex (2.5 – 4% E/S)12. Two-week daily consumption of Biokefir improved the health state of 20 children in the age 3 to 16 years with mild manifestations of food allergy to bovine milk protein in the form of atopic dermatitis in a remission stage.
The aim of the present work was to find optimal conditions of cheese whey hydrolysis using bioinformatic design for simultaneous debittering and antigenicity minimization, and to characterize the hydrolysates obtained.
Materials and methods
Whey concentrate was produced from dry cheese whey from semi-hard cheese production with demineralization level 70%. The protein content in cheese whey concentrate was 3.8%.
Dry cheese whey was diluted with 14 parts of warm (45-50 ºC) water and stirred at 45±2°C for 1 hr, and then pasteurized at 85ºC for 20 s using a conveyer system. The pasteurized whey was ultra-filtered on membrane elements with molecular weight cutoff 5 kDa at 3-6 Bar to obtain whey concentrate (concentration factor 5, total protein content 4%, pH 5.37). The concentrate was heated at 50-54°C for 10 min, then pH was adjusted to 7.0 using 5M NaOH.
Alcalase 2.4L and Protamex 1.5MG were obtained from Novozymes (Denmark). 2,2’-azino-bis-(3-ethylbenzothiazoline-6-sulphonic acid) diammonium salt (ABTS), and 6-hydroxy-2,5,7,8-tetramethyl chroman-2-carboxylic acid (Trolox) were purchased from Sigma–Aldrich (USA).
Enzymatic hydrolysis
Protamex and/or Alcalase 2.4L (0.5 – 4.0 mg/ml) were added to 200 ml of cheese whey concentrate (protein concentration 0.04 g/ml), and the mixture was stirred for a variable period (30, 60, or 90 min) at variable temperature (45, 50, or 55°C) at 24 rpm. The enzymes were inactivated at 80-84°C for 10 min.
Design of hydrolysis experiment
The proteolysis experiment was designed with a view to obtain peptide mixtures with satisfactory organoleptic properties, low antigenicity and enhanced bioactivity5. The known bovine milk epitopes13-15, the amino acid descriptors of bitterness16-19, ACE-inhibitory20-22 and antioxidant activity descriptors14, 23-27 (Tab. 1) were applied to the sequences of cheese whey proteins, and the cleavage rules for various enzymes (Tab. 2) were used in silico to select the appropriate proteases for the directed hydrolysis. The fragments of in silico hydrolysed b-LG, α-Lactalbumin, and Serum Albumin were considered bitter peptides or antioxidant peptides if two or more bitterness-encrypting or redox-active amino acids were present, respectively. Anti-hypertensive fragments longer than 3 a.a. were determined according to the model of Sagardia et al.21; short anti-hypertensive peptides (≤3 a.a.) were determined according to Wu et al.22. Two and more amino acid descriptors of anti-hypertensive activity in the appropriate positions were considered enough to assume the ACE-inhibitory potential of a peptide.
Table 1: Molecular descriptors of bitter taste, antioxidant capacity, and anti-hypertensive activity.
| Parameter | Bitter taste descriptors | Antioxidant descriptors | Anti-hypertensive descriptors |
| Length |
1-4 kDa16,17 |
2-25 a.a.14,23,24 | 3-8 a.a.20 |
| Amino acid |
L, Y, F, W, P, A, I 18,19 |
L, Y, F, W, M, T, C25-27 | L, F, W, M, A, I, V21,22 |
| Position |
any combinations28 |
С2 (TEAC), C3 (ORAC)26,27 | C1 (Y and C), C2 (H, W, M), C3 (I, L, V, M), C4 (W, M)21,22. |
Table 2: Specificity of proteolytic enzymes at neutral pH (6.5 – 8.0).
|
Enzyme |
Specificity |
|
α-Chymotrypsin |
P1 = L, F, Y, W, M (not before P)29 |
|
Trypsin |
P1 = R, K (not before P)29 |
|
Thermolysin |
P’1 = A, F, I, L, M, V (not if – P” = P)29 |
|
Alcalase |
P1 = L, F, Y, W, M, A, E30,31 |
|
Neutrase |
P’1 = F, L, V32 |
|
Protamex |
P1 = V, L, I, F, Y, W33 P’1 = F, L, V33 |
Optimization of enzymatic hydrolysis conditions
The hydrolysis conditions were optimized according to a previously used multifactor experiment methodology11. The total enzyme/substrate ratio was optimized using Protamex as a single enzyme. Temperature, duration, and enzyme/substrate ratio were chosen as variables, and residual antigenicity was investigated as a controlled parameter.
The Protamex/Alcalase ratio was optimized according to the same approach using two variables: duration and Protamex/Alcalase ratio. Degree of hydrolysis (DH), free amino acid content (FAAC) and residual antigenicity (RA) were investigated as controlled parameters.
DH was determined as a ratio of hydrolysed peptide bonds to total peptide bonds by a spectrofotometric method according to Adler-Nissen34 using L-Leu as a standard. D340 was measured using a microplate reader Synergy2 (BioTec, USA).
FAAC was measured by a spectrofotometric method according to Toba35 using L-Glu as a standard. D420 was measured using a microplate reader Synergy2 (BioTec, USA).
RA was determined for immunoreactive β-lactoglobulin (β-LG) by a heterogenous competitive indirect enzyme-linked immunosorbent assay. β-LG standard (Sigma, USA) was adsorbed on the surface of polystyrene microplate wells. Calibration controls and test samples in different dilutions were added into the wells in a mixture with specific antibodies against β-LG. The specific antibodies (Microtests in bio, med, vet., LLC, Moscow, Russia) binded with both free β-LG and that adsorbed on the surface. The complex of antibodies with free β-LG was removed by washing. Antiserum immunoperoxidase conjugate (Gamaleya Institute of Microbiology and Epidemiology, Russia) was added to the adsorbed complex, and, after washing and substrate addition, the activity of the bound peroxidase label was determined. The color intensity was inversely proportional to β-LG content. RA was calculated as the ratio of β-LG content in the hydrolysate sample to that in raw materials, and expressed in %.
Sensory evaluation
Sensory evaluation of the hydrolysates was carried out in accordance with ISO.15315.2003 by a panel of 8 tasters. The samples were served in 50 ml transparent plastic cups and were coded in a three-digit numerical code.
A number of descriptors were defined to most fully appreciate the organoleptic properties of the samples. A 5-point scorecard was filled by the tasters on the basis of the intensity of sensory parameters:
- point – the symptom is missing
- points – the parameter intensity is very weak (on the verge of the recognition threshold)
- points – the parameter intensity is weak, but well recognizable
- points – the parameter intensity is moderate
- points – the parameter intensity is very strong
The points are further referred to as “bitter taste points”, or BT.
The extreme values were excluded from the results to achieve an acceptable level of homogeneity of the statistical evaluation.
Bioactivity assessment.
Antioxidant capacity (AOC) was tested in vitro by methods based on peroxyl radical (ORAC) and ABTS radical cation (TEAC) generation.
Antioxidant capacity of whey concentrate against ABTS radical cation was measured based on the decrease in the absorbance of ABTS+. at 734 nm similarly to the method described by Koroleva et al.36. ABTS cation-radical was generated by the method of Re et al.37 by incubation of a solution containing 7 mM ABTS and 2.45 mM potassium peroxodisulfate in the dark at room temperature for 12-18 hours. The obtained concentrated solution was diluted with 50 mM phosphate-saline buffer (with 100 mM sodium chloride), pH of 7.40, to reach ABTS+. concentration 47 µm. 20 µl of samples or trolox and 180 µl of ABTS+. solution were added into the wells of 96-well polystyrene microplates. A mixture of 180 µl ABTS+. and 20 µl of 50 mM phosphate-saline buffer (with 100 mM sodium chloride), pH of 7.40, was used as a control. The decline of D734 was recorded for 40.5 min with interval measurements every 60 s at 25º C on a photometer-fluorimeter Synergy 2 (BioTek, USA). AOC was expressed in mM trolox equivalents (TE).
Determination of antioxidant capacity against peroxyl radical was conducted according to Ou et al38. The reaction mixture contained 15 µl of the investigated hydrolysate or standard (trolox) and 115 µl of freshly prepared fluorescein sodium salt solution (8.16*10–8 M) in 75 mM Na-phosphate buffer, pH 7.40. The reaction was initiated with addition of 15 µl of freshly prepared 0.6 M AAPH solution in 75 µM sodium-phosphate buffer (pH 7.4) and incubated for 30 s with orbital shaking at 1400 rpm at 37 C on a thermoshaker microplate-incubator Grant Bio PHMP (UK). The absorbance at 734 nm was then measured for 40 min on Synergy2 plate reader (BioTek, USA). A linear regression equation of trolox concentration and ABTS+. absorbance decrease was used to calculate AOC values. AOC was expressed as the amount of trolox molar equivalents (TE, µM) per g of hydrolysate.
The anti-hypertensive activity was determined spectrofluorometrically as an ability of hydrolysates to inhibit angiotensin-1-converting enzyme (ACE) from rabbit lung. o-Aminobenzoyl-phenylalanyl-arginyl-lysyl(dinitrophenyl)-proline trifluoroacetate was used as a substrate with inner fluorescence quenching. To compare the hypotensive properties of hydrolysates, the concentration IC50 was determined at which ACE activity decreased by 50%. The protein content was determined using Kyedal method (conversion factor 6.25).
Molecular weight distribution
Molecular weight distribution was analyzed by the method of exclusion chromatography described by Nikolaev et al.11. A chromatography system comprised of a chromatograph Varian ProStar HPLC (USA), a pump PS210 SDM, an autosampler PS410, and a column BioSep-SEC-S 2000 (7.8 x 300 mm) “Phenomenex” (USA). The column was pre-calibrated for standard water-soluble proteins and peptides purchased from Sigma (USA) in the range of molecular masses from 451 to 440000 Da, covering its operating range. The volume of samples applied to the column was 20 µl. 50 mM potassium phosphate buffer, pH 6.80, containing 100 mM sodium chloride, was used as an eluent. The elution rate was 1 ml/min. The optical density of the eluate was registered using a continuous-flow detector with photodiode matrix (Varian 335 PDA) in the range of 190-330 nm at a base wavelength of 214 nm. The chromatograms obtained were integrated using the Excel software (Microsoft, USA), and the content of components of high molecular weight peptide fraction (MW >10 kDa), medium-MW or oligopeptide fraction (MW 3-10 kDa) and low MW fraction (MW <3 kDa) were calculated.
Protein composition
The analysis of protein profile of cheese whey concentrate was performed by electrophoresis in denaturing conditions according to Cleveland39 followed by identification of components of protein bands by the method of time-of-flight mass spectrometry (MALDI-TOF/TOF).
Peptide profile analysis
The hydrolysates were filtered through a hydrophilic PVDF membrane with pore diameter of 0.45 µm (Carl Roth, Germany) and used for peptide profile analysis by means of high performance reversed-phase chromatography with electrospray ionization. The components were identified by mass spectrometry of ion cyclotron resonance with Fourier transform. Fractions were sub-fractioned in a liquid chromatographic system Agilent 1100 (Agilent Technogies, Paolo Alto, CA, USA) on a capillary column (inner diameter 75 µm x length 12 cm) containing Reprosil-Pur Basic C18 media, 3 µm (Dr. Maisch HPLC GmbH, Ammerbuch-Entringen, Germany).
The detectors of the chromatographic system consisted of a mass spectrometer 7-Tesla Finnigan LTQ-FT Ultra (Thermo Electron, Germany) equipped with a nanoelectrospray. The Xcalibur software package (Thermo Finnigan, USA) was used for experimental data registration.
The Mascot Daemon 2.2.2 (Matrix Science, UK) software was used for automatic searching of the UniProtKB_SwissProt sprot_v.57.9 database. Acceptable level of significance was set at 95% probability. The peptides were considered reliably identified if Mascot score was at least 24.
Statistics
AOC evaluation experiments, ACE inhibition experiments, and optical density measurements during molecular weight distribution analysis were performed in 4 replicates. The results are given as mean ± sd.
The results of multi-factor experiments were repeated in 3 replicates and mean values were subjected to a statistical analysis using the DOE unit of Statistica 8.0 software (StatSoft Inc., 2007, USA).
Results
Design of cheese whey hydrolysis by various enzymes
The design of proteolysis experiment was aimed to obtain peptide mixtures with low residual antigenicity, satisfactory organoleptic properties, and enhanced antioxidant capacity and anti-hypertensive activity (Fig. 1).
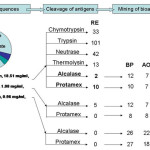 |
Figure 1: An in silico model of full hydrolysis of cheese whey proteins. RE – predicted number of residual epitopes; BP – bitter peptides; AO – antioxidant peptides; AH antihypertensive peptides; FAA – free amino acids. Click here to View figure |
As b-LG is the primary source of linear epitopes among milk whey allergens, containing 290 antigen sequences and being a predominant component of the whey concentrate obtained, it was chosen as a model protein for in silico digestion. b-LG was hydrolyzed by various enzymes in silico to analyze the residual antigenicity. Alcalase and Protamex were the two most efficient enzymes in cleaving the b-LG antigens, with only 2 and 10 residual antigens predicted, respectively. The digestion of b-LG, α-Lactalbumin, and Serum Albumin by these two enzymes was modeled to predict the release of bitter peptides, bioactive sequences, and free amino acids.
The number of epitopes and FAAC is lower in case of Alcalase, although Protamex has the advantage of better cleaving the a-Lactalbumin antigens. Protamex and Alcalase are effective in cleaving the peptide bond before C-terminal hydrophobic amino acids, which appears to be important for debittering, but can also digest bioactive motifs. The larger number of the latter was predicted in case of Alcalase (Fig. 1).
Alcalase as a single enzyme was excluded from the further consideration because of the strong bitter taste reported for the products of Alcalase hydrolysis8,40. The mixtures of Protamex and Alcalase in various proportions were investigated as enzymes for further experiments.
Optimization of total enzyme dosage
A multifactor experiment was carried out to optimize the Protamex dosage leading to the minimized residual antigenicity. Simultaneous increase of temperature and Protamex dosage as well as hydrolysis duration and Protamex dosage led to a decrease of residual allerginicity. RA depended linearly on Protamex dosage and hydrolysis duration, and had a quadratic dependence on temperature with a local minimum at 47.65°С and hydrolysis duration 90 min. (Fig. 2).
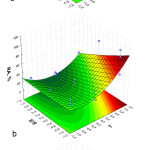 |
Figure 2: Optimization of hydrolysis conditions: residual antigenicity dependence on duration and temperature (a), Protamex dosage and temperature (b), duration and Protamex dosage (c). Click here to View figure |
The optimum dosage of Protamex resulting in the lowest residual antigenicity was E/S = 4%.
Optimization of hydrolysis conditions: Protamex/Alcalase ratio and hydrolysis duration.
Protamex/Alcalase ratio in the multienzyme composition was optimized using a full-factor experiment with two variables: hydrolysis duration (t, X1), and Protamex dosage (E/S, X2). Alcalase concentration was a function of the latter, the total concentration of multienzyme composition being 4.0%. Both variables had three levels of variation (Tab. 3). The incubation temperature was fixed at 50±2⁰С, an optimum temperature for Alcalase41, and pH was 7.0.
Table 3: Protamex/Alcalase ratio optimization: multifactor experiment results.
|
Sample |
Variables |
BT, points |
DH, % |
FAAC, mg/ml |
RA, % |
|
|
t, min |
Protamex E/S, % (Alcalase E/S, %) |
|||||
|
Control |
90 |
0(0) |
1 |
– |
– |
100,0 |
|
1 |
30 |
3.5(0.5) |
1 |
8.18 |
2.60 |
64.2 |
|
2 |
30 |
2.0(2.0) |
2 |
10.37 |
3.45 |
51.7 |
|
3 |
30 |
1.0(3.0) |
2 |
12.18 |
3.65 |
53.0 |
|
4 |
60 |
3.5(0.5) |
2 |
11.96 |
3.58 |
22.5 |
|
5 |
60 |
2.0(2.0) |
2 |
12.24 |
4.15 |
12.3 |
|
6 |
60 |
1.0(3.0) |
3 |
14.57 |
4.46 |
23.8 |
|
7 |
90 |
3.5(0.5) |
2 |
13.23 |
3.70 |
9.1 |
|
8 |
90 |
2.0(2.0) |
5 |
13.45 |
4.57 |
7.4 |
|
9 |
90 |
1.0(3.0) |
5 |
14.67 |
4.82 |
9.1 |
The multifactor experiment results were statistically processed. The model does not adequately describe the effects of variables on bitter taste, since only linear factor of hydrolysis duration was statistically significant (p<0.05) for BT, and so BT was excluded from statistical optimization. The other three controlled parameters were used in a multifactor optimization experiment. After removing the insignificant factors from the model, the following equations describing the hydrolysis process were obtained:
DH = 10.2557 + 0.1425*X1 – 0.001*X12 – 0.001*X12 – 2.0826*X2 + 0.1745*X1*X2 (3.1)
FAAC = 2.7719 + 0.0542*X1 – 0.0003*X12– 0.4147*X2 (3.2)
RA = 118.833 – 2.5139*X1 + 0.1431*X12 (3.3)
The ANOVA analysis demonstrated the adequacy of the investigated mathematical model for DH, FAAC, and RA. The graphical illustration of the dependence of controlled parameters on the variables is presented on Fig. 3.
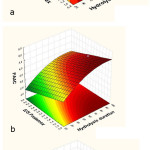 |
Figure 3: Effect of Protamex/Alcalase ratio (expressed as E/S Protamex) and hydrolysis duration on DH (a), FAAC (b), and RA (c). Click here to View figure |
The optimal values of Protamex/Alcalase ratio and hydrolysis duration were determined. The desirability profiles (Fig 4) represent the relationship between the predicted responses of the dependent variables and the desirability of responses. The desirability value of 1.0 was attributed to the highest experimental value of DH, the lowest FAAC and the lowest RA.
The response of the three controlled parameters to both variables was calculated using “Desirability profiler” module of Statistica 8.0 software to find a point where the desirabilities of DH, FAAC and RA balance at their simultaneous maximum (Desirability = 0.716). That point was considered as optimal conditions (Protamex/Alcalase ratio 3.5:0.5 and hydrolysis duration 90 minutes).
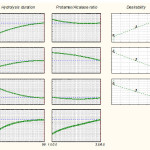 |
Figure 4: The desirability profiles and optimal response of DH, FAAC and RA to the variable hydrolysis conditions. Click here to View figure |
Three hydrolysates were prepared using the calculated optimal hydrolysis duration of 90 min and different Protamex/Alcalase ratios to compare the sensory properties (Fig. 5). Smell, taste, overall sensory impression (flavor) and other properties were quantified using 5-point scale, from 1 (feature not registered) to 5 (very intense). The results show overall similarity for the three hydrolysates, the only substantial difference being the absence of bitterness in case of Protamex/Alcalase ratio 3.5:0.5.
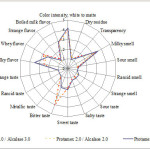 |
Figure 5: Organoleptic properties of cheese whey hydrolysates. Click here to View figure |
A 9-point hedonic scale, from 1 (extremely undesirable) to 9 (highly desirable) was used to measure the sensory desirability of the products. The mean desirability values increased with the increase of Protamex/Alcalase ratio (1.0:3.0 to 2.0:2.0 to 3.5:0.5) and were 3.2 (undesirable), 4.4 (slightly undesirable), and 6.9 (desirable), respectively, which is consistent with the results of multifactor experiment.
Antioxidant and anti-hypertensive properties.
In vitro antioxidant capacity of cheese whey concentrate increased 1.8-2.0 times after hydrolysis with Protamex. The addition of Alcalase further enhanced the antioxidant activity of the hydrolysate. A similar tendency was observed for antihypertensive properties of the hydrolysates under study, the IC50 of ACE-I inhibition being 15-25 times lower than that for whey concentrate (Tab. 4).
Table 4: Antioxidant capacity and ACE-I inhibition activity of cheese whey hydrolysates.
|
Sample |
АОЕ, mM TE |
IC50, mg protein/ml |
|
|
ТЕАС |
ORAC |
||
| Whey concentrate |
4.31 ± 0.18 |
2.83 ± 0.18 |
30.98 ± 2.8 |
| Protamex 4.0% |
8.95 ± 0.23 |
4.27 ± 0.14 |
2.09 ± 0.33 |
| Protamex 3.5% / Alcalase 0.5% |
11.34 ± 0.29 |
6.33 ± 0.21 |
1.21 ± 0.21 |
Residual antigenicity
A 8-fold decrease of β-Lg antigenicity was observed after hydrolysis by Protamex (residual antigenicity RA = 12.89%). The use of Protamex/Alcalase 3.5:0.5 mixture in the optimal conditions resulted in a further decrease of residual antigenicity (9.1%).
Molecular weight distributions.
The molecular weight (MW) distributions of the hydrolysates obtained using Protamex/Alcalase 3.5:0.5 and single Protamex are shown in Tab. 5. The hydrolysis of cheese whey resulted in a substantial increase of medium MW (3-10 kDa) and low MW (<3 kDa) fractions. The presence of Alcalase also resulted in a higher content of medium-sized peptides.
Table 5: Molecular weight distribution in cheese whey hydrolysates.
|
Protamex/ |
Molecular weight distribution, % |
||
|
>10 kDa |
3-10 kDa |
<3 kDa |
|
|
Control |
80.40 ± 0.42 |
6.67 ± 0.17 |
12.94 ± 0.1 |
|
4.0 / 0 |
65.56 ± 0.28 |
28.47 ± 0.22 |
5.97 ± 0.19 |
|
3.5 / 0.5 |
29.09 ± 0.18 |
54.99 ± 0.25 |
15.89 ± 0.23 |
Comparison of peptide profiles
A total of 199 and 667 medium-sized peptides were identified in the hydrolysates. Several of those peptides have been previously described by other researchers as ACE-I inhibitors (Tab. 6).
Table 6: Peptide profiles of hydrolysates obtained using Protamex (4.0 mg/ml) and Protamex/Alcalase (3.5:0.5 mg/ml).
|
Protamex/ |
Peptides identified (5-30 a.a) |
Peptides containing 2 and more redox-active a.a. |
Potentially hypotensive peptides |
Including previously reported ACE-inhibitory peptides |
|
4.0 / 0 |
199 |
44 |
6 |
ALKAWSVAR42 AMKPWIQPK43 |
|
3.5 / 0.5 |
667 |
106 |
82 |
LHLPLPL44 |
|
LDAQSAPLR45 VAGTW45 VLDTDYK45 |
||||
|
LDIQK46 |
||||
|
ALPMHIR47 |
Discussion
In silico proteolysis of cheese whey proteins was carried out using the specificity rules for various commercial enzymes. The descriptors of bitter taste, antioxidant capacity, antihypertensive activity, antigenicity, and the content of free amino acids after proteolysis were taken into account. Alcalase and Protamex appeared to be the most effective anti-allergenic enzymes for digestion of whey proteins and for obtaining biologically active peptides.
An almost total cleavage of all antigens was predicted for Alcalase and Protamex. Experimentally, a 8-fold decrease of β-Lg residual antigenicity was observed after partial hydrolysis by Protamex.
Protamex and Alcalase are effective in cleaving the peptide bond before C-terminal hydrophobic amino acids, which is crucial for debittering. The experimental evidence for whey hydrolysates obtained with Alcalase40 indicates the opposite: bitterness is characteristic when Alcalase is used as a single enzyme. Pacheco et al.48 reported an extremely bitter taste for Alcalase hydrolysates with DH 20% and hydrolysis duration 4h. Bitter taste increases rapidly during the first 30 min of Alcalase hydrolysis, and then grows steadily during 4 hrs8, however it is reported that deep Alcalase hydrolysis (over 8 hrs) results in non-bitter whey hydrolysates49.
The use of multienzyme mixtures or successive hydrolysis by Alcalase and other enzymes is reported to reduce bitter taste40. Accordingly, the mixtures of the two enzymes were used in a full-factor experiment to calculate an optimal Protamex/Alcalase ratio. The optimal value of total enzyme/substrate ratio E/S = 4% was determined in a multifactor experiment using Protamex as a single enzyme. The desirability profiles of DH, FAAC and RA were used to define an optimal desirability point corresponding to Protamex/Alcalase ratio 3.5:0.5 and hydrolysis duration 90 minutes. The values of controlled parameters at optimal conditions were: DH = 13.23; FAAC = 3.70; RA = 9.1.
Protamex appears to be the most reliable debittering agent for cheese whey proteins. The use of Alcalase as a single enzyme resulted in bitter tasting hydrolysates. Addition of Alcalase in the studied concentration range resulted in growth of bitterness. However, the product obtained using Protamex/Alcalase ratio 3.5:0.5 at optimal conditions was non-bitter. All the other sensory properties were practically identical for the hydrolysates studied.
Although DH was rather low for all the hydrolysates obtained (8-14%), the molecular weight distribution of the initial raw material changed substantially after hydrolysis, releasing a large amount of medium-sized peptides and resulting in enhanced antioxidant and antihypertensive activity of the products. It is hardly reasonable to increase the DH further, since there is a positive correlation between DH and bitter taste8. Slightly bitter aftertaste of the hydrolysates obtained using Protamex/Alcalase ratio 3.5/0.5 can be removed by means of masking technologies and substances50,51. Addition of up to 2% (w/w) of Alcalase-catalyzed cheese whey hydrolysates into a strawberry-flavored dairy drink did not result in bitter taste52.
The Protamex hydrolysate demonstrated lower antioxidant capacity and anti-hypertensive activity than the product of Protamex/Alcalase 3.5:0.5. This correlates with a higher content of the medium molecular weight fraction (3-10 kDa) and a higher amount of identified peptides containing redox-active amino acids in the latter product.
The number of antioxidant peptides identified in the Protamex hydrolysate was much higher than that calculated in silico, due to the multiple ways the same molecule can be cut during the partial hydrolysis. Surprising, though, was the significant difference in the number of anti-hypertensive hits in the peptide profiles of Protamex hydrolysate and Protamex/Alcalase hydrolysate. Considering the comparable ACE-inhibitory properties of the two hydrolysates, this phenomenon is a matter for further research. It should also be noted that hydrolysate bioactivity is most often low compared to the activity of isolated peptides, as hydrolysates are complex systems containing hundreds of different peptides53.
The successful attempt of producing a low-allergenic, non-bitter hydrolysate with enhanced AOC and ACE inhibitory activities speaks for the possibility to use cheese whey hydrolysates in functional foods, including the development of foods for children. Indeed, in the fermented milk product “Biokefir”, a 20% replacement of milk proteins with Protamex (2.5 – 4% E/S) hydrolysate of cheese whey12 improved the health state of 20 children in the age 3 to 16 years with mild manifestations of milk allergy, and increased the blood serum AOC against peroxyl radical by 17.5% (6,84±0.43 mm TE).
Conclusions
Protamex and its mixtures with Alcalase were chosen among a list of commercial proteases as the most appropriate enzyme preparations for cheese whey hydrolysis due to the low calculated residual antigenicity, and potentially high bioactive peptides content.
The optimal response of the degree of hydrolysis, free amino acid content, and residual antigenicity to the variable hydrolysis conditions was found using the desirability profiles. The optimal conditions were: Protamex/Alcalase ratio 3.5:0.5 and hydrolysis duration 90 minutes.
All the studied hydrolysates exhibited enhanced antioxidant capacity (2-8 fold) and anti-hypertensive activity (15-25 fold) compared to the raw material. The β-Lactoglobulin residual antigenicity was also decreased to 9-18% compared to cheese whey concentrate (100%).
The use of a multienzyme composition with a high Protamex/Alcalase ratio results in non-bitter hydrolysates with reduced β-Lg antigenicity, increased degree of hydrolysis, antioxidant capacity, and anti-hypertensive activity.
Acknowledgement
This work was supported by Grant of Russian Science Foundation
#16-16-00094
References.
- United States Department of Agriculture. Dairy: World Markets and Trade. (2015). Available online: http://apps.fas.usda.gov/psdonline/circulars/dairy.pdf Accessed 20.07.16.
- FAO (2015). Statistics division. Production – livestock processed. Available online: http://faostat3.fao.org/compare/E Accessed 24.05.2016.
- Korhonen, H. (2009). Milk-derived bioactive peptides: From science to applications. Journal of Functional Foods, 1(2), 177-187.
CrossRef - Cheison, S. C., and Kulozik, U. (2015). Impact of the environmental conditions and substrate pre-treatment on whey protein hydrolysis: A review. Critical reviews in food science and nutrition, (just-accepted).
- Li-Chan, E. C. (2015). Bioactive peptides and protein hydrolysates: research trends and challenges for application as nutraceuticals and functional food ingredients. Current Opinion in Food Science, 1, 28-37.
CrossRef - Liu, X., Jiang, D., and Peterson, D. G. (2013). Identification of bitter peptides in whey protein hydrolysate. Journal of agricultural and food chemistry, 62(25), 5719-5725.
CrossRef - Saha, B. C., and Hayashi, K. (2001). Debittering of protein hydrolyzates. Biotechnology Advances, 19(5), 355-370.
CrossRef - Kankanamge, R.; Jeewanthi, C.; Paik, H.-D.; Kim, M.-H.; Lee, N.-K.; Kim, S.-Y.; Yoon, Y.-C. (2014) Characteristics of whey protein hydrolysates from cheese whey, favors on various food applications. Chem. Ind. Chem. Eng. Q. 20(4), 503-509.
CrossRef - Patel, S. (2015). Functional food relevance of whey protein: A review of recent findings and scopes ahead. Journal of Functional Foods, 19, 308-319
CrossRef - Chatterjee, A., Kanawjia, S. K., Khetra, Y., Saini, P., and Mann, B. (2015). RESPONSE SURFACE ANALYSES FOR ADMINISTERING PRODUCTION OF WHEY PROTEIN HYDROLYSATE WITH HYPOTENSIVE AND ANTIOXIDANT BIOACTIVITY. Indian Journal of Dairy Science, 68(2).
- Nikolaev, I. V., Sforza, S., Lambertini, F., Ismailova, D. Y., Khotchenkov, V. P., Volik, V. G., and Koroleva, O. V. (2016). Biocatalytic conversion of poultry processing leftovers: Optimization of hydrolytic conditions and peptide hydrolysate characterization. Food chemistry, 197, 611-621.
CrossRef - Kharitonov V.D., Agarkova E.Yu., Kruchinin A.G., Ryazantseva K.A., Korolyeva O.V., Fedorova T.V., Zvereva E.A., Tyazhelova T.V., Maloshenok L.G., Revyakina V.A., Georgieva O.V., Ponomareva N.V., Melnikova E.I., Laptev G.Yu., Ilina L.A. (2015). Impact of new fermented dairy product with whey protein hydrolysate on tolerance and dynamics of atopic dermatitis manifestation in children suffering from cow’s milk protein allergy. Voprosy Pitaniia (Problems of nutrition). 84(5), 56-63.
- AllergenOnline (2010). Available online: http://www.allergenonline.com/ Accessed 20.07.2016.
- Dziuba M., Minkiewicz P., and Dąbek M. (2013). Peptides, specific proteolysis products as molecular markers of allergenic proteins – in silico studies. Acta Scientiarum Polonorum Technologia Alimentaria, 12, 101-112. Available online: http://www.uwm.edu.pl/biochemia/index.php/pl/biopep Accessed 20.07.2016.
- WHO/IUIS (1994). Allergen Nomenclature Sub-Committee. Allergen Nomenclature. Available online: http://www.allergen.org/ Accessed 20.07.2016
- Cho, M. J.; Unklesbay, N.; Hsieh, F-H., and Clarke, A. D. (2004). Hydrophobicity of Bitter Peptides from Soy Protein Hydrolysates. J. Agric. Food Chem., 52, 5895−5901.
CrossRef - Tamura, M., Miyoshi, T., Mori, N., Kinomura, K., Kawaguchi, M., Ishibashi, N., and Okai, H. (1990). Mechanism for the bitter tasting potency of petides using O-aminoacyl sugars as model comounds. Agric. Biol. Chem. 54, 1401 – 1409.
- Matoba, T., and Hata, T. (1972). Relationship between bitterness of peptides and their chemical structures. Agricultural and Biological Chemistry, 36(8), 1423-1431.
CrossRef - Ney, K. H. (1971). Prediction of bitterness of peptides from their amino acid composition. Z. Lebensm Unters Forsch. 147, 64 – 71.
CrossRef - Saiga, A., Okumura, T., Makihara, T., Katsuda, S. I., Morimatsu, F., and Nishimura, T. (2006). Action mechanism of an angiotensin I-converting enzyme inhibitory peptide derived from chicken breast muscle. Journal of agricultural and food chemistry, 54(3), 942-945.
CrossRef - Sagardia, I., Roa-Ureta, R. H., & Bald, C. (2013). A new QSAR model, for angiotensin I-converting enzyme inhibitory oligopeptides. Food chemistry, 136(3), 1370-1376.
CrossRef - Wu, J., Aluko, R. E., and Nakai, S. (2006). Structural Requirements of Angiotensin I‐Converting Enzyme Inhibitory Peptides: Quantitative Structure‐Activity Relationship Modeling of Peptides Containing 4‐10 Amino Acid Residues. QSAR and Combinatorial Science, 25(10), 873-880.
CrossRef - Ajibola, C. F., Fashakin, J. B., Fagbemi, T. N., and Aluko, R. E. (2011). Effect of peptide size on antioxidant properties of African yam bean seed (Sphenostylis stenocarpa) protein hydrolysate fractions. International Journal of Molecular Sciences, 12(10), 6685-6702.
CrossRef - Shen, S., Chahal, B., Majumder, K., You, S. J., and Wu, J. (2010). Identification of novel antioxidative peptides derived from a thermolytic hydrolysate of ovotransferrin by LC-MS/MS. Journal of agricultural and food chemistry, 58(13), 7664-7672.
CrossRef - Li, Y. W., Li, B., He, J., and Qian, P. (2011). Quantitative structure–activity relationship study of antioxidative peptide by using different sets of amino acids descriptors. Journal of Molecular Structure, 998(1), 53-61.
CrossRef - Li, Y. W., and Li, B. (2013). Characterization of structure–antioxidant activity relationship of peptides in free radical systems using QSAR models: key sequence positions and their amino acid properties. Journal of theoretical biology, 318, 29-43.
CrossRef - Torkova, A., Koroleva, O., Khrameeva, E., Fedorova, T., and Tsentalovich, M. (2015). Structure-functional study of tyrosine and methionine dipeptides: an approach to antioxidant activity prediction. International journal of molecular sciences, 16(10), 25353-25376.
CrossRef - Kirimura, J., Shimizu, A., Kimizuka, A., Ninomiya, T., & Katsuya, N. (1969). Contribution of peptides and amino acids to the taste of foods. Journal of Agricultural and Food Chemistry, 17(4), 689-695.
CrossRef - Artimo, P., Jonnalagedda, M., Arnold, K., Baratin, D., Csardi, G., de Castro, E., Duvaud, S., Flegel,V., Fortier, A., Gasteiger, E., Grosdidier, A., Hernandez, C., Ioannidis, V., Kuznetsov, D., Liechti, R., Moretti, S., Mostaguir, K., Redaschi, N., Rossier, G., Xenarios, I., & Stockinger, H. (2012). ExPASy: SIB bioinformatics resource portal, Nucleic Acids Res, 40(W1), 597-603.
CrossRef - Rao, M. B., Tanksale, A. M., Ghatge, M. S., & Deshpande, V. V. (1998). Molecular and biotechnological aspects of microbial proteases. Microbiology and Molecular Biology Reviews. 62(3), 597–635.
- Doucet, D., Otter, D., Gauthier, S., & Foegeding, E. (2003). Enzyme-Induced Gelation of Extensively Hydrolyzed Whey Proteins by Alcalase: Peptide Identification and determination of Enzyme Specificity. J. Agric. Food Chem., 51 (21), 6300-6308.
CrossRef - Xu, W., Kong, B., & Zhao, X. (2014). Optimization of some conditions of Neutrase-catalyzed plastein reaction to mediate ACE-inhibitory activity in vitro of casein hydrolysate prepared by Neutrase. J Food Sci Technol. 51(2), 276–284.
CrossRef - Muhamyankaka, V., Shoemaker, C. F., Nalwoga, M., & Zhang, X. M. (2013). Physicochemical properties of hydrolysates from enzymatic hydrolysis of pumpkin (Cucurbita moschata) protein meal. International Food Research Journal. 20(5), 2227-2240.
- Adler-Nissen, J. (1986). Enzymic hydrolysis of food proteins. Elsevier Applied Science Publishers.
- Toba, T. (1987). Comparative study of polysaccharides from kefir grains, an encapsuled homofermentative Lactobacillus species and Lactobacillus kefir. Milchwissenshaft. 42, 565-568.
- Koroleva, O., Torkova, A., Nikolaev, I., Khrameeva, E., Fedorova, T., Tsentalovich, M., and Amarowicz, R. (2014). Evaluation of the antiradical properties of phenolic acids. International journal of molecular sciences. 15(9), 16351-16380.
CrossRef - Re, R., Pellegrini, N., Proteggente, A., Pannala, A., Yang, M., and Rice-Evans, C. (1999). Antioxidant activity applying an improved ABTS radical cation decolorization assay. Free radical biology and medicine, 26(9), 1231-1237.
CrossRef - Ou, B., Hampsch-Woodill, M., and Prior, R. L. (2001). Development and validation of an improved oxygen radical absorbance capacity assay using fluorescein as the fluorescent probe. Journal of agricultural and food chemistry, 49(10), 4619-4626.
CrossRef - Cleveland, D. W., Fischer, S. G., Kirschner, M. W., and Laemmli, U. K. (1977). Peptide mapping by limited proteolysis in sodium dodecyl sulfate and analysis by gel electrophoresis. Journal of Biological Chemistry, 252(3), 1102-1106.
- Spellman, D., O’Cuinn, G., and FitzGerald, R. J. (2009). Bitterness in Bacillus proteinase hydrolysates of whey proteins. Food Chemistry. 114(2), 440–446.
CrossRef - Wróblewska, B. and Troszyñska, A. (2005). Enzymatic hydrolysis of cow’s whey milk proteins in the aspect of their utilization for the production of hypoallergenic formulas. Polish journal of food and nutrition sciences, 14(4), 349.
- FitzGerald, R. J., and Meisel, H. (1999). Lactokinins: Whey protein‐derived ACE inhibitory peptides. Food/Nahrung, 43(3), 165-167.
CrossRef - Maeno, M., Yamamoto, N., and Takano, T. (1996). Identification of an antihypertensive peptide from casein hydrolysate produced by a proteinase from Lactobacillus helveticus CP790. Journal of Dairy Science, 79(8), 1316-1321.
CrossRef - Miguel, M., Recio, I., Ramos, M., Delgado, M. A., and Aleixandre, M. A. (2006). Antihypertensive effect of peptides obtained from Enterococcus faecalis-fermented milk in rats. Journal of dairy science, 89(9), 3352-3359.
CrossRef - Pihlanto-Leppälä, A., Koskinen, P., Piilola, K., Tupasela, T., and Korhonen, H. (2000). Angiotensin I-converting enzyme inhibitory properties of whey protein digests: concentration and characterization of active peptides. Journal of Dairy Research, 67(01), 53-64.
CrossRef - Meisel, H., Walsh, D. J., Murray, B., FitzGerald, R. J., Mine, Y., and Shahidi, F. (2006). ACE inhibitory peptides. Nutraceutical proteins and peptides in health and disease, 269-315.
- Mullally, M. M., Meisel, H., and FitzGerald, R. J. (1997). Identification of a novel angiotensin‐I‐converting enzyme inhibitory peptide corresponding to a tryptic fragment of bovine β‐lactoglobulin. FEBS letters, 402(2-3), 99-101.
CrossRef - Pacheco, M. T. B., Amaya‐Farfan, J. A. M. E., and Sgabrieri, V. C. (2002). Partial characterization of a whey protein concentrate and its enzyme hydrolysates. Journal of Food Biochemistry, 26(4), 327-338.
CrossRef - Athira, S., Mann, B., Saini, P., Sharma, R., Kumar, R., and Singh, A. K. (2015). Production and characterisation of whey protein hydrolysate having antioxidant activity from cheese whey. Journal of the Science of Food and Agriculture,95(14), 2908-2915.
CrossRef - Leksrisompong, P., Gerard, P., Lopetcharat, K., and Drake, M. (2012). Bitter taste inhibiting agents for whey protein hydrolysate and whey protein hydrolysate beverages. Journal of food science, 77(8), S282-S287.
CrossRef - Ley, J. P. (2008). Masking bitter taste by molecules. Chemosensory Perception,1(1), 58-77.
CrossRef - Mann, B., Kumari, A., Kumar, R., Sharma, R., Prajapati, K., Mahboob, S., and Athira, S. (2015). Antioxidant activity of whey protein hydrolysates in milk beverage system. Journal of food science and technology, 52(6), 3235-3241.
- Arroume, N., Froidevaux, R., Kapel, R., Cudennec, B., Ravallec, R., Flahaut, C., and Dhulster, P. (2016). Food peptides: purification, identification and role in the metabolism. Current Opinion in Food Science, 7, 101-107.
CrossRef


Web of Science Coverage
Emerging Sources Citation Index (ESCI)
2024 Journal Impact Factor: 1.1
Scopus Journal Metrics
CiteScore 2025: 2.6
CiteScore Details
Sustainable Nutrition: Food Systems, Nutrient Retention, and Public Health Impact
![]()
This journal is a member of, and subscribes to the principles of, the Committee on Publication Ethics (COPE)


