Assessment of Obesity using Anthropometric Markers among University Students
Astha1
and Anup Kharde3 1Rural Medical College, Loni, Maharashtra, India.
2Department of Physiology, Rural Medical College, Loni, Maharashtra, India.
3Department of Community Medicine , Rural Medical College, Loni, Maharashtra, India.
Corresponding Author Email: drbindukrishnan@gmail.com
DOI : http://dx.doi.org/10.12944/CRNFSJ.9.1.21
Download this article as:
![]()
Over the past few decades there has been an increase in the central or abdominal obesity. Endothelial dysfunction, insulin resistance with metabolic syndrome and a higher cardiometabolic risk are directly linked to abdominal obesity. A better understanding of the epidemiology of obesity would provide insights to its mitigation. This cross sectional study was designed to identify Central obesity, General obesity and Normal Weight central obesity among young adults using the following surrogate markers Waist circumference (WC), Waist hip ratio (WHR), Waist height ratio (WtHR) and BMI. After due informed written consent, 300 young adults with equal representation of both sexes (150 each) studying MBBS, Dentistry and Physiotherapy stream in a private university were selected. Various anthropometric measures like weight, hip circumference and waist circumference and height were measured according to WHO STEPS instrument. BMI based on Asia- Pacific cut -off values was used to define general obesity. Central obesity was defined by a Waist Circumference of 80 cm in females and 90 cm in male’s .For waist to height ratio a value of 0.5 in both genders was used. For waist to hip ratio the cut off value used was 0.85 in females and 0.90 in males. An individual with normal weight according to BMI but having central obesity fits into Normal Weight Central obesity category. Average age of the participants was 20.6 1.31 years. General Obesity was more among males with 46% prevalence as compared to 25.33%among females. In contrast, the prevalence of central obesity was more among females. The prevalence of Normal weight central obesity was more among females, varying from 4% to 17% using different types of anthropometric measures for central obesity. A high positive correlation was observed between BMI with WC, WtHR and WHR. (p=0.0001) Current practice of taking only BMI into consideration for defining obesity in our country needs serious re-evaluation considering the increasing prevalence of abdominal obesity and its long term impact.
KEYWORDS:Central Obesity; Normal Weight Central Obesity; University Students; Waist Circumference
Introduction
Obesity is a chronic metabolic disorder with accumulation of adipose tissue and is strongly associated with cardiovascular disease, metabolic syndrome and mortality 1. The prevalence of obesity worldwide has tripled in the last four decades. Obesity among young adults is increasing steadily all over the world . The period between 18 to 25years of age being the transition phase from adolescence to adulthood is called the young adult phase. Among young adults, obesity ranges from 2.3 to 12% in developing countries and 22 to 35% in developed countries 2. In a study from South India, age adjusted BMI, WC and WtHR were significantly higher among urban youth when compared to their rural counterparts 3. The various factors contributing to obesity among the young include genetics, socio economic status, disrupted eating patterns, reduced sleep duration ,reduced physical activity and increased stress. 4,5 Our study participants are also part of this urban society.
A study among Canadian population over a period of 30 years by Ian Janssen et al 6observed that for a given BMI of 25kg/m2 , waist circumference increased by 4.9 cm in women and 1.1cm in men. Longitudinal studies in USA, China, England and Mexico have shown a statistically significant increase in waist circumference values when compared to Body Mass Index(BMI) 7. The phenotype of obesity has been changing in the past few decades showing an increase in the central obesity(CO) or abdominal obesity (AO) Endothelial dysfunction, insulin resistance with metabolic syndrome and a higher cardiometabolic risk are directly linked to abdominal obesity8
Body composition is different among various ethnic groups and population worldwide. South Asian population are known to have reduced muscle mass with a high body fat within normal BMI. Low muscle mass is associated with an unfavorable metabolic profile .However an increased gluteo femoral adipose tissue has improved metabolic and cardiovascular risk profile 9,10. A person with normal BMI but higher central obesity tends to have a decreased subcutaneous fat on hips and legs .These distinct anthropometric features are observed even in Asian children who have an increased tendency for abdominal obesity and have higher body fat percentage even at lower levels of body weight11. All these factors make the South Asian population more vulnerable.
MI is used globally for stratification of obesity as underweight, normal, overweight and obese. BMI as an independent cardiometabolic risk has gained some ambiguity, as it gives no information on fat distribution nor the ratio of fat to lean mass12. Obesity measured only by BMI must have reached a plateau in some countries, but the abdominal obesity is on the rise steadily13. Three frequently used surrogate markers for central obesity are Waist -hip ratio (WHR) Waist to height ratio (WtHR) and Waist circumference (WC) . These markers are known to carry an increased risk of cardio vascular disease, mortality and type 2 diabetes mellitus independently and along with BMI14. Normal weight central obesity (NWCO) is another distinct phenotype of obesity receiving importance in the recent times. An individual with normal weight according to BMI but having central obesity is categorized as Normal Weight Central obesity 15.Recent studies have elucidated a strong association between cardio vascular ailments, metabolic syndrome, mortality and NWCO16. Waist Circumference, Waist Hip ratio and Waist to height ratio along with BMI have each independently shown association with cardiovascular disease risk factors17,18.
Obesity along with other risk factors like hyperlipidemia, reduced physical activity and hypertension play an important role in increasing cardiovascular events19,20,21. Inspite of increased prevalence and knowledge about central obesity and NWCO as a risk factor for health, their occurrence in general population is less evaluated. Studies among young population are important in understanding the epidemiology of obesity and this will help in early intervention. We found no study documenting the burden of normal weight central obesity among urban young adult population in our country, hence we decided to a) find the distribution of general obesity by using BMI b) to define central obesity using WtHR, WC,WHR b) use all the three different definitions of NWCO (normal BMI with elevated WtHR, normal BMI with elevated WHR and normal BMI with elevated WC ) to find out the burden of normal weight central obesity.
Methodology
This cross-sectional descriptive study was conducted for a period of six months in the department of physiology, Rural Medical College, Loni. Institutional Ethical clearance was obtained before the start of the study .(RMC/UG-PG /2019/04)
Study Population
Young adults in age group 18-26 years were part of the study group. After due informed written consent, 300 young adults with equal representation of both sexes (150 each) studying MBBS, Dentistry and Physiotherapy stream in a private university were selected.
Exclusion criteria : Subjects who were diagnosed with any of the following ailments like hypertension, diabetes, cardiac diseases, bronchial asthma, allergic disorders were excluded. Subjects known to be indulging in any form of substance abuse and taking medication for any psychiatric illness were also excluded from the study.
Anthropometric Measurements
Standing height was measured using a wall mounted stadiometer with bare feet and recorded to the nearest 0.1 cm. Weight was recorded using a digital weighing machine with the subject barefoot and wearing light clothes measured to the nearest 0.1 kg. Waist circumference (WC) was measured in standing posture using a stretch resistant tape at the midpoint between the lower margin of last palpable rib and top of the iliac crest at the end of normal expiration. Hip circumference was measured at the level of the maximum girth of the hip to the nearest 0.1cm.
Operational Definitions
General Obesity
Asia- Pacific grading of obesity is based on the consensus that the skeletal and muscle mass of individuals in these regions are lower than in the West.16 So, BMI was based on Asia- Pacific cut -off values to define general obesity. BMI was calculated as body weight in kilograms divided by body height in meter square. Subjects were divided into normal category (18.0 -22.9 kg/m2), overweight (23.0-24.9 kg/m2 ) obese (>25 kg/m2 ).
Central Obesity
The following parameters were used to define central obesity:
1.Waist circumference (WC) The cut-off for WC was ³ 90 cm in case of males and ³ 80 cm in case of females to define abdominal obesity.
2.Waist to height ratio (WtHR) This was calculated as WC(cm) divided by height (cm).The cut off for waist to height ratio to define abdominal obesity was ³ 0.5 in both genders.
3.Waist to hip ratio (WHR) This was calculated as WC (cm) divided by hip circumference(cm). The cut off for waist to hip ratio to define abdominal obesity was ³0.90 in males and ³0.85 in females
Normal Weight Central Obesity
Normal Weight Central Obesity was defined as central obesity (by using the above mentioned cut off for WC, WtHR, WHR) among individuals with normal weight (18.0 -22.9 kg/m2 using BMI).
Combined Obesity
An individual who has General obesity defined by BMI along with central obesity by using the appropriate cut off for WC WtHR, WHR fitted into this category.
Statistical analysis
Descriptive statistical analysis was performed using SPSS (version 20 for Windows.) Mann Whitney U test was used for analyzing parametric variables. The association between two categorical variable was examined through Chi-Squire test. Binary logistic regression was applied to predict the likelihood of an individual becoming obese . Pearson’s correlation coefficient test was used to determine the relationship between BMI, WC, WtHR WHR. P value <0.05 was considered as level of significance
Results
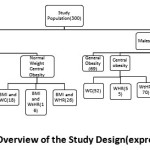 |
Figure 1: Schematic Overview of the Study Design (expressed in numbers) |
General Obesity
Fig 2 shows the overall prevalence of general obesity as defined by Asia Pacific guidelines for obesity based on BMI. More males were found to be obese than females in this category(46% vs 25.33%).
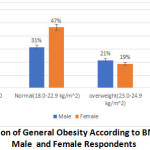 |
Figure 2 : Distribution of General Obesity According to BMI Category among Male and Female Respondents. |
Central Obesity
(Fig 3 ) Using WHO recommended cut -off for WC and WHR, prevalence of CO was more among females when compared to male respondents (47.33% vs 35.33% and 48% vs 37.33%) respectively.
Using WtHR cut of ³ 0.5 in defining CO ,the prevalence was more among males. (47.33% vs 45.66%).
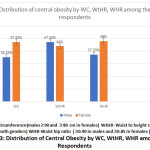 |
Figure 3: Distribution of Central Obesity by WC, WtHR, WHR among the Respondents. |
Normal Weight Central Obesity
(Fig 4) Prevalence of NWCO varied from 4% to 16.6% using different types of measures for central obesity. The distribution of NWCO was more among females when compared to males (10.66% vs 4% ,11.33% vs 6%, 17% vs 7.33% using WC, WtHR, WHR respectively).
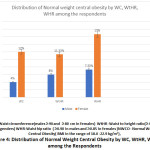 |
Figure 4: Distribution of Normal Weight Central Obesity by WC, WtHR, WHR among the Respondents. |
Table 1 gives us Mean and SD of various anthropometric measures .A total of 300 students comprising of equal number from both sexes participated in the study. Average age of the participants was 20.6± 1.31. Mean body weight among males was 75.4 kg while in females it was 58.67 kg.
Table 1: Anthropometric Characteristics of Male and Female Subjects
| Variable | Male (n=150) | Female (n=150) | Pvalue |
| Age | 20.9 ± 1.26 | 20.3± 1.29 | P<0.056 |
| Body weight | 75.4±12.05 | 58.67±11.34 | P<0.001 |
| Height | 1.75±0.08 | 1.60±0.06 | P<0.001 |
| BMI | 24.47±3.34 | 22.68±3.84 | P<0.001 |
| WC | 86.6±9.77 | 80.44±9.82 | P<0.001 |
| HC | 95.37±9.26 | 98.28±9.77 | P<0.008 |
| WHtR | 0.49±0.05 | 0.5±0.06 | P=0.687 |
| WHR | 0.88±0.05 | 0.84±0.05 | P<0.001 |
BMI -Body Mass Index WC-Waist circumference HC-Hip circumference WtHR -Waist to height ratio WHR-Waist hip ratio.
Combined Obesity
Table 2 shows us the association between BMI and central obesity variables WC, WtHR, WHR among the genders. The prevalence of combined obesity was more among male respondents .(27.33% vs 22% using WC; 34% vs 21.33% using WtHR; 18% vs 17.33% using WHR)
Table 2: Association between BMI and central obesity variables WC, WtHR, WHR among the genders.
| Variable | Gender | Category | BMI<25 n(%) NO | BMI ³ 25 n(%) GO | P value |
| WC | Females | < 80 cm | 72(48%) | 05(3.33%) | <0.001* |
| ³80 cm | 40(26.66%) | 33(22%) | |||
| Males | < 90 cm | 69(46%) | 28(18.66%) | <0.001* | |
| ³ 90 cm | 12(8%) | 41(27.33%) | |||
| Total WtHR | Females | < 0.50 | 75(50%) | 6(4%) | <0.001* |
| ³0.50 | 37(24.66%) | 32(21.33%) | |||
| Males | < 0.50 | 56(37.33%) | 18(12%) | <0.001* | |
| ³0.50 | 25(16.66%) | 51(34%) | |||
| WHR | Females | <0.85 | 60(40%) | 12(8%) | =0.019* |
| ³0.85 | 52(34.66%) | 26(17.33%) | |||
| Males | <0.90 | 59(39.33%) | 42(28%) | =0.119 | |
| ³ 0.90 | 22(14.60%) | 27(18%) |
WC-Waist circumference(males ³ 90 and ³ 80 cm in females) WtHR -Waist to height ratio(³ 0.5 in both genders) WHR-Waist hip ratio ( ³0.90 in males and ³0.85 in females) NO – No Obesity(BMI < 25 kg/m2) GO-General Obesity (BMI ³25 kg/m2) *P value = are from chi- square test of association between central obesity and gender within general obesity and no obesity.
Table 3 shows that the correlation between BMI with WC (r=0.71), WtHR (r=0.66), WHR (r=0.34) which were statistically significant.
Table 3 : Pearson Correlation Coefficient between BMI with WC, WHtR and WHR Across Gender among the Respondents.
| BMI | ||||||
| WC | WHtr | WHR | ||||
| r | p | r | p | r | p | |
| Total(300) | 0.71 | <0.001* | 0.66 | <0.001* | 0.34 | <0.001* |
| Male(150) | 0.60 | <0.001* | 0.61 | <0.001* | 0.31 | <0.001* |
| Female(150) | 0.77 | <0.001* | 0.77 | <0.001* | 0.27 | =0.001* |
WC-Waist circumference WtHR -Waist to height ratio WHR-Waist hip ratio BMI -Body Mass Index *P value significant<0.001
Table 4 depicts the results from the logistic regression used to predict the odds that a subject of a given waist circumference, waist height ratio and gender will be obese. The adjusted result reveals that one unit increase on the waist circumference was associated with 15% increase in obesity and the result was statistically significant. Males were 58% more likely to be obese (general obesity) than female .However, the result was statistically insignificant. When it comes to central obesity, females were 18.8 times more likely to be centrally obese than males.
Table 4: Odds ratio and 95% confidence intervals from logistic regression models to predict the odds that a subject of a given waist circumference, waist height ratio and gender will be Obese using BMI as dependent variable.
| Variables | Unadjusted odds ratio | Adjusted odds ratio |
| Waist circumference | 1.18*** | 1.15*** |
| (1.13 – 1.22) | (1.09 – 1.21) | |
| Waist height ratio | 7.31*** | 1.58 |
| (4.23 – 12.61) | (0.73 – 3.41) | |
| Gender | ||
| Female | Reference | Reference |
| Male | 2.51*** | 1.43 |
| (1.54 – 4.09) | (0.76 – 2.70) | |
*** p<0.001, ** p<0.01, * p<0.05; 95% confidence interval in parentheses
General Obesity
Fig 1 shows the overall prevalence of general obesity as defined by Asia Pacific guidelines for obesity based on BMI. More males were found to be obese than females in this category(46% vs 25.33%).
(Fig 3 ) Using WHO recommended cut -off for WC and WHR, prevalence of CO was more among females when compared to male respondents (47.33% vs 35.33% and 48% vs 37.33%) respectively.
Using WtHR cut of ³ 0.5 in defining CO ,the prevalence was more among males. (47.33% vs 45.66%).
Normal Weight Central Obesity
(Fig 4) Prevalence of NWCO varied from 4% to 16.6% using different types of measures for central obesity. The distribution of NWCO was more among females when compared to males (10.66% vs 4% ,11.33% vs 6%, 17% vs 7.33% using WC, WtHR, WHR respectively).
Discussion
In this cross- sectional observation study, we tried to find the distribution of general obesity, central obesity and normal weight central obesity using three different surrogate markers (WC, WtHR , WHR)among young university students. Among the 300 participants, the prevalence of general obesity using BMI was found more among males(46%).In contrast, the prevalence of central obesity (44% to 48%) was more among females . More females fitted into the category of NWCO, which varied from 4% to 17% using different types of anthropometric measures for central obesity. A high positive correlation was observed between BMI and WC, WtHR and WHR, respectively.( p=0.0001)
WHO has identified obesity as a major cause of disability and premature deaths in developing countries and this has been attributed to dietary shifts and lifestyle changes 22. Our study reported a prevalence of 37% in general obesity category using BMI and males had a higher prevalence. An increased prevalence of metabolic syndrome in South Asians is mostly attributed to central obesity 23. In the present study the prevalence of central obesity was 41.33%, 45.66% and 42.66% on using WC, WtHR and WHR as anthropometric markers. The percentage of central obesity (using WC) among urban young adult population in Chandigarh, Tamil Nadu, Jharkhand and Maharashtra were 26.6%,19.3%.9.8% and 13% respectively24. Results from our study show an increased prevalence of central obesity among female subjects when compared to males(46.44 % vs 39.99%).This association between gender and abdominal adiposity is in accordance with another study by Elelyn Thomas et al where the CO measured by WC in females was 44.3% when compared to 24.6% in males25. Kokila and Sivaprakasam also had similar results in their study among university students 26. But contrary to our findings, in a study on the effect of central obesity on lipid profile among young adults ,Shaikat et al observed that WC was more among males then in females27.
Sex hormones strongly influence body fat distribution and adipocyte differentiation. Males have greater total lean mass, bone mineral mass and lower fat mass, while females have more peripheral distribution of fat28. The possible explanation for the high prevalence of CO among females apart from childhood socio- economic status and environmental causes are also the social construction since culture and behavioral attitudes also play an important role in fat distribution for e.g less physical activity observed among Indian females 29.
Prevalence of NWCO varied from 4 to 16.6% using different types of measures for central obesity in our study . Recent research showed that men and women who were in NWCO category had 1.87 and 1.48 times higher mortality risk compared to individual having the same BMI but no central obesity15. A meta analysis review on anthropometric parameters and mortality, showed that the highest mortality risks were shown for the combination of low or normal BMI with large WC or WHR30 . A study in Brazil which comprised of 1222 young adults (23 to 25 years) showed that 111 of them had normal weight obesity and had an increased risk of metabolic syndrome (OR 6.83 95% CI 2.84-16.83)31. A recent literature states that 23% of Saudi Arabian and 16.7% of Egyptian young adults were already at a high risk of having a cardiovascular disease within ten years 32. Based on many cohorts, cardiovascular risk factors present since childhood /adolescence have a relation to atherosclerotic lesions in the study of necropsies seen among young individuals 33. Incorporating these simple anthropometric measures in routine clinical practice will help in mitigating the metabolic changes seen so early in life course.
There is consistent evidence of age, gender, race and ethnic variations in waist circumference, hip circumference, waist to height and waist to hip ratio. To define obesity by anthropometric indices is on the assumption that these measures correlate with more direct measures of adiposity like by MRI , CT etc34. We decided to evaluate and compare central obesity using all three indices, namely, WC, WtHR and WHR. Premnath et al had observed in their study that WC correlated significantly with visceral fat and it can be used as a surrogate marker for visceral obesity35. In our study, WC demonstrated strong and positive correlation(r=0.71)with BMI compared to WtHR(r=0.66) and WHR(r=0.34) Results from the logistic regression showed that one unit increase on the waist circumference was associated with 15% increase in obesity and was statistically significant . In spite of males having a higher mean WC (86.6cm), the proportion of females who were centrally obese were more and statistically significant. Nevertheless, for a given increase in waist circumference, males tend to have more visceral adipose tissue than females thereby carrying a higher metabolic risk4. WtHR is again a simple and effective anthropometric index with a universal cut off 0.5 irrespective of race, ethnicity, gender and age. Taking height into consideration in this marker, the prediction of the disease risk is increased, as short stature itself is associated with increased risk of CVD36. In growing children, adolescence, WtHR might be useful but in an adult with apparently no change in height, this ratio depends more on the changes in WC. Waist hip ratio (WHR) considers waist circumference relative to hip circumference. In our study mean hip circumference was more in females (98.28 vs 95.37) and is in accordance with the more peripheral distribution of fat in women. The Baltimore Longitudinal Study of Aging, in their study on the effect of weight change and its distribution noted that in men waist changes were larger than hip changes while in women the changes were the same 37 .The demerit of using WHR is that, being a ratio, its utility is limited when both the numerator and denominator can change with treatment.
Understanding the dimorphism between sexes of fat distribution among various ethnic groups and its associated risk factors is significant in the context of the obesity epidemic. Our findings reveal that normal weight and central obesity can co-exist among young adults. Though being a significant risk factor later for developing cardiovascular ailments and metabolic syndrome, obesity in childhood , adolescents and young adult life is not given due relevance. Utilising these simple surrogate markers (WC,WtHR,WHR) along with BMI at the primary health center or in an early adolescence clinic will help in identifing obesity and its complication at an earlier stage especially among the vulnerable South Asian population.
We have tried to incorporate all the three important anthropometric indices in defining central obesity and NWCO pattern among the respondents ,though the gold standard would have been the use of CT scan to define the distribution of fat. This was a major limitation in our study. A detailed history regarding dietary pattern , physical activity, sleep pattern, stress factors along with metabolic parameters in a larger sample size with a comprehensive work up could be the next step in this area of research.
Conclusion
A combination of BMI and an abdominal anthropometric measurement are required to find the body fat distribution for research and clinical practice. Current practice of taking only BMI into consideration for defining obesity in our country needs serious re-evaluation considering the increasing prevalence of abdominal obesity and its long term impact.
Acknowledgements
The authors would like to thank all the study participants for their time and support.
Funding Source
The author(s) received no financial support for the research, authorship, and/or publication of this article.
Conflicts of Interest
The authors declare no conflict of interest.
References
- Kopelman PG. Obesity as a medical problem. Nature.2000;404:635. doi:10.1038/35007508.
CrossRef - Amudha Poobalan, Lorna Aucott. Obesity Among Young Adults in Developing Countries :A systematic Overview. Curr Obes Rep.2016.5:2- 13.DOI 10.1007/s 13679-016-0187-x.
CrossRef - Bhongir AV, Nemani S, Reddy PS. Rural – urban epidemiologic transition of risk factors for coronary artery disease in college students of Hyderabad and nearby rural area -a pilot study. J Assoc Physicians India . 2011;59:222-6.
- Maria Teresa Anselmo Olinto, Heloisa Theodoro and Raquel Canuto. Epidemiology of Abdominal Obesity.Chapter 6 Pg 71- 95. http://dx.doi.org/10.57772/65432.
- Patel SR, Hu FB. Short sleep duration and weight gain: a systematic review. Obesity (Silver Spring, MD) 2008;16(3):643-653.doi:10.1038/oby.2007.
CrossRef - Janssen, I., Shields, M., Craig. C.L &Tremblay, M.S. Changes in the obesity phenotype with Canadian children and adults.1981to 2007-2009. Obesity 2012;20.916-919.
CrossRef - Albrecht, S. S., Gordon-Larsen , P., Stern,D. & Popkin, B.M.Is waist circumference per body mass index rising differentially across the United States, England, China and Mexico? J.Clin.Nutr. 2015 ;69,1306-1312.
CrossRef - Shah RV, Murthy VL, Abbasi AS, Blankstein R, Kwong RY, Goldfine AB, et al.Visceral adiposity and the risk of metabolic syndrome across body mass index: the MESA study. JACC Cardiovasc Imaging. 2014; 7 (12): 1221-1235. Doi: 10.1016/j.jcmg.2014.07.017.
CrossRef - Ntuk UE, Celis – Morales C A, Mackay DF, Sattar N, Pell JP, Gill JMR. Association between grip strength and diabetes prevalence in black, South-Asian and white European ethnic groups: a cross sectional analysis of 418 656 participants in the UK Biobank study. Diabet Med. 2017;34(8).
CrossRef - Snijder,M .B.et al. Low subcutaneous thigh fat is a risk factor for unfavourable glucose and lipid levels, independently of high abdominal fat. The health ABC Diabetologia 48,301-308(2005).
CrossRef - Ramachandran A, Snehalatha C. Rising burden of obesity in Asia. J Obes.2010;2010:868573.doi:10.1155/2010/868573.doi:10.1155/2010/868573.
CrossRef - Mason C, Craig CL, Katzmarzyk PT. Influence of central and extremity circumference on all cause mortality in men and women. Obesity 2008;16: 2690-2695.
CrossRef - Ross, R.,Neeland, I.J., Yamashita , S .et al.Waist circumference as a vital sign in clinical practice: a Consensus Statement from the IAS and ICCR Working Group on Visceral obesity. Nat Rev Endocrinol 2020;16,177-189. https://doi.org/10.1038/s41574-019-0310-7.
CrossRef - S Carmienke, M H Freitag,T Pischon et al .General and abdominal obesity parameters and their combination in relation to mortality : a systemic review and meta-regression analysis. European Journal of Clinical Nutrition 2013; 67,573-585:doi:10.1038/ejcn.2013.61;
CrossRef - Shukri F. Mohamed, Tilahun Nigatu Haregu , Christopher Khayeka- Wandabwa et al. Magnitude and predictors of normal weight central obesity- the AWI-Gen study findings. Global Health Action.2019;Vol 12,1685809.doi.org/10.1080/16549716.2019.1685809.
CrossRef - Sahakyan KR, Somers VK, Rodriguez – Escudero JP, et al. Normal -weight central obesity : implications for total and cardiovascular mortality. Ann Intern Med.2015 ;Dec 1;163:827-835. PubMed Central PMCID:PMCPmc4995595.
CrossRef - Kim MK, Han K, Kwon HS, Song KH, Yim HW, Lee WC, et al.Normal weight obesity in Korean adults. Clin Endocrinol (Oxf).2014.https://doi.org/10.1111/cen.12162.
CrossRef - Pan WH, Yeh WT. How to define obesity? Evidence based multiple action points for public awareness, screening and treatment: an extension of Asian-Pacific recommendations. Asia Pac J Clin Nutr.2008; 17(3): 370-374.
- Sook LW, Sablihan NI, Ismail S, Devaraj NK, Mooi CS. Factors Associated With the Level of Physical Activities Among Non-Academic Staffs in the Faculty of Medicine and Health Sciences of a Public University in Selangor, Malaysia. Mal J Med Health Sci 2019; 15(2): 47-55.
- Devaraj NK, Mohamed M, Hussein N. Prevalence, factors influencing and knowledge about adherence to lipid-lowering therapy among hyperlipidemia patients. The Medical Journal of Malaysia. 2017 Jan 1;72(3):157-64.
- Devaraj NK, Mohamed M, Hussein N. Prevalence, factors influencing and knowledge about adherence to lipid-lowering therapy among hyperlipidemia patients. Med J Malaysia 2017;72(3):157-64.
CrossRef - World Health Organization, “Report of a joint WHO/FAO Expert . Consultation. Diet, nutrition and the prevention of chronic diseases,” WHO technical report series No.916, http://whqlibdoc.who.int/trs/who-TRS-916.pdf.
- Medscape Conference Coverage, based on selected sessions at the : European Society of Cardiology 2006 World Congress,” http://www.medscape.com/viewarticle/544229%3frss.
- Rajendra Pradeepa , Ranjit Mohan Anjana, Shashnak R Joshi, Anil Bhansali et al. Prevalence of generalized & abdominal obesity in urban & rural India – the ICMR-INDIAB 0Study(Phase -1) [ICMR-INDIAB-3]. Indian J Med Res 142, August 2015, pp 139-150.DOI: 10.4103/0971-5916.164234.
CrossRef - Thomas E, Geethadevi M .Prevalence and determinants of overweight and obesity among medical students. Natl J Physiol, Pharm and Pharmacol 2020 ; 10( 01): 42-48.
- Selvaraj K, Sivaprakasam P. A study on the prevalence of overweight and obesity among medical students of Kanchipuram district. Natl J Res Community Med 2013;2:79-148.
- Mondal S, Mukhopadhyay SK. Effect of central obesity on lipid profile in healthy young adults. Med J DY Patil Vidyapeeth 2018;11:152-7.
- Karastergiou et al . Sex differences in human adipose tissues- the biology of pear shape.2012;3:13 http://www.bsd- journal.com/content/3/1/13.
CrossRef - Agrawal P, et al. Awareness on causes, consequences and preventive measures of obesity among urban married women in India. Int J Med Public Health.2013;3(4):293-302.
CrossRef - Coutinho T, Goel K, Correa de Sa D, et al. Combining body mass index with measures of central obesity in the assessment of mortality in subjects with coronary disease: role of “normal weight central obesity”. J Am Coll Cardiol.2013; Feb 5;61:553-560. PubMed PMID:23369419:Eng.
- Maderia FB, Silva AA, Veloso HF, Goldani MZ, Kac G, Cardoso VC, et al. Normal weight obesity is associated with metabolic syndrome and insulin resistance in young adults from a middle – income country.PLoS ONE. 2013;8:e60673.
CrossRef - Mahmoud AEDH. Prevalence of cardiovascular disease risk factors among Egyptian and Saudi medical students: a comparative study.J Egypt Public Health Assoc.2015;90:35-9.
CrossRef - Fonseca FL, Brandao AA, Pozzan R, et al. Overweight and cardiovascular risk among young adults followed – up for 17 years: the Rio de Janerio study, Brazil. Arq Bras Cardiol.2010;94(2):193-204. Doi: 10.1590/s0066-782×2010000200011.
CrossRef - Johanna Nattenmueller, Hanna Hoegenauer et al. CT- based compartmental quantification of adipose tissue versus body metrics in colorectal cancer patients. Eur Radiol.2016;26(11): 4131-4140.doi:10.1007/s00330-016-4231-8.
CrossRef - Premanath M, Basavanagowdappa H, Mahesh M, Suresh M. Correlation of abdominal adiposity with components of metabolic syndrome, anthropometric parameters and Insulin resistance in obese and non obese, diabetics and non diabetics: A cross sectional observational study.(Mysore Visceral Adiposity in Diabetes Study). Indian J Endocrinol Metab 2014;18:676-82.
- Paajanen, T.A., Oksala, N.K., Kuukasjarvi, P. & Karhunen,.P.J. Short stature is associated with coronary heart disease: a systematic review of the literature and a meta -analysis. Heart J. 2010; 31.1802-1809.
CrossRef - Shimokata H, Andres R, Coon PJ, Elahi D, MullerDC, Tobin JD. Studies in the distribution of body fat. II.Longitudinal effects of change in weight. Int J OBES.1989;13(4):455-464.
Accepted on: 23 Dec 2020
Second Review by: Muhammad, Naoshad United States
Final Approval by: Carlos A. F. Oliveira


Web of Science Coverage
Emerging Sources Citation Index (ESCI)
2024 Journal Impact Factor: 1.1
Scopus Journal Metrics
CiteScore 2025: 2.6
CiteScore Details
Sustainable Nutrition: Food Systems, Nutrient Retention, and Public Health Impact
![]()
This journal is a member of, and subscribes to the principles of, the Committee on Publication Ethics (COPE)


