Reducing Allergenicity of Soy Protein Isolate from Several Varieties of Soybean through Glycation with Lactose
 , , 2, , 2, Muhammad Hasriandy Asyhari3
 1Department of Food Science and Technology, Faculty of Agricultural Engineering and Technology, Bogor Agricultural University, Bogor, Indonesia.
2Southeast Asian Food and Agricultural Science and Technology (SEAFAST) Center, Bogor Agricultural University, Bogor, Indonesia.
3Food Science Graduate Program, Graduate School, Bogor Agricultural University, Bogor, Indonesia.
Corresponding Author Email: hnpalupi@yahoo.com
DOI : http://dx.doi.org/10.12944/CRNFSJ.8.1.25
Download this article as:
![]()
Food allergy is a specific immunological response caused by allergens contained in food. Soybean is one of the eight types of food products that most frequently cause allergies, which may lower its quality in terms of safety aspects. Soybean processing can reduce the risk of allergies by modifying the soy protein structure so as to produce hypoallergenic food. Processing involving Maillard reaction by conjugating proteins with reducing sugars has the potential to reduce allergenicity. This research aims to: (1) determine the degree of glycation based on the formation of soy protein isolates (SPI) -lactose conjugate and free amino; (2) determine the molecular weight profile of SPI and SPI-lactose conjugate: and (3) analyze the allergenicity of SPI and SPI-lactose conjugate. Protein isolation was carried out by protein precipitation of imported soybean (GMO and non-GMO) and local soybean varieties (Anjasmoro and Grobogan) at their isoelectric point or using a pH arrangement. Then the SPI was reacted with lactose under pH 9.5 and 95 ° C for 60 minutes. The determination of glycation degree of SPI-lactose conjugate was carried out using two methods, namely the thiobarbituric acid reactive substances (TBARS) method and Bradford method for free amino acids. The protein molecular weight profile was analyzed using the SDS-PAGE electrophoresis method. The allergenicity of SPI and SPI-lactose conjugate were analyzed quantitatively using the Enzyme-Linked Immunosorbent Assay (ELISA) method. The analysis results from local varieties (Anjasmoro and Grobogan) showed that the higher SPI protein content causes higher glycation degree of SPI-lactose conjugate. SDS-PAGE electrophoresis results showed that molecular weight profiles of SPI from GMO, non-GMO, Anjasmoro and Grobogan were 11-147.7 kDa, 12.9-150.3 kDa, 11.3-144.2 kDa and 10.7-159.0 kDa, respectively. Glycation process can eliminate or reduce the intensity of protein bands suspected to be the major allergen proteins in soybeans, namely Gly m Bd 60K, Gly m Bd 30K or P34, and Gly m Bd 28K. The glycation reaction can reduce allergenicity in all soybean varieties tested by 43.12% to 29.85%.
KEYWORDS:Allergenicity; Enzyme-Linked Immunosorbent Assay (ELISA); Glycation Degree; Soy Protein Isolate (SPI); SPI-Lactose Conjugate
Introduction
Food allergy is one of the major health problems in the world that can affect both adults and children, even new born babies. The prevalence of food allergies has increased in recent years.1 In 2011, WHO reported that 20-30% of the world’s population suffer from allergies. 2Food allergy most commonly affects infants and children, with number of cases ranging from 5-8%, and around 1-2% in adults. 3In children aged 0-17 years, the prevalence of food allergy increased from 3.4% in 1997-1999 to 5.1% in 2009-2011. 4Cases and data on the prevalence of food allergy in Indonesia are not yet certainly known. Research on food allergy in Indonesia is still limited. 5Prevalence of food allergy in Indonesia was around 5-11%.6 Research at Cipto Mangunkusumo Hospital (RSCM) in Jakarta mentioned that shrimp is a major cause of allergy in children (8.8%) and adults (24.3%). Moreover, the prevalence of peanut allergy that occurs in children is 7.4% and in adults is 11.4%, and the prevalence of children who sensitive to soybean allergen is 7.4%.
7Various types of food are reported to cause allergic reactions. More than 90% of food allergy occurrences are induced by milk, eggs, fish, crustaceans, peanuts, nut trees, wheat and soybeans, which are also referred to as “The Big Eight “. 8There are at least 16 soy protein with molecular weights ranging from 14 kDa to 70 kDa which have been confirmed of being able to bind IgE residing in the patient’s serum and trigger atopic dermatitis. 7Food processing technology is expected to alter the allergenicity of food products. Process such as heating, enzymatic fermentation, physical treatments such as high pressure or extrusion, and the combination of these methods could also reduce the allergenicity. However, this processing technology also has many shortcomings, for example, enzymatic hydrolysis can cause the formation of peptide fragments that produce a bitter taste. Processing techniques that involve Maillard reaction can be an alternative to reduce the allergenicity of soybeans, one of such can be done by conjugating proteins with reducing sugars.
9Soy protein isolate (SPI) is one of the processed soybean products with favourable functional properties thus widely used by the food industry as an ingredient in the formulation of various processed meat or milk. The presence of allergen protein in SPI limits the consumption of its derivate products, especially for people with allergies. Conjugating SPI with reducing sugar is one of the methods to reduce its allergenicity. The type of reducing sugar conjugated or added can react with SPI with varying degrees of glycation. Lactose is a type of reducing sugar found in milk and milk products. Currently, lactose is widely used by food industry as an ingredient for beverage and confectionery product due to its low sweetness level, ability to bind flavour and aroma, and to increase shelf life of the product. The extensive use of lactose has a great prospect to be used simultaneously with SPI in formulation to produce hypoallergenic food.
10Soybean production in Indonesia increased from 779.992 tons in 2013 to 859.653 tons in 2016. 11The increase in soybean production is carried out to meet domestic needs, where most of it is currently met by importing. Imported soy products are classified to genetically modified organism (GMO) and non-GMO soybeans. The genetic engineering of soybean is intended primarily to increase its agriculture productivity, such as pests and diseases resistances and herbicides tolerances, rather than to improve nutrition. 12However, the process of GMO is suspected to increase allergenicity of the products. In addition, national soybean production is also continuously increased by producing several local soybean varieties. Anjasmoro and Grobogan are local soybean varieties widely produced in Indonesia. For this reason, this study aims: (1) to determine the degree of glycation based on conjugate formation of soy protein isolate (SPI)-lactose and free amino acids; (2) determining the SPI and SPI-lactose conjugate molecular weight profile; and (3) testing the allergenicity of SPI and SPI-lactose conjugate.
Materials and Method
Materials
The materials used in this study include GMO soybean (Tiga Roda) and non-GMO soybean (Yellow Soybean Product of USA) from Cooperative of Indonesian’s Producers of Tofu-Tempe (KOPTI), Anjasmoro and Grobogan soybean varieties from the Institute of Plants Research for Legumes and Tubers (Balitkabi), and lactose (Difco, Detroit, USA). The GMO and non-GMO soybean are not from the same variety.
Protein Isolation
Soybean are ground and sifted with 60 mesh sieves. Before executing protein isolation process, proximate analysis was performed to obtain chemical composition. 13Protein isolation began with fat removal. The mashed sample was submerged in hexane (technical) at ratio of 1:5 w/v, for 1 hour at room temperature, then centrifuged (Eppendorf Centrifuge 5810R, Hamburg, Germany) with speed of 8.000 g for 15 minutes at 4°C. After the supernatant is removed, the sediment was extracted twice to remove its remaining fat content. 14Protein isolation is carried out by changing pH. The fat free sample was mixed with distilled water (ratio 1:10 w/v), then the pH was increased to 8 using 1 N NaOH (Merck, Darmstadt, Germany), stirred for 90 minutes at room temperature and centrifuged (10000 g for 30 minutes at 4°C). The pH value of the supernatant obtained was reduced to 4.5 using 1 N HCl (Merck, Darmstadt, Germany), then centrifuged for 20 minutes. The obtained supernatant was then removed, while the protein in sediment was concentrated with a freeze dryer (EYELA, FD-550, Tokyo Rikakikai Co.Ltd., Japan)
SPI-Lactose Conjugation
15Conjugation was carried out in the liquid food system formulation. SPI and lactose were dissolved in 0.5 M carbonate-bicarbonate buffer (pH 9.5) with specific ratio (SPI:lactose = 4:1, w/w). The mixture then poured into a tightly closed tube and heated in a water bath (GFL D-30938, Burgwedel, Germany) at 95°C, with constant stirring at 200 rpm. Samples were incubated for 0, 30, 60, and 90 minutes. In each fetching time, the sample cooled down immediately in an ice filled water bath, followed by storage at -20°C. As control, SPI without lactose was handled with same conditions.
Measurement of Glycation Degree of SPI-Lactose Conjugates Base using TBA Method
16A total of 2 mL trichloroacetic acid (TCA) 20% (Merck, Darmstadt, Germany) was added into 4 mL sample, then centrifuged for 10 minutes at 3000 rpm. One mL of 0.01 M phosphate buffer (pH 7.4) and 0.5 mL of 0.3 N oxalic acid (Merck, Darmstadt, Germany) were added to the sediment and stored in a water bath for 1 hour. After cooled down, each sample added with 0.5 mL of TCA 40%, then centrifuged for 10 minutes at 3000 rpm. One mL of supernatant was retrieved and added with 0.5 mL of thiobarbituric acid 0.05 M (TBA) (Merck, Darmstadt, Germany), then stored in a water bath at 40°C for 30 minutes. The absorbance of the sample was measured at 443 nm using spectrophotometer (UV-160, Shimadzu, Tokyo, Japan). The control used was a sample without glycation treatment. Degree of glycation (DG) of SPI-lactose conjugate was then calculated using the following formula:
![]()
Measurement of Glycation Degree of Free Amino Group Base using Bradford Test
17As much as 100 µL samples were fetched and put into a reaction tube of 1.2 × 10 cm, then added with 5 mL of Bradford reagents. The solution was then vortexed and run in spectrophotometer (UV-160, Shimadzu Tokyo, Japan) at wavelength of 595 nm after 5 minutes. The control used was a sample without glycation treatment. Degree of glycation (DG) of free amino group base was then calculated using the following formula:
![]()
where, C0 is the concentration of free amino group in control and C1 is the concentration of free amino group in sample.
Analysis of molecular weight profiles with SDS-PAGE electrophoresis
18SDS-PAGE electrophoresis was performed with 5% stacking gel and a 12% separating gel using an SDS-PAGE device (BIO-RAD, Hercules, CA, USA). A sample of 10 µL was added with 40 µL of sample buffer containing sodium dodecyl sulfate (SDS, anionic detergent) (Merck, Darmstadt, Germany), tris base pH 6,8 and β-mercaptoethanol (Merck, Darmstadt, Germany), then heated for 5 minutes at 100°C. Samples were injected into a well. Protein marker Spectra Multicolor Broad Range Protein Ladder with molecular weights of 10-260 kDa (Thermo Scientific, Waltham, MA, USA, 26634) was placed in one of other wells. The electrophoresis process was carried out for 180 minutes at 70 V until the dye migration remained about 0.5 cm from the bottom. After the running process was finished, the gel was stained using Coomasie Briliant Blue G-250 (Merck, Darmstadt, Germany) then rinsed with distilled water. A decolouring solution was added until blue ribbon appears on the gel. Molecular weight and intensity of protein bands in the gel were analyzed with GelAnalyzer 2010a software. The measuring principle of intensity percentage in the GelAnalyzer 2010a software is based on the differences in colour intensity on the protein band. The darker the protein band, the higher the intensity produced.
Allergenicity Test using ELISA
Serum Preparation of Patients
The serum used in this study was taken from a person with soy allergy and a person who doesn’t have soy allergy as the negative control. A structured questionnaire was used to interview subjects about the food responsible for the reactions, the details of prior history of allergic reaction as well as its symptoms. The subjects were carefully informed the scope of the study and they signed the written informed conset form after receiving and approving all the information. To confirm the clinical history of soybean hypersensitivity and its severity, two subjects were asking their consents for an SPT (skin prick test) study with protein isolate from 8 major food allergens (shrimp, egg white, cashew, peanuts, soybeans, milk, fish and wheat). Blood as much as ± 20 mL was drawn from each person. SPT and serum collection were conducted by medhical personnel and allergologist physician at the Clinic of Allergy in Bandung, West Java-Indonesia. The blood obtained was let for 30 minutes at room temperature (22°C), then centrifuged for 20 minutes at 2500 rpm (1250 g). The supernatant obtained was the serum which contained IgE, which then stored at -20°C. This study was purely an observational study, in which no food intervention to the two subjects.
Sample Preparation
Samples were mixed with PBS (1:1) then incubated at 4°C for 18 hours. Samples then centrifuged at 2500 rpm and 4°C for 20 minutes (Eppendorf Centrifuge 5810R, Hamburg, Germany). Supernatant was retrieved then diluted for 10x in carbonate-bicarbonate buffer (0,05 M, pH 9,6).
Determination of SPI and SPI-Lactose Conjugate Allergenicity Characteristics
As much as 100 µL/sample protein well dissolved in carbonate-bicarbonate buffer (0.05 M, pH 9.6) were coated on 96 well polystyrene flat plates (Nunc Maxisorb), then incubated at 4°C for 17 hours, and then washed 3 times with PBST (phosphate buffer saline 0.05% tween-20) of 300 μL/well. Subsequently, the microtiter plates were blocked with 200 µL/well of blotto solution for 1 hour at 37°C., then washed with PBST (300 μL/well) 3 times. After that, patient’s serum IgE which have been diluted 1:10 in blotto (5% skim milk in PBS) was added to the microtiter, then incubated for 1 hour at 37°C. The microtiter plates were then washed with PBST (300 μL/well) 3 times. Secondary antibodies (IgG mouse IgE anti-human labelled Horseradish Peroxydase) (ICL Lab, ME-80P-24A) were added as much as 100 µL/well which had been previously diluted 1:6000 in blotto. After incubated for 1 hour at 37°C, the microtiter plates were washed with PBST (300 μL/well) 3 times, then added with 100 μL/well of TMB substrate (3,3”, 5,5”-tetra-methylbenzidine) (BIO-RAD, UK), and incubated again for 20 minutes at 37°C. Positive result was marked in blue. The reaction was stopped with 50 µL/well of 2 M H2SO4 to produce yellow colour, then left for 5 minutes before reading. OD was measured by ELISA reader (BIO-RAD, UK) at wavelength of 450 nm. The control used was a sample without glycation treatment. 19Percentage decrease of reactivity is calculated by the following formula:
![]()
Data processing
Chemical characteristics data from object of observation were designed using Completely Randomized Design (CRD) displayed descriptively using ANOVA (Analysis of Variance). Data processing was performed using the Statistical Package for the Social Sciences (SPSS, ver.24) to compare significance at 95 percent confidence level. If the data is significantly different, then proceed with Duncan test.
Results and Discussion
Characteristics of Soy Protein Isolates
Proximate analysis was carried out to determine chemical composition of four soybean types before they furtherly analyzed in the form of soy protein isolate (SPI). The four types of soybean used in this study are imported soybeans (GMO and non-GMO) and local soybeans (Grobogan and Anjasmoro varieties), each have different protein levels. The results showed that the protein content ranged from 41.30 to 46.37%. Anjasmoro Variety has the highest protein content of 46.37% (Table 1).
The yield of soybean flour-based SPI and soybean-based SPI from the four types of soybean obtained by pH adjustment methods ranged between 9.05-13.16% and 7.22-10.92% (Table 2). The four types of soybean had SPI protein levels in the range of 90.14-90.98%. Protein content and yield of each SPI were not significantly different from one another. Protein content obtained was more than 90%, so that this product can be categorized as protein isolate.
Table 1: Chemical composition of soybean types
| Parameter (%) | GMO | Non-GMO | Anjasmoro | Grobogan |
| Moisture (bb) | 4.53±0.05a | 4.46±0.03a | 4.97±0.12b | 5.05±0.02b |
| Ash (bk) | 3.73±0.06a | 4.54±0.04b | 5.32±0.05c | 5.50±0.02d |
| Fat (bk) | 23.83±0.25a | 24.67±0.01b | 19.87±0.10c | 21.04±0.55d |
| Protein (bk) | 42.35±0.56a,b | 41.30±0.27a | 46.37±0.51c | 43.44±0.25b |
| Carbohydrate (bk) | 30.10±0.88b | 29.50±0.23a,b | 28.44±0.56a | 30.02±0.33a,b |
Note: Numbers in the same row followed with the identical letter showed that the result was not significantly difference (p<0,05). GMO and non-GMO Soybean are not from same variety.
Table 2: Yield and protein content of SPI from soybean varieties
| Parameter (%) | GMO | Non-GMO | Anjasmoro | Grobogan |
| Yield of flour-based SPI | 9.05±1.10a | 13.16±1.13b | 10.59±1.36a,b | 9.08±0.94a |
| Yield of soybean-based SPI | 7.37±0.90a | 10.92±0.94b | 8.90±1.15a,b | 7.22±0.75a |
| Protein content of SPI | 90.14±1.02a | 90.56±0.56a | 90.98±0.49a | 90.25±0.20a |
Note: Numbers in the same row followed with the identical letter showed that the result was not significantly difference (p<0,05). GMO and non-GMO Soybean are not within same variety
Glycation Degree of SPI-Lactose Conjugate Base
9Glycation occurs through covalent bonds between carbonyl groups of reducing sugars and free amino groups of proteins to form the Schiff base and Amadori rearrangement. The degree of glycation is usually used to evaluate the extent of Maillard reaction.16 The measurement of the degree of glycation of SPI-lactose conjugate base was carried out by TBA method, through the principle of glycated proteins hydrolysis using oxalic acid at 100°C to form hydroxymethyl furfural (HMF) which can react with TBA to form a chromophore group.
Figure 1 shows the glycation degree of several soybean varieties with 60 minutes incubation. Glycation degree of non-GMO conjugate (SPI-lactose) was significantly higher (p<0.05) compared to other varieties, which was 36.95%. In contrast, glycation degree of GMO conjugate was the lowest with 25.92% and was not significantly different from Grobogan conjugate. Relatively low protein content in GMO and Grobogan SPI causes lower binding ability to lactose, compared to other soy varieties. Increasing degree of glycation correlates with changes in antigens structure of soy protein so that it can reduce allergenicity. 20Changes in β-lactoglobulin antigenicity contained in whey protein isolate (WPI) were highly dependent on the degree of glycation generated by Maillard reaction. An increase of glycation degree due to Maillard reaction is apparently related to the changes in antigenicity of β-lactoglobulin.
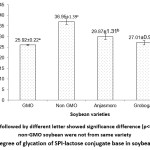 |
Figure 1: Degree of glycation of SPI-lactose conjugate base in soybean varieties Click here to View figure |
Glycation Degree of Free Amino Base
The result of glycation degree analysis of free amino base using Bradford’s test is presented in Figure 2. The calculation was carried out based on the difference between concentration of free amino in control (non-conjugate) and concentration of free amino in SPI conjugate product during incubation. The more the decrease in concentration of free amino acids in IPK conjugate product compared to control, the more the degree of glycation produced. Based on Figure 2, non-GMO conjugate (SPI-lactose) glycation degree was significantly higher (p<0.05) compared to other varieties, which was 27.43%, while the glycation degree between Anjasmoro, Grobogan, and GMO varieties was not significantly different. This shown a similar pattern to the glycation degree of SPI-lactose conjugate base, which confirmed that protein content plays an important role in the process of glycation with lactose. 15The higher protein content allows more availability of free amino groups (lysine residues) so the potential for lactose binding will be higher too. At the beginning of glycation reaction, amino ε-groups from lysine are still in very large amount. However, during glycation reaction lysine residue will gradually decrease as it binds to reducing sugars. This will continue until certain point where lysine residue has been used up to bind with reducing sugar and glycation reaction will stop consequently.
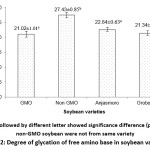 |
Figure 2: Degree of glycation of free amino base in soybean varieties Click here to View figure |
SPI and SPI-Lactose Conjugate Molecular Weight Profiles
Molecular weight profiles of SPI protein and SPI-lactose conjugates from various varieties after being analyzed with GelAnalyzer 2010a software are shown in Figure 3. The results exhibited that molecular weight profiles of the four types different. Based on SDS-PAGE electrophoresis, GMO SPI had 11 protein bands with molecular weights between 11-147.7 kDa, non-GMO SPI had 9 protein bands with molecular weight between 12.9-150.3 kDa, SPI of Anjasmoro variety had 9 protein bands with molecular weights between 11.3-144.2 kDa, and SPI of Grobogan variety had 8 protein bands with molecular weights between 10.7-159.0 kDa. 21SDS-PAGE electrophoresis results of SPI from Detam-1 variety had 13 protein bands with molecular weights between 11.8-170.2 kDa. 22Eight protein bands with molecular weights between 9.6-114.7 kDa were obtained in soybean variety of Grobogan. 23Eleven protein bands and nine protein bands with molecular weights between 4.8-145.8 kDa were obtained in GMO soybeans and non-GMO soybeans respectively. 24,25Seven protein bands molecular weight between 20-83.7 kDa were also obtained in soybeans purchased from regular market as well as 12 protein bands with molecular weight between 21.2-95.2 kDa in commercial soy protein isolates. Different varieties, growing sites, and handling of soy samples will produce in different molecular weight profiles.
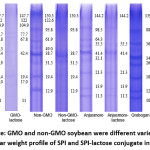 |
Figure 3: Molecular weight profile of SPI and SPI-lactose conjugate in soybean varieties Click here to View figure |
The glycation of SPI with lactose can alter the molecular weight profile of all samples. Glycation treatment with lactose for 60 minutes incubation time caused several protein bands to disappear when compared to SPI control. The protein bands that disappeared in GMO SPI conjugate with lactose were 31.9 kDa and 54.3 kDa, while in non-GMO SPI conjugate were 122.6, 61.9, and 49.0 kDa. Glycation with lactose of Anjasmoro SPI eliminated 3 protein bands with molecular weights 98.5, 64.3, and 32.1 kDa, whereas of Grobogan SPI-lactose conjugate eliminated 56.1 kDa protein band. It established that the higher the degree of glycation (Figure 1-2), the more protein bands will be eliminated. The non-GMO SPI-lactose conjugate which produces the highest degree of glycation eliminated 3 protein bands. On the other hand, the GMO and Grobogan SPI-lactose conjugates which generally had the lowest glycation degree eliminated 1 to 2 protein bands respectively.
Figure 4 depicts protein band intensity of SPI and the GMO, non-GMO, Anjasmoro, and Grobogan SPI-lactose conjugates after analysis with GelAnalyzer 2010a software. The glycation treatment can reduce the intensity of protein band and even eliminate some protein bands. Some of the missing protein bands are believed to be major allergens in soy.26 Major allergenic proteins in soybean are Gly m Bd 30K or P34, Gly m Bd 28K, and Gly m Bd 60K. Table 3 shows that Gly m Bd 30K allergenic protein was found in all sample varieties. 27Gly m Bd 30K is a major allergenic protein in soybean that can bind specifically to IgE antibodies in 65% patients with soybean allergy. This protein can be eliminated after glycation treatment in non-GMO and Anjasmoro SPI-lactose conjugate. Meanwhile, Gly m Bd 60K was discovered in most of soybean varieties used. Glycation by 60 minutes incubation can eliminate this major allergenic protein in GMO and Anjasmoro SPI-lactose conjugates. In contrast, Gly m Bd 28K was only found in SPI of Grobogan variety. The glycation treatment can reduce the band intensity of this allergenic protein. 25Gly m Bd 60K and Gly m Bd 28K can bind to IgE in 25% patients with soybean allergy. However, there are limitations in this study to furtherly prove that protein bands elimination can be caused by glycation treatment. Additional research using Schiff’s base to detect glycoproteins which show the presence of sugar in glycated samples needs to be performed.
Table 3: Molecular weight of SPI dan SPI-lactose conjugate in soybean varieties
| Molecular weight (kDa) | 28Protein suspected | |||||||
| GMO | GMO-lactose | NGM | NGM-lactose | ANJ | ANJ-lactose | GRO | GRO-lactose | |
| 67.8 | 67.8 | 61.9 | – | 64.3 | – | – | – | Gly m Bd 60K |
| 54.3 | – | 49.0 | – | 55.5 | 55.5 | 56.1 | – | 7S-globulin |
| 42.4 | 42.4 | – | – | – | – | – | – | β subunit of β conglycinin |
| – | – | – | – | 41.4 | 41.4 | – | – | 11S-globulin |
| – | – | 38.7 | 38.7 | – | – | – | – | 7S-globulin |
| 31.9 | – | 31.5 | 31.5 | 32.1 | – | 34.7 | 34.7 | Gly m Bd 30K or P34 |
| – | – | – | – | – | – | 26.9 | 26.9 | Gly m Bd 28K |
| 19.4 | 19.4 | 19.4 | 19.4 | 21.3 | 21.3 | 18.1 | 18.1 | Whey fraction |
| 17.0 | 17.0 | – | – | – | – | – | – | Gly m4 or2S-globulin |
| – | – | – | – | 13.9 | 13.9 | – | – | Gly m3. profilin |
| 11 | 11 | 12.9 | 12.9 | 11.3 | 11.3 | 12.6 | 12.6 | Methionine rich protein |
| 10.7 | 10.7 | |||||||
Note : GMO: Genetically Modified Organism; NGM: Non-GMO; ANJ: Anjasmoro; and GRO: Grobogan
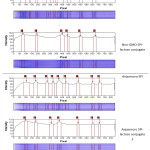 |
Figure 4: Protein band intensity of SPI and SPI-lactose conjugate in soybean varieties Click here to View figure |
Allergenicity of SPI and SPI-Lactose Conjugate
The subject of this study was confirmed soybean allergy by clinical history after the ingestion of soybean. Symptoms ranged from urticaria, angioedema and atopic dermatitis. The subject was confirm only suffered from allergic symptoms caused by soybean, not from other food as well as pollen. ELISA analysis was used to determine immunological response that is the reactivity of serum antibody against SPI-lactose conjugate from several sample varieties resulting from 60 minutes glycation. The reduction of soybean isolate allergenicity was confirmed by the reduction of optical density of human IgE binding to soybean isolate protein by ELISA assay. Figure 5 illustrates that glycation treatment can reduce the serum reactivity level of patients against various SPI-lactose conjugates, shown by OD values lower than SPI without glycation treatment. Changes in the level of reactivity can occur due to alteration of soy protein structure during glycation reaction. Alteration of protein structure, especially in the epitope region of soy protein, causes antibodies to no longer recognize it as antigen. The greater the changes occuring in protein structure, the lower the immune response released by antibodies.
Based on the analysis results of the serum reactivity of patients in Figure 5, it is understood that different immunological responses can be produced from the four soybean varieties. When comparing the OD values of each SPI, the Anjasmoro SPI showed the highest reactivity response and was followed sequentially by Grobogan, non-GMO, and GMO soybeans. This shows that in general, local soybeans have the most allergens that bind specific IgE. Moreover, there were differences in OD values between GMO soybeans and non-GMO soybeans. Non-GMO soybeans have higher allergenicity than GMO soybeans, which indicates that GMO soybeans are less allergenic than non-GMO soybeans. GMO and non-GMO soybeans used are not from same variety. In this study an approach was carried out by using samples from imported varieties of GMO and non-GMO soybean, which were widely sold in local market, and local varieties of non-GMO soybean.
There was a difference in OD values between SPI-lactose conjugates and SPI before glycation treatment. Glycation treatment with lactose for 60 minutes caused a reduction in OD values. Comparing with SPI from each variety, Anjasmoro SPI-lactose conjugate showed the most OD reduction, followed by non-GMO soybeans, GMOs, and Grobogan, sequentially. This indicates that glycation reaction role to alter protein structure most effectively shown in Anjasmoro soybean. On the contrary, analysis result of Grobogan SPI-lactose conjugate showed reactivity that were still somewhat high. The glycation treatment was apparently not very effective in altering the protein structure in Grobogan soybean hence the high reactivity response to antibodies. This furtherly supported by the results of SDS PAGE analysis in Figure 4, which shows a comparatively thick protein band found in the product of Grobogan SPI-lactose conjugate. Suboptimal alteration in protein structure can cause the paratope side of antibody to still recognize the epitope side of antigen consequently prompting reactivity response. 29Maillard reaction product (MRP) which is the result of reaction between reducing sugars and allergen proteins, can mask epitopes and prevent IgE binding, thereby reducing allergenicity.
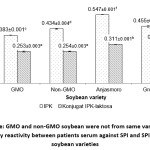 |
Figure 5: Immunology reactivity between patients serum against SPI and SPI-lactose conjugate in soybean varieties Click here to View figure |
Table 4 shows the percentage of allergenicity reduction of SPI-lactose conjugate in several soybean varieties. Anjasmoro SPI-lactose conjugate showed the highest percentage of allergenicity reduction compared to other varieties at 43.12%, followed by non-GMO SPI-lactose conjugate at 41.57%. Results from ELISA are in agreement with results from analysis of glycation degree, that non-GMO SPI-lactose conjugate has the highest degree of glycation. Similarly, analysis of molecular weight profile with SDS-PAGE electrophoresis showed that glycation treatment on SPI of Anjasmoro and non-GMO soybean was the most capable to eliminate protein bands. On the contrary, SPI-lactose conjugate of Grobogan soybean produced the lowest percentage of reactivity reduction, which was 29.85%. Grobogan SPI-lactose conjugate has the highest OD value. This shows that Grobogan SPI-lactose conjugate has the most allergens that bind to specific IgE. The result is also directly proportional to SDS-PAGE electrophoresis result which showed that only one protein band was eliminated from Grobogan SPI-lactose conjugate. Overall results of this ELISA analysis indicates that glycation treatment can reduce the allergenicity of SPI from various kind of soybean, although not capable to completely eliminate it. The decrease in optical density value using ELISA testing can indicate a change in the soy protein epitope during processing, thereby reducing the specific IgE binding capacity of soy protein isolate. Based on this, it can be concluded that the decrease in protein (epitope) during processing can reduce the severity of clinical symptoms of allergy sufferers.
Table 4: Allergenicity reduction of SPI-lactose conjugate from soybean varieties
| Soybean Variety | Allergenicity Reduction (%) |
| GMO | 33.92±0.95b |
| Non-GMO | 41.57±1.26c |
| Anjasmoro | 43.12±0.24c |
| Grobogan | 29.85±0.21a |
Conclusion
Analysis results of glycation levels in various imported soybean (GMO and non-GMO) and local (Anjasmoro and Grobogan) showed that the higher the protein content of soy protein isolates, the higher the glycation degree of SPI-lactose conjugates. SDS-PAGE electrophoresis results showed that the molecular weight profiles of GMO, non-GMO, Anjasmoro and Grobogan SPI were ranging from 11-147.7 kDa, 12.9-150.3 kDa, 11.3-144.2 kDa, and 10.7-159.0 kDa, respectively. Glycation treatment could eliminate or reduce the intensity of protein bands suspected to be major allergen proteins in soybeans, namely Gly m Bd 60K, Gly m Bd 30K or P34, and Gly m Bd 28K. Glycation reaction could reduce allergenicity in several soybean varieties by 29.85-43.12%.
Acknowledgement
Thanks to the Directorate-General of Research Empowerment and Innovation, Ministry of Research, Technology, and Higher Education Indonesia who have funded this research through the program of Penelitian Dasar Unggulan Perguruan Tinggi (PDUPT- Primary Research Program of Higher Education) in fiscal year 2018, number: 1772 / IT3.11 / PN / 2018. A selection of the data from this paper had been presented orally at the “2019 International Joint Conference on JSAM, SASJ and 13th CIGR VI Technical Symposium joining FWFNWG and FSWG workshops”, on 3-6 September 2019, in Sapporo, Japan.
References
- Simons FER, Ardusso LRF, Bilo BM, Gamal YM, Ledford DK, Ring J, Sanchez-Borges M, Senna GE, Sheikh A, Thong BY: World Allergy Organization. World Allergy Organization Guidelines for the Assessment and Management of Anaphylaxis. WAO Journal. 2011; 4(2):13-37
- Fiocchi A, Sampson HA, Bahna SL, Lack G. Food Allergy. Pawankar R, Canonica GW, Holgate ST, Lockey RF, editor. Milwaukee, Wisconsin, United States of America: World Allergy Organization (WAO). 2011
- Savage JH, Kaeding AJ, Matsui EC, Wood RA. The natural history of soy allergy. Allergy Clin. Immunol. 2010;125(3):683–686.doi:10.1016/j.jaci.2009.12.994.
- Munasir Z, Muktiarti D. The management of food allergy in Indonesia. Asia Pac. Allergy. 2013;3:23–28. doi:10.5415/apallergy.2013.3.1.23.
- Candra Y, Setiarini A, Rengganis I. Gambaran Sensitifitas Terhadap Alergi Makanan. Makara J. Heal. Res. 2011;15(1):44–50.
- Candra Y, Setiarini A, Rengganis I. Gambaran Sensitifitas Terhadap Alergi Makanan. Makara J. Heal. Res. 2011;15(1):44–50.
- Verhoeckx KCM, Vissers YM, Baumert JL, Faludi R, Feys M, Flanagan S, Herouet-Guicheney C, Holzhauser T, Shimojo R, van der Bolt N, et al. Food processing and allergenicity. Food Chem. Toxicol. 2015;80:223–240. doi:10.1016/ j.fct.2015.03.005.
- Ogawa T, Bando N, Tsuji H, Okajima H, Nishikawa K, Sasaoka K. Investigation of the IgE-binding proteins in soybeans by immunoblotting with the sera of the soybean-sensitive patients with atopic dermatitis. Nutr. Sci. Vitaminol. 1992;37(6):555–565. doi:10.3177/jnsv.37.555.
- Bu G, Zhang N, Chen F. The influence of glycosylation on the antigenicity, allergenicity, and structural properties of 11S-lactose conjugates. Food Res. Int. 2015;76:511–517. doi:10.1016/j.foodres.2015.08.004.
- Badan Pusat Statistik. 2017. Produksi Kedelai Menurut Provinsi pada tahun 2013-2017. https://bulelengkab.go.id/assets/instansikab/126/bankdata/data-statistik-produksi-kedelai-menurut-propinsi-th-2013-2017-81.pdf. Accessed: 2018 April 10.
- Gonzalez-Morales S, Cruz-Requena M, Rodriguez-Vidal A, Aguilar-Gonzalez CN, Rebolloso-Padilla ON, Rodriguez-Herrera R. Persistence of transgenic genes and proteins during soybean food processing. Food Biosci. 2015;11:43–47. doi:10.1016/j.fbio.2015.04.002.
- Nakamura S, Suzuki Y, Ishikawa E, Yakushi T, Jing H, Miyamoto T, Hashizume K. Reduction of in vitro allergenicity of buckwheat Fag e 1 through the Maillard-type glycosylation with polysaccharides. Food Chem. 2008;109(3):538–545. doi:10.1016/j.foodchem.2007.12.075.
- Liu C, Wang H, Cui Z, He X, Wang X. Optimization of extraction and isolation for 11S and 7S globulins of soybean seed storage protein. Food Chem. 2007;102:1310–1316. doi:10.1016/j.foodchem.2006.07.017.
- Speroni F, Milesi V, Añón MC. Interactions between isoflavones and soybean proteins : Applications in soybean-protein isolate production. Food Sci. Technol. 2010;43:1265–1270.doi:10.1016/j.lwt.2010.03.011.
- van de Lagemaat J, Manuel Silván J, Javier Moreno F, Olano A, Dolores del Castillo M. In vitro glycation and antigenicity of soy proteins. Food Res. Int. 2007;40(1):153–160. doi:10.1016/j.foodres.2006.09.006.
- Seri A, Khorsand M, Rezaei Z, Hamedi A, Takhshid MA. Inhibitory Effect of Bunium Persicum Hydroalcoholic Extract on Glucose-Induced Albumin Glycation , Oxidation , and Aggregation In Vitro. Iran J Med Sci. 2017;42(4):369–376.
- Bradford MM. A rapid and sensitive method for the quantitation of microgram quantities of protein utilizing the principle of protein-dye binding. Biochem. 1976;72(1–2): 248–254. doi:10.1016/0003-2697(76)90527-3.
- Laemmli UK. Cleavage of structural proteins during the assembly of the head of bacteriophage T4. Nature. 1970;227:680–685.
- Song YS, Frias J, Martinez-Villaluenga C, Vidal-Valdeverde C, de Mejia EG. Immunoreactivity reduction of soybean meal by fermentation, effect on amino acid composition and antigenicity of commercial soy products. Food Chem. 2008;108(2):571–581. doi:10.1016/j.foodchem.2007.11.013.
- Bu G, Luo Y, Lu J, Zhang Y. Reduced antigenicity of β -lactoglobulin by conjugation with glucose through controlled Maillard reaction conditions. Food Agric. Immunol. 2010;21(2):143–156. doi:10.1080/09540100903452122.
- Asyhari MH, Palupi NS, Faridah N. Karakteristik kimia konjugat isolat protein kedelai-laktosa yang berpotensi dalam penurunan alergenisitas. Teknol dan Ind. Pangan. 2018;29(1):39–48. doi:10.6066/jtip.2018.29.1.39.
- Palupi NS, Sitorus SR, Kusnandar F. Perubahan alergenisitas protein kacang kedelai dan kacang bogor akibat pengolahan dengan panas. Teknol dan Ind. Pangan. 2015;26(2):222–231. doi:10.6066/jtip.2015.26.2.222.
- Suseno R, Palupi NS, Prangdimurti E. Alergenisitas Sistem Glikasi Isolat Protein Kedelai-Fruktooligosakarida. Agritech. 2016;36(4):450–458. doi:10.22146/ agritech.16770.
- Astuti RM, Palupi NS, Zakaria FR. Allergic reactivity of bambara groundnut (Vigna subterranea) proteins. Food Agric. Immunol. 2016;27(4):535–546. doi:10.1080/ 09540105.2015.1129601
- Kusumasari S. Validasi Metode Deteksi Alergen Kedelai dan Aplikasinya dalam Pengembangan Isolat Protein Kedelai dan Susu Kedelai Hipoalergenik [thesis]. Bogor (ID): IPB University. 2017
- Ogawa T, Samoto M, Takahashi K. 2000. Soybean allergens and hypoallergenic soybean products. Nutr. Sci. Vitaminol. 2000;46(3):271–279. doi:10.3177/ jnsv.46.271.
- Ogawa T, Bando N, Tsuji H, Okajima H, Nishikawa K, Sasaoka K. Investigation of the IgE-binding proteins in soybeans by immunoblotting with the sera of the soybean-sensitive patients with atopic dermatitis. Nutr. Sci. Vitaminol. 1992;37(6):555–565. doi:10.3177/jnsv.37.555.
- Amnuaycheewa P, de Mejia EG. Purification, characterisation, and quantification of the soy allergen profilin (Gly m 3) in soy products. Food Chem. 2010;119: 1671–1680. doi: 10.1016/j.food chem.2009.09.034
- Teodorowicz M, Neerven J van, Savelkoul H. Food Processing: The Influence of the Maillard Reaction on Immunogenicity and Allergenicity of Food Proteins. Nutrients. 2017;9(835):1–18. doi:10.3390/nu9080835
Accepted on: 24/03/2020
Second Review by: Dr. Mahesh PA India
Final Approval by: Dr. Daniel Cozzolino


Web of Science Coverage
Emerging Sources Citation Index (ESCI)
2024 Journal Impact Factor: 1.1
Scopus Journal Metrics
CiteScore 2025: 2.6
CiteScore Details
Sustainable Nutrition: Food Systems, Nutrient Retention, and Public Health Impact
![]()
This journal is a member of, and subscribes to the principles of, the Committee on Publication Ethics (COPE)


