

Introduction
The safety of meat products is possibly threatened by the presence of chemical pollutants, such as mycotoxins, drugs, and pesticide residues. Mycotoxins are natural contaminants formed by definite species of fungi and their presence in food increases attention in terms of public health and food safety. The more common and the most harmful types of mycotoxins are aflatoxins (AFs), which are the most poisonous produced from some Aspergillus species (A. flavus, A. parasiticus and A. nomius) as secondary metabolites 1, 2. The four major AFs are called AFB1, B2, G1 and G2, based on fluorescence (blue or green) and chromatographic analysis 3. Besides acute toxicity, AFs are linked with cancer in both humans and animals 4. The harmful effect of AFs on consumers depends on the concentration and exposure time, age, gender, health condition, state of immunity, diet and environmental factors 5.
Luncheon and kofta (the Egyptian name of meat balls) are popular widely consumed traditional Egyptian meat products. These products are formulated from meat and nonmeat additives 6. Research works have demonstrated a high incidence of AFs in both products 7, 8, 9 sometimes with levels passing the regulated limits. AFs are tolerant to traditional industrial processes applied to raw materials 10, 11; so, if raw constituents are polluted, these AFs will occur in processed meals. Besides, the majority of AFs are heat tolerant and therefore decomposition during cooking or processing does not occur 12.
To protect consumers from harmful effects of AFs, researches have tried some approaches to minimize the hazard. Although many these approaches not only detoxify AFs but also control the growth of microorganisms in food, in the food industry, safety is still the most important goal. Irradiation could decrease the concentration of AFs in food 13, 14 but generally, such treatment is not a recommended strategy for AFs detoxification in food industry due to possible molecular reactions 15, 16. So research works are directed towards the green methods of AFs degradations. These studies revealed that ozone (O3) in one of them can do 17, 18.
Food and Drug Administration of the U.S. and the World Health Organization (WHO) has considered using O3 technology in food to be safe and effective 19, 20. Consequently, O3 treatment is regarded as one of many established processes that contribute to the improvement of food product safety and quality. This study was planned to evaluate the effectiveness of O3 in reducing or eliminating AFs in the traditional meat products luncheon and kofta and its effects (if any) on their, physical properties and lipid stability.
Material and Methods
Collection of Samples
Fifty random samples (100gm for each) of locally produced meat products represented by ready to eat beef luncheon and frozen kofta (25 each) were collected through October 2020 from Assiut city markets, Egypt. The samples transported cooled in their packages to the laboratory and stored frozen until analyses were conducted as soon as possible.
Quantitative Measurement of Aflatoxin Residues (AFB1, B2, G1, and G2):
The analysis was carried at the Central Accredited Lab. for Forensics Studies, Faculty of Vet. Med. Assiut University, Egypt following procedures of Cui et al. 21.
Aflatoxins Working Standards
Aflatoxins standards AFB1, B2, G1, and G2 (purity ≥ 99.0%) were obtained from Sigma-Aldrich (St. Louis, USA). A vial of AFs mixed standard powder containing 5 mg (2 mg AFB1, 2 mg AFG1, 0.5 mg AFB2, and 0.5 mg AFG2) was used to make the stock standard solution, which was made by dissolving the powder in 10 ml of acetonitrile (99.9% of HPLC grade, Fisher Company USA) to make a stock solution of 500 ppm concentration. Twenty μl of AFs mixture (AFB1, B2, G1, and G2) was dissolved in 10 ml of methanol (99.9% of HPLC grade, Fisher Company, USA) to get AFs (AFB1, B2, G1, and G2) stock solution 22.
Aflatoxins Extraction
According to the guidelines extractions of AFB1, B2, G1, and G2 from samples have proceeded 23. A 2 g sample was minced with a tissue grinder, and 20 milliliters of dichloromethane was added to the mixture, which was ultrasonicated for 10 minutes and shaken continuously for 1 hour. Anhydrous sodium sulfate (2 g) was added, and the mixture was centrifuged for 5 minutes at 10,000 rpm. Finally, 10 mL of supernatant was collected and dried in a water bath at 50°C using a Termovap apparatus (American Organomation Associates).
Clean-Up
The cleanup procedures were carried out in accordance with R-Rhône Biopharm’s 24 requirements. In a summary, 2 mL methanol and 13 mL phosphate buffer saline were added to the residue and thoroughly mixed together. After that, 1 mL methanol was used to elute the sample. The solution across through the immunoaffinity column at a rate of 1–2 drops per second. The column was rinsed with 10 mL deionized water, and the entire eluate was dried in a water bath at 50°C in a Termovap apparatus. The residue was placed in a water bath at 40°C for 15 minutes, then 100 μl trifluoroacetic acid and 200 μl hexane was added, and it was dried again at 50°C with a gentle stream of nitrogen. Finally, UPLC-FLD was used to detect the level of AFs (B1, B2, G1, and G2) residues.
UPLC-FLD Analysis
Aflatoxins (AFB1, B2, G1, G2) were determined using Acquity (Waters, USA) Ultra-High-Performance Liquid Chromatography (UPLC) with a Fluorescence Detector (FLD, Waters, USA). The evaluation used a chromatographic column (Waters Acquity UPLC BEH C18) with a size of (1.7 m 2.1 mm 100 mm) for analyte separation, a flow rate of 0.4 ml/min, and 10μl injection volume. Methanol, acetonitrile, and water made up the mobile phase (18:18:64). AFG2, AFG1 had excitation and emission wavelengths of 365 and 456 nm, respectively, whereas AFB2 and AFB1 had excitation and emission wavelengths of 365 and 429 nm, respectively. The system was computer-controlled, and the data was analyzed using EMPOWER3 software.
Treatment with Ozone
Generation of Ozone
Ozone gas was generated from a Cold Plasma Ozone Generator (Longetviy, Canada), using oxygen at a flow rate of 0.25 L/minute, with a working voltage of 220 volts, at ambient temperature. The ozone generator was controlled to generate O3 at a required concentration (20 or 40 ppm). The concentrations of O3 were calibrated by iodometric titration method where generated O3was injected to KI solution for 5 minutes and titrated against sodium thiosulphate. The concentration of O3 was calculated from the equation recommended by Chasanah et al. 25.
C ozone =R x Vt x Nt /Vgas
Where:
C ozone is the concentration of O3 (g / L).
R is the ratio of the analytical mol and the reactant of a balanced chemical equation, Vt is the volume of titrant (L). Nt is the normality of sodium thiosulfate (mol / L), and Vgas is the volume of air.
Treatment with Ozone
Samples were prepared to simulate retail conditions, where 5 mm thick luncheon slices (10) / 5 meatballs (kofta) weighing (20 g each) were placed in a perforated foam plate separately and warped with a plastic net. Each type of sample was divided into two subgroups. Each subgroup was submitted to a separate dose of 20 or 40 ppm. Meatballs/luncheon slices (4 foam plates) were placed into vacuum package bags separately and either sealed immediately (control) or treated with O3. Before passing O3, the bag was air evacuated using a suction plumb then connected to the current of O3 for 5 minutes. While samples were exposed to O3, the bag was agitated to allow all surfaces to be adequately exposed to the O3 gas. Ozone was left to react for 20 minutes then the bags were evacuated via a tube into a 2% KI solution to prevent passing excess O3 to the environment 26.
Effect of Ozone on Aflatoxins and Physicochemical Attributes
Treated and control samples were submitted to AFs, pH, and thiobarbituric acid (TBA) analysis.
Effect of Ozone on Aflatoxins
After estimation of AFs levels, AFs degradation percentage (AFsD %) was calculated from the formula
AFs D %= (Control level – Treatment level) x100/Control level
Measurement of pH
The pH values were estimated according to Elbazidy et al. 27 where a 5g sample was homogenized for 10-15 seconds in 20 ml distilled water, and the pH of the slurry was measured with a calibrated pH (by buffers of pH 7.0 and 4.0) digital pH meter (Gallenhamp No.101284) at ambient temperature.
Determination of Thiobarbituric Acid (TBA)
5g sample was homogenized with 15 ml of deionized distilled water using a stomacher for 10 seconds at the highest speed, as described by DU and Ahn 28. One ml from the homogenate was mixed with 50 μl butylated hydroxyl anisole (7.2%) and 1 ml each of 15mM 2-thiobarbituric acid and 15% trichloroacetic acid. The mixture was vortexed, then incubated for 15 minutes in a boiling water bath to produce color. It was then cooled for 10 minutes under running water, vortexed again, then centrifuged for 15 minutes at 2500 g. At 531 nm, the absorbance of the resultant supernatant solution was measured against a blank containing 1 mL deionized water and 2 mL TBA–TCA solution. The reading was multiplied by 7.8 to obtain the value of TBA (mg of malonaldehyde (MDA) /kg of the sample).
Statistical Analysis
In each test, the mean and standard deviation values were determined for each group. The Kolmogorov-Smirnov and Shapiro-Wilk tests were used to look for normality in the data, which revealed a non-parametric (not normal) distribution. To compare two groups in unrelated samples, the Mann-Whitney method was employed. P ≤ 0.05was used as the significant threshold. IBM® SPSS® Statistics Version 26 for Windows was used to conduct the statistical analysis.
Results
The distribution of AFs in fifty random samples of two locally produced meat products (beef luncheon and frozen kofta) shows that AFs nearly recorded by parallel levels for both products. AFB1 was recorded in 96% and 88% of kofta and luncheon, respectively. Furthermore, 92% of kofta and 88% of luncheon revealed AFB2 while AFG2 was detectable in 84 and 88%, respectively. On the contrary, AFG1 was predominated in kofta samples (64%) compared to 12% in luncheon (Table 1).
Levels of AFs in meat products illustrated in Table 2, the mean of AFs was 4.8 and 15.2 ppb, for luncheon and kofta, respectively.
The samples and their response to ozonation were listed in tables 3 and 4. For ready-to-eat luncheon, treatment with 20ppm O3, AFB2 resulted in a reduction of 67.1% followed by AFB1 and AFG2 where reductions were 55.2 and 34.3%, respectively. At 40 ppm, AFG1 appeared the highest detoxification degree where none of the exposed samples revealed the detectable level of the toxin (100% reduction). Also, exposure to O3 resulting a reduction of 85.7, 83.8, and 54.6 for AFB2, B1, and G2, respectively (Table 3 and Figure 1).
For the raw meat product (kofta), the responses of AFs to O3 were summarized in table 4 and figure 2. At 20 ppm O3, the highest reduction was achieved in AFG1 and AFB2 (68.31% and 67.7%) respectively, followed by AFG2 and AFB1 (61.92 %and 38.72%) respectively. Also at 40 ppm O3, the highest reduction was achieved in AFB2 and AFG1 (91.71% and 78.35%) respectively, followed by AFG2 and AFB1 (75.15% and 61.37%) respectively.
After treatment with O3, the physical status of meat products is expressed in pH values as illustrated in table 5. By the two applied concentrations of O3, the pH values were none significantly (p > 0.05) affected. The response of fat to O3 treatment in raw and ready-to-eat meat products was illustrated in table 6. At 20 ppm O3 fat was more stable compared to 40 ppm where the raw product (kofta) appeared higher stability compared to ready-to-eat (luncheon). In kofta samples treated with 20 ppm O3, 83.3% (10/12) of samples agreed with the allowed level of TBA in meat products (not more than 0.9 mg MDA/Kg) while, at 40 ppm O3 58.3% (7/12) of treated samples still meeting the allowed limit. In the case of treated luncheon, 69.2% (9/13) and 23.1% (3/13) of treated luncheon met the allowed level of TBA for 20 and 40 ppm O3, respectively.
Table 1: Distribution of Aflatoxins in Meat Products.
| Products | Aflatoxins | |||||||||
| AFB1 | AFB2 | AFG1 | AFG2 | Total | ||||||
| No. +ve | % | No. +ve | % | No. +ve | % | No. +ve | % | No. +ve | % | |
| Luncheon | 22 | 88 | 23 | 92 | 3 | 12 | 22 | 88 | 25 | 100 |
| Kofta | 24 | 96 | 22 | 88 | 16 | 64 | 21 | 84 | 25 | 100 |
No. +ve Number of positive
Table 2: Levels of Aflatoxins (ppb) in Meat Products.
| Luncheon | Kofta | |||||||||
| Aflatoxin (ppb) | Aflatoxin (ppb) | |||||||||
| B1 | B2 | G1 | G2 | Total | B1 | B2 | G1 | G2 | Total | |
| Min. | 0.03 | 0.047 | 1.93 | 0.591 | 1.032 | 0.686 | 0.098 | 1.534 | 0.071 | 2.651 |
| Max. | 3.7 | 6.788 | 3.555 | 8.738 | 15.284 | 4.115 | 4.06 | 52.938 | 9.457 | 53.674 |
| Mean | 1.136 | 1.105 | 2.478 | 2.781 | 4.761 | 2.085 | 0.81 | 15.894 | 2.709 | 15.162 |
| SD | 0.9961 | 1.44 | 0.9329 | 2.422 | 3.742 | 1.016 | 0.9885 | 15.42 | 2.003 | 13.19 |
SD Standard deviation
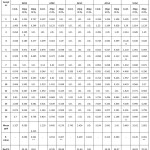 |
Table 3: Effect of Ozone on Aflatoxin Levels in Luncheon. |
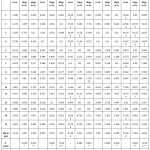 |
Table 4: Effect of Ozone on Aflatoxin Levels in Kofta. |
Table 5: Effect of Ozone on pH in Luncheon & Kofta.
| Samples No. |
pH values | |||||
| Luncheon | Kofta | |||||
| Cont. | 20ppp O3 | 40pp O3 | Cont. | 20ppp O3 |
40pp O3 |
|
| 1 | 5.19 | 5.19 | 5.11 | 5.65 | 5.2 | 5.11 |
| 2 | 5.27 | 4.87 | 4.71 | 4.96 | 4.95 | 4.89 |
| 3 | 5.37 | 5.37 | 5.36 | 4.88 | 4.8 | 4.67 |
| 4 | 4.82 | 4.81 | 4.8 | 4.9 | 4.89 | 4.72 |
| 5 | 6.15 | 6.11 | 6.11 | 4.95 | 4.90 | 4.89 |
| 6 | 6.1 | 6.08 | 6.07 | 5.14 | 5 | 4.99 |
| 7 | 6.28 | 6.27 | 6.20 | 4.54 | 4.48 | 4.35 |
| 8 | 6.1 | 6.06 | 5.94 | 5.1 | 4.95 | 4.94 |
| 9 | 6.31 | 6.27 | 6.26 | 5.14 | 5.13 | 5.01 |
| 10 | 5.98 | 5.92 | 5.91 | 5.03 | 5.03 | 5.02 |
| 11 | 6.03 | 6.02 | 6.01 | 5.01 | 4.99 | 4.98 |
| 12 | 5.97 | 5.98 | 6 | 5.84 | 5.78 | 5.76 |
| 13 | 6.02 | 5.95 | 5.91 | 4.75 | 4.74 | 4.63 |
| 14 | 6.24 | 6.19 | 6.13 | 5.1 | 5.08 | 5.04 |
| 15 | 5.33 | 5.32 | 5 | 5.53 | 5.09 | 5.06 |
| Mean | 5.81 | 5.76 | 5.7 | 5.1 | 5 | 4.93 |
| P-value | – | 0.633 | 0.372 | – | 0.350 | 0.158 |
Table 6: Stability of Fat in Luncheon & Kofta Treated with Ozone.
| Samples No. |
TBA values (mg MDA/g) | |||||
| Luncheon | Kofta | |||||
| Cont. | 20ppp O3 | 40pp O3 | Cont. | 20pppO3 | 40ppO3 | |
| 1 | 0.245 | 0.745 | 1.073 | 0.31 | 0.683 | 0.982 |
| 2 | 0.497 | 0.523 | 0.719 | 1.522 | 2.11 | 2.21 |
| 3 | 0.346 | 0.618 | 1.411 | 0.32 | 0.391 | 0.497 |
| 4 | 0.593 | 0.845 | 1.25 | 0.245 | 0.553 | 1.1 |
| 5 | 1.183 | 1.789 | 1.819 | 0.795 | 0.931 | 1.61 |
| 6 | 0.562 | 0.853 | 1.121 | 0.446 | 0.547 | 0.946 |
| 7 | 0.252 | 0.949 | 1.232 | 0.315 | 0.547 | 0.668 |
| 8 | 1.181 | 1.338 | 1.539 | 0.416 | 0.547 | 0.689 |
| 9 | 0.076 | 0.278 | 0.509 | 0.088 | 0.179 | 0.315 |
| 10 | 0.277 | 1.287 | 1.691 | 0.456 | 0.461 | 0.598 |
| 11 | 0.772 | 0.878 | 1.1 | 0.527 | 0.578 | 0.669 |
| 12 | 0.278 | 0.606 | 0.697 | 0.668 | 1.305 | 1.507 |
| 13 | 0.646 | 1.136 | 1.317 | 0.431 | 0.467 | 0.901 |
| 14 | 0.535 | 1.08 | 1.681 | 0.911 | 1.805 | 1.814 |
| 15 | 0.278 | 0.348 | 1.482 | 0.906 | 1.279 | 1.486 |
| Mean | 0.515 | 0.885 | 1.243 | 0.557 | 0.825 | 1.066 |
| P-value | – | 0.007** | <0.001** | – | 0.065 | 0.004** |
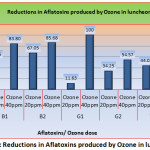 |
Figure 1: Reductions in Aflatoxins produced by Ozone in luncheon. |
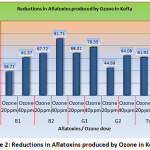 |
Figure 2: Reductions in Aflatoxins produced by Ozone in Kofta. |
Discussion
Contamination with AFs represents one of the problems threatening food industries due to their serious harms to human health. Recently, both B- and G-type AFs are categorized as Group 1 mutagens by the International Agency for Research on Cancer (IARC) 29. In the preliminary work of the current study, the AFs load of luncheon and kofta was evaluated. Table1 summarized the distribution of AFs in the two assessed products. With exception of AFG1 which predominated in kofta samples (64%) comparing to 12% in luncheon, other AFs nearly recorded by parallel levels for both products. AFB1 is the highest lethal mycotoxin for humans 30. It was recorded in 96% and 88% of kofta and luncheon, respectively. Furthermore, 92% of kofta and 88% of luncheon revealed AFB2 while AFG2 was detectable in 84 and 88%, respectively.
At least two of the four major AFB1, B2, G1 and G2 were detected in 100% of luncheon and kofta with a mean of 4.8 and 15.2 ppb, respectively, table 2.The findings of present study coordinate with those of Karmi 8, Shaltout et al. 31 and Soliman et al. 32 in exploring the role of luncheon and kofta in delivering AFs to consumers with their findings for total AFs are higher than current study.
Contamination of meat and meat products with AFs occurs through two routes. The first comes from feeding of the animals with contaminated feed which accumulates toxin residues in their tissues. The second way is the contamination that can occur during the processing, preservation and distribution of meat and meat products 33. The Food and Agriculture Organization (FAO) focus on the hidden route of mycotoxins pollution to meat products through the contaminated animal feedstuffs. Mycotoxins are estimated to contaminate up to 25% of the world’s food crops and an even larger percentage of animal feedstuffs 34.
The products under investigation are stored meat products where fungi constitute a significant division of their flora. The incidence of the various toxigenic genera in luncheon and kota has been documented by several research works. In addition, in vitro studies have proven the mycotoxins producing ability of these genera 9, 32, 35, 36. The generation of AFs is directly tied to the proliferation of aflatoxigenic fungus 37. Also reports cleared that AFs are especially problematic in hot (30 to 40°C) dry climates 5. Such favorable environmental conditions predominate the climate of the year in Assiut Governorate. Meanwhile, luncheon and kofta are formulated from meat and nonmeat additives. Related studies appeared that several AFs co-occur in contaminated commodities of meat cuts 38, spices 13 and meat additives 39 so the occurrence of AFs in such formulated products was not surprising.
The detected AFs (AFB1,B2,G1 and G2) are characterized by their high temperature of hydrolysis (268°C-269°C) for AFB1, (244°C-246°C) for AFG1 , (268°C-289°C) forAFB2 and (240°C-247°C) for AFG2 40. These temperatures not achieved during processing of luncheon or by any cooking method for kofta. Consequently, the high AFs detoxification resistance to heat treatment necessitates the development of alternative effective methods.
In the experimental part of the present study, O3 was tried as a green approach to control the hazard of AFs in meat products. The samples and their response to ozonation were listed in tables 3 and 4. As a post-processing step for ready to eat luncheon, the degree of detoxification was proportional to O3 dose, table 3. At 20ppm O3, AFB2 was the most liable to treatment with a resulted reduction of 67.1% followed by AFB1 and AFG2 where reductions were 55.2 and 34.3%, respectively. At 40 ppm, AFG1 appeared the highest detoxification degree where none of exposed samples revealed detectable level of the toxin (100% reduction). Also exposure to O3 was effective in minimizing the hazard of other three AFs with a resulting reduction of 85.7, 83.8 and 54.6 for AFB2, B1 and G2, respectively (figure 1).
For the raw meat product, O3 was applied as a processing step in raw kofta. The responses of AFs to O3 were summarized in table 4 and figure 2. As for luncheon, the detoxification ability appeared proportional to O3 concentration. At 20 ppm O3 the highest reduction was achieved in AFB2 (67.7%). Also the same toxin was the most reduced (91.7%) by 40 ppm O3.The present findings shared the observation with Agriopoulou et al. 15 that AFG1 appeared to be the most sensitive to O3 especially at 40 ppm O3 but not well coordinate with the observation of Proctor et al. 41 that the rate of degradation was higher for AFB1 and AFG1, compared to AFB2 and AFG2.The variation of response of AFs to O3 may due to difference in food matrix, concentration of O3, conditions of applications and whether samples were naturally or artificially contaminated.
Gaseous ozone had the ability to degrade AFs in many commodities and operation conditions. The degradation percentage ranged from 24 to 100% according O3 dose and kind of food 40. Also by O3, the rate of degradation of AFB1 varied from 25% 43 to 96.6% 44 in agriculture products. For AFB2 the degradation rate was 84.5 % 44 while that recorded by Luo et al. 45 was 70.9%. Meanwhile, AFG1could be degraded by O3 by rate of 70.6% 45.
Within the analyzed meat products, none of the samples revealed levels passing the permissible limit of total AFs (20ppb) recommended by FAO 46 for human foods. By the respect, it is well established that there is no AFs dose below which tumour development is not possible. To put it another way, only a zero amount of exposure will result in no harm to public health 47. Besides, AFB1, B2, G1, G2 were detected in the samples characterized by high potency of toxicity, carcinogenicity, and mutagenicity 2. The hepatocarcinogenic and immunosuppressive properties of AFB1 consider AFB1 is the most dangerous of the group 48. Therefore the intake should be reduced to as low as reasonably achievable levels. For the same reasons the European Union regulation recommended not more than 2ppb AFB1 and not more than 4 ppb of total AFs in foods for human consumption 49, 50.
In the current study, by 40 ppm O3 the most harmful AFB1 could be completely detoxified in 35.7% (5/14) of luncheon and 6.7% (1/15) of kofta samples. AFB2 was completely detoxified in 14.3% (2/14) of luncheon and 21.4% (3/14) of kofta samples. AFG1 was completely eliminated in 100% (2/2) of luncheon and 16.6 % (2/12) of kofta. AFG2 was eliminated from 23.1% (3/13) of kfota samples but its residues continued in luncheon (tables 3 and 4). Ozone damages the furan ring’s hypertoxic site in AFs 45. As a result, their molecular structures alter, resulting in products with lower molecular weight, fewer double bonds, and lower toxicity 51. The mechanism of AFs detoxification by O3 varies with their structural differences 52. When O3 attacks furan ring double bond at C8–C9 of AFB1 and AFG1, results in the creation of primary ozonides. The first reaction of O3 happens at various locations of AFB2 and AFG2 molecules because of the absence of susceptible double bonds.
Regarding meat the pH is the main technical attributes that drive consumer purchasing decisions. For accepted quality meat products, pH should not exceed 6.0 53. The physical status of meat products after treatment with O3 expressed in pH values was illustrated in table 5. By the two applied concentration of O3, the pH values were none significantly (p > 0.05) affected. Some of treated samples appeared slight but not significant reduction in pH of compared with control. The same observation was also recorded by Stivarius et al. 54 and Lyu et al. 51 for vacuum packaged beef and Mercogliano et al 55 for poultry meat treated by O3. The mechanism that lower pH in some conditions of O3 treatment has not been clear established but it is reported that by its own O3 does not change pH 56.
Ozone is preferred to other detoxification due to its precursors being abundant, can be used in a gaseous or aqueous form, and does not produce residue on the product 57. Also does not need delivery (generated on-site) and without harmful disposal 58. The response of fat to O3 treatment in raw and ready-to-eat meat products was illustrated in table 6. At 20 ppm O3 fat was more stable compared to 40 ppm where the raw product (kofta) appeared higher stability compared to ready to eat (luncheon). In kofta samples treated with 20 ppm O3, TBA values were none significantly (p>0.05) affected and 83.3% (10/12) of samples agreed with ES 51 for TBA in meat products (not more than 0.9 mg MDA/Kg). At 40 ppm O3, the TBA values were significantly (p<0.05) raised but 58.3% (7/12) of treated samples still meeting the allowed limit of ES 51. Comparatively, 69.2% (9/13) and 23.1% (3/13) of treated luncheon met the ES 51 criteria for 20 and 40 ppm O3, respectively.
Previous studies reported that the pro-oxidant effect of O3 is possible but it is not selective. In other words, compared to other oxidizing agents, O3 does not work selectively oxidizing definite enzymatic systems but as a common oxidizing agent 59. Meanwhile, when in the presence of inorganic and/or organic substances, O3 reacts quickly to produce a wide range of oxidized molecules, which then vanish in a matter of seconds 60.
Cardenas et al. 61 and Muhlisin et al. 62 related the significant rise in TBA values in chicken and duck breast meat, respectively to the long exposure to O3. On the contrary, Lyu et al. 51 revealed lowering values of TBA after the combined pretreatment CO and O3 vacuum-packaged beef. Also, Pirani 63 revealed that O3 had no effect on the oxidation of fat in the treated sausage. The differences in effects of O3 on fat in experimental studies can be attributed to the different methodological approaches 43, exposure time, temperature and moisture content of food 64. Furthermore, the critical role played by environmental conditions, such as humidity and temperature on the efficacy of O3 has to be considered as it is known that little variations in these parameters can significantly modify its activity 65.
Conclusion
From achieved data, it could be concluded that the application of O3 has given promising results for the serious problem of AFs residue in meat products. Ozone appeared able to eliminate or significantly reduce AFs in raw and ready-to-eat meat products with negligible changes in physicochemical properties (pH). However, much care is required as preserving chemical quality is very dependent on O3 concentration. Since every O3 application is unique, in vitro toxicological studies should be conducted to screen the effects of degradation products if any on humans before starting large-scale applications.
Funding Sources
The authors received no financial support for the research, authorship, and/or publication of this article.
Conflict of Interest
The authors declare no conflict of interest.
References
- Alcaide-Molina, M., Ruiz-Jimenez, J., Mata-Granados, J.,& Luque de Castro, M. High through-put aflatoxin determination in plant material by automated solid phase extraction on-line coupled to laser-induced fluorescence screening & determination by liquid chromatography triple quadruple mass spectrometry. Journal of Chromatography. 2009; 7: 1115–1125.[https.//www.sciencedirect.com/science/article/pii/S0021967308022310]
CrossRef - Morshdy, A.M., Hussien, M.A., El-Abbasy, M.T. & Elzwahery, R.R. Aflatoxins residues in some meat products. 2nd Conference of Food Safety, Suez Canal University, Faculty of Veterinary Medicine. 2015; I: 90-95.[http://www.curresweb.com/mejas/mejas/2018/390-404.pdf]
- Stoev, S.D. Foodborne mycotoxicoses, risk assessment & underestimated hazard of masked AFs& joint mycotoxin effects or interaction. Environmental Toxicology & Pharmacology. 2015; 39: 794–809.[https.//doi.org/10.1016/j.etap.2015.01.022]
CrossRef - Bennett, J. W. & Klich, M. AFs. Clin Microbiol Rev. 2003; 16;497– 516.[doi:1128/CMR.16.3.497-516.2003]
CrossRef - Negash, D. A review of aflatoxin.occurrence, prevention, & gaps in both food & feed safety. J Appl Microbiol Res. 2018; 1. 35-43. [ DOI:15406/jnhfe.2018.08.00268]
CrossRef - Francis, F.B., Bruce, R.C., Catherine, W.D., Paul H., Ailsa, D.H. , Thomas, J.M. & Tompkin, R.B. Safety of Meat & Processed Meat. Fidel Toldra´, CSIC, Instituto de Agroqu ´micayTecnolog ´a de Alimentos (IATA) 46100 Burjassot Valencia Spain. Springer Science Business Media, LLC. 2009. [https.//link.springer.com/content/pdf/10.1007/978-0-387-89026-5.pdf]
- Algahtani, F.D., Morshdy, A.E., Hussein, M.A., Abouelkheir, E.S., Adeboye, A.., Valentine, A. & Elabbasy, M.A. Biogenic Amines & Aflatoxins in Some Imported Meat Products. Incidence, Occurrence, & Public Health Impacts.Journal of Food Quality. 2020 [https.//doi.org/10.1155/2020/8718179]
CrossRef - Karmi, M. Detection of Aflatoxins & Ochratoxin A Residues in Meat Products with Amelioration by Probiotics. Zag Vet J. 2019; 47: 213-[221.DOI. 10.21608/zvjz.2019.11633.1035]
CrossRef - Younos, M.A., Abdοu, D.A.M., KaramEl-Deen,A., Elmehalawy, A.A., Abd El Galil, M.A., Embaby E.M.,& Mohammed, S.R. Aflatoxigenic Fungi Occurrence in Some Processed Meat Products & their Control by Some Plant Extracts in vitro. Egypt. J. Microbiol. 2018; 53:111 – 125 [https.//dx.doi.org/10.21608/ejm.2018.4771.1067]
CrossRef - EFSA “European Food Safety Authority” .Aflatoxins (sum of B1, B2, G1, G2) in cereals & cereal-derived food products.European Food Safety AuthorityTechnical Report. Parma, Italy.2013 [http.//www.efsa.europa.eu/en/supporting/doc/406e. pdf on 9/2/2015.]
- Tibola, C. S., Fernandes, J. M. C., Guarienti, E. M. & Nicolau, M. Distribution of FusariumAFs in wheat milling process. Food Control. 2015; 53: 91–95. [https.//doi.org/10.1016/j.foodcont.2015.01.012]
CrossRef - Afsah-Hejri L., Jinap S., Arzandeh S. & Mirhosseini H. Optimization of HPLC conditions for quantitative analysis of aflatoxins in contaminated peanut. Food Control. 2011; 22:381–388. https.//doi.org/10.1016/j.foodcont.2010.09.007.
CrossRef - Refai, M.K., Niazi, Z.M., Aziz, N.H.. & Khafaga, N.E.M. Incidence of aflatoxin B1 in the Egyptian cured meat basterma& control by c-irradiation. Nahrung/Food. 2003; 47:377–382. [https.//doi.org/10.1002/food.200390085]
CrossRef - Hassan, F.F. (2017). Detection of Aflatoxin B1 in Some Canned Foods & Reduction of Toxin by Ultraviolet Radiation.Iraqi Journal of Science. 2017; 58: 2343-2349 [DOI. 10.24996/ ijs.2017.58.4C.10]
CrossRef - Agriopoulou, S., Stamatelopoulou, E. & Varzakas, T. Advances in occurrence, importance, & mycotoxin control strategies. Prevention & detoxification in foods. Foods. 2020; 9:137. [doi.10.3390/foods9020137]
CrossRef - He, J., Zhou T., Young, J. C., Boland, G. J.,& Scott,, P.M. Chemical & biological transformations for detoxification of trichotheceneAFs in human & animal food chains.Areview.Trends in Food Science & Technology. 2010; 21:67–76. [https.//doi.org/10.1016/j.tifs.2009.08.002]
CrossRef - Diao, E., Hou, H., Chen, B., Shan, C., & Dong, H. Ozonolysis efficiency& safety evaluation of aflatoxin B1 in peanuts. Food& ChemicalToxicology. 2013; 55:519–525. [https.//doi.org/10.1016/j.fct.2013.01.038]
CrossRef - Isikber, A.A., & Athanassiou, C.G. The use of ozone gas for the control of insects & microorganisms in stored products. Journal of Stored Products Research. 2015; 64:139–145.[https.//doi.org/ 10.1016/j.jspr.2014.06.006]
CrossRef - WHO “World Health Organization”. Food safety & foodborne illness fact. 2007; sheet No. 237. July 5. [//www.who.int/news-room/fact-sheets/detail/food-safety]
- FDA”Food& Drug Administration” .Direct food substances affirmed as generally recognized as safe.2008. [https.//ci.nii.ac.jp/naid/10010618604/]
- Cui, X. , Muhammad, I., Li, , Jin, H., Guo, Z., Yang,Y.,Hamid,S.1, Li, J., Cheng, P. & Zhang, X. Development of a UPLC-FLD Method for Detection of Aflatoxin B1 and M1in Animal Tissue to Study the Effect of Curcumin on Mycotoxin Clearance Rates. Frontiers in Pharmacology.2017; 8: Article 650.[doi: 10.3389/fphar.2017.00650]
CrossRef - Cui, X., Muhammad, I., Li, R., Jin, H., Guo, Z., Yang, Y., Hamid, S., Li, J., Cheng, P. and Zhang, X., 2017. Development of a UPLC-FLD method for detection of aflatoxin B1 and M1 in animal tissue to study the effect of curcumin on mycotoxin clearance rates. Frontiers in pharmacology, 8, p.650.
CrossRef - AOAC ”American Official AnalyticalChemistry”. Official Methods of Analysis, 16th Edn. Arlington, VA: AOAC International.1995 [https://www.worldcat.org/title/official-methods-of-analysis-of-aoac-international/oclc/421897987 ]
- R-Biopharm Rhône. Application of Immunoaffinity Columns for Sample Clean-up Prior to HPLC Analysis for Aflatoxins.Instruction for Use. Darmstadt.2001. [https://docplayer.net/89863444-Immunoaffinity-column-product-overview.html]
- Chasanah, U., Yulianto, E., Zain, A. z., Sasmita, E., Restiwijaya, M.., Kinandana, A.W., Arianto, F., & Nur, M. Ozone Concentration produced by Dielectric Barrier Discharge Plasma (DBDP) Technology. 9th International Conference on Physics and Its Applications (ICOPIA). IOP Conf. Series: Journal of Physics: Conf. Series. 2019; 1153: [ doi:10.1088/1742-6596/1153/1/012086]
CrossRef - Bialka, K.L. and Demirci, A., 2007. Decontamination of Escherichia coli O157: H7 and Salmonella enterica on blueberries using ozone and pulsed UV‐light. Journal of Food Science, 72(9), pp.M391-M396.
CrossRef - Elbazidy, M.A., Emara, M.M.T. ,& Nouman, T.M. Quality of Traditional Egyptian Luncheon(Emulsion Type Sausage). International Journal of Chem.Tech. Research. 2017; 10:315-320. [http.//www.sphinxsai.com/2017/ch_vol10_no5/1/(315-320)V10N5CT.pdf]
- DU, M., & Ahn, D.U. Effect of antioxidants on the quality of irradiated sausages prepared with turkey thigh meat. Poultry science. 2002; 81:1251-1256. [https.//doi.org/10.1093/ps/81.8.1251]
CrossRef - Mycotoxin control in low- and middle income countries (pp. 31e42).Lyon, France: International Agency for Research on Cancer (WHO). Report No. 9. 2015. [https://gastronomiaycia.republica.com/wp content/uploads/2016/03/informe_micotoxinas.pdf]
- Agriopoulou, S., Koliadima, A., Karaiskakis, G. & Kapolos, J. Kinetic study of aflatoxins’ degradation in the presence of ozone. Food Control. 2016; 61: 221-226. [http.//dx.doi.org/10.1016/j.foodcont.2015.09.013]
CrossRef - Shaltout, F.A., Amin, R.A., Nassif, Z. & Abd-Elwahab, S.A. Detection ofaflatoxins in some meat products. Benha Vet Med J. 2014; 27: 368-374. [http.//www.bu.edu.eg/portal/uploads/Veterinary%20Medicine/Food%20control/1025/
publications/Fahim%20Aziz%20El-Dein%20Mohamed%20Shaltout_36.pdf] - Soliman, M.M.H., Ata, N.S., El-Shafei, H.M. & Kandil, M.M.A. Prevalence of toxigenic Aspergillusflavusin meat & meat products.Bioscience Research. 2019; 16:822-829 Available online at www.isisn
- Kaynarca, H.D., Heceri,C., and Usluoy,B. Mycotoxin Hazard in Meat and Meat Products. Atatürk ÜniversitesiVet.Bil.Derg. 2019; 14(1)90-97. [DOI: 10.17094/ataunivbd.449705]
CrossRef - FAO & IFIF. Good practices of the feed industry implementing the Codex Alimentarius Code of Practice in Good Animal Feeding. FAO Animal production & Health Manual. 2010; No. 9s. 79, Rome.[https://ifif.org/our-work/project/ifif-fao-feed-manual/]
- Ismail, S.A., Shehata, A.A., & El-diasty, E.M. Microbiological Quality of Some Meat Products in Local Markets with Special Reference to AFs. Global Veterinaria. 2013; 10: 577-584. [DOI. 10.5829/idosi.gv.2013.10.5.7378]
- Elsayed, M.E., Algammal, A.M. El-Diasty, E.M. Abouelmaatti, R.R., & Abbas, S.M. Prevalence of Aspergillusspp&Aflatoxins in luncheon, minced meat & sausage. Global Animal Science Journal-GASJ. 2018; 6:17-23 [DOI. 10.5281/zenodo.1476984]
- Chulze, S.N. Strategies to reduce mycotoxin levels in maize during storage. A review.Food Additives & Contaminants.2010; 27: 651-657. [//doi.org/10.1080/19440040903573032]
CrossRef - Hasanin, F.S., Shaltout, F.A., Salem, R.M., Diasty, E.M. &Anees, K.P. H. Mycological profile of frozen meat with especial references to aflatoxin B1 & ochratoxin A residues in frozen meat .Journal of Global Biosciences. 2019; 8: 6424-6438. [www.mutagens.co.in]
- El-Ghreeb, W.R, Darwish, W.S., Tharwat, A.E., EL-Desoky, K.I. ,& Hussein, M.A. Aflatoxin & Ochratoxin A residues in some meat additives. Life Science Journal. 2013; 10:3411-3416. [http.//www.lifesciencesite.com]
- Maliakani, S., Rezanezhad, R , Jalali, M., and Ghobadi, F. The effect of ozone gas on destruction and detoxification of aflatoxin. Bulletin de la Société Royale des Sciences de Liège,. 86, special issue. 2017; p. 1 – 6[DOI: 10.25518/0037-9565.6511]
CrossRef - Proctor, A.D., Ahmedna, M., Kumar, J.V. & Goktepe, I. Degradation of aflatoxins in peanut kernels/flour by gaseous ozonation& mild heat treatment. Food Addit Contam Part A-Chem. 2004; 21: 786–793. [https.//doi.org/10.1080/02652030410001713898]
CrossRef - Trombete, F. M., Freitas-Silva, O., Saldanha, T., Venâncio, A. A. & Fraga, M. E. Ozone against aflatoxins& pesticide residues in food. Current applications & perspectives. International Food Research Journal. 2016; 23: 2545-2556 . [http.//www.ifrj.upm.edu.my]
- De Alencar, E. R., Faroni, L. R. D., Soares, N. F. F., Silva, W. A.,& .Carvalho, M.C.S. Efficacy of ozone as a fungicidal & detoxifying agent of aflatoxins in peanuts. Journal of the Science of Food & Agriculture. 2012; 92: 899–905. [https.//onlinelibrary.wiley.com/doi/abs/10.1002/jsfa.4668]
CrossRef - Savi, G. D., Piacentini, K. C., Bittencourt, K. O. & Scussel, V. M. Ozone treatment efficiency on Fusariumgraminearum & deoxynivalenol degradation & its effects on whole wheat grains (Triticumaestivum) quality & germination. Journal of Stored Products Research. 2014; 59.245–253.[https.//doi.org/10.1016/j.jspr.2014.03.008]
CrossRef - Luo, X., Wang, R., Wang, L., Li Y., Wang, Y.,& Chen, Z. Detoxification of aflatoxin in corn flour by ozone Journal of the Science of Food & Agriculture. 2014; 94: 2253-2258 [https.//doi.org/10.1002/jsfa.6550]
CrossRef - FAO: Worldwide regulation for mycotoxin in food and feed in 2003. Rome, 2004; FAO. Food and Nutrition P.81.[http://www.fao.org/3/y5499e/y5499e00.htm]
- Joint FAO/WHO Expert Committee on Food Additives- Technical Report series.Expert advice on appropriate criteria & limits for contaminants in Ready to Use Therapeutic Foods.pp.2016; 1- 34. [http.//www.who.int/bookorders]
- Magnussen, A. Aflatoxins, hepatocellular carcinoma & public health.World Journal of Gastroenterology. 2013; 19:1508. [doi. 10.3748/wjg.v19.i10.1508]
CrossRef - EU (2007):European Commission. Commission Regulation (EC) No 1126/2007 of 28 September amending regulation (EC) no 1881/2006 setting maximum levels for certain contaminants in foodstu_s as regards Fusarium toxins in maize and maize products.O_. J. Eur. Union L. 2007; 255, 14–17.[http://eur-lex.europa.eu/LexUriServ/LexUriServ.do?uri=OJ:L:2007:255:0014:0017:EN:PDF]
- EU: European Commission. Commission Regulation (EC) No 165/2010 of 26 February 2010 amending Regulation (EC) No 1881/2006 setting maximum levels for certain contaminants in foodstu_s as regards aflatoxins.O_.J.Eur. Union L. 2010, 50, 8–12. [https://eur lex.europa.eu/LexUriServ/LexUriServ.do?uri=OJ:L:2010:050:0008:0012:EN:PDF]
- Lyu, F., Shen, K., Ding, Y. & Ma, X. Effect of pretreatment with carbon monoxide &ozone on the quality of vacuum packaged beef meats. . 2016; 117:137–146. [https.//doi.org/10.1016/j.meatsci.2016.02.036]
CrossRef - Jalili, M., Jinap, S., & Noranizan, A. Aflatoxins and ochratoxin a reduction in black and white pepper by gamma radiation. Radiation Physics and Chemistry. 2012; 81(11), 1786e1788[ 10.1016/j.radphyschem.2012.06.001]
CrossRef - ES “Egyptian Standards”. Egyptian Standards for Requirements of Luncheon No: 1114.Egyptian Organization for Standardization and Quality Control. Ministry of Industry. Cairo, Arab Republic of Egypt. 2005. http://www.alcpo.org.ly/wp-conte nt/uploa ds/2017/06/newfoodsta ndards.pdf]
- Stivarius, M.R., Pohlman, F.W., McElyea, K.S. & Apple, J.K. The effects of acetic acid, gluconic acid &trisodium citrate treatment of beef trimmings on microbial, color & odor characteristics of ground beef through simulated retail display, Meat Science. 2002; 60: 245–52. [https.//doi.org/10.1016/S0309-1740(01)00130-9]
CrossRef - Mercogliano, R., De Felic, A., Murru, N., Santonicola, S. & Cortesi, M. L. Ozone Decontamination of Poultry Meat and Biogenic Amines as Quality Index. Food Process Technol. 2014; 5:3 [DOI: 10.4172/2157-7110.1000305]
CrossRef - Postma, The definite guide to understanding ozone. Available on. 2015. [http://energiaon.com/wpcontent/uploads/2015/09/Definitive_ozone_Guide.pdf]
- Pandiselvam, R., Subhashini, S., Banuu,Priya, E. P., Kothakota, A., Ramesh, S. V., &Shahir S. ozone based food preservation. A promising green technology for enhanced food safety. Science & Engineering. 2019; 4: 17–34. [https.//doi.org/10.1080/01919512.2018.1490636]
CrossRef - Torres, A. M., Palacios, S. A., Yerkovich, N., Palazzini, J.M., Battilani, P., Leslie, J. F. and Chulze, S. N. Fusarium head blight &AFs in wheat.Prevention& control strategies across the food chain.WorldMycotoxin Journal. 2019; 12: 333–355. [https.//doi.org/10.3920/WMJ2019.2438]
CrossRef - Brodowska, A.J., Nowak, A., & Śmigielski, K. Ozone in the food industry. Principles of O3 treatment, mechanisms of action, & applications.An overview. Critical reviews in food science & nutrition, 2018; 58:2176–2201.[doi:10.1080/10408398.2017.1308313]
CrossRef - Heng, S., Yeung, K.L., Djafer, M., &Schrotter J-C. A novel membrane reactor for ozone water treatment. Journal of Membrane Science. 2007; 289:67–75.[//doi.org/10.1016/j.memsci.2006.11.039]
CrossRef - Cardenas, F.C., res, S., Giannuz, L. & Zaritzky N. Antimicrobial action & effects on beef quality attributes of a gaseous O3 treatment at refrigeration temperatures. Food Control. 2011; 22: 1442-1447. [https.//doi.org/10.1016/j.foodcont.2011.03.006]
CrossRef - Muhlisin, L., Utama, D.T., Lee, J.H., Choi, J.H. & Lee, S.K. Effects of Gaseous Ozone Exposure on Bacterial Counts & Oxidative Properties in Chicken & Duck Breast Meat. Korean J. Food Sci. An. 2016; 36:405~411 [DOI http.//dx.doi.org/10.5851/kosfa.2016.36.3.405]
CrossRef - Pirani, S. Application of ozone in food industries.7 ,pp111.Doctoral Program in Animal Nutrition & Food Safety,Graduate school of veterinary sciences for animal health & food safety .UniversitadegliStudi di Milano.2010. [https.//air.unimi.it/bitstream/2434/153539/4/phd_unimi_R07489.pdf]
- Li, M. M., Guan, E. Q., and Bian, K. Effect of ozone treatment on deoxynivalenol and quality evaluation of ozonised wheat. Food Additives & Contaminants: Part A. 2014; 32(4): 544–553.[ DOI: 10.1080/19440049.2014.976596]
CrossRef - Gon calves, A.A. Ozone. An emerging technology for the seafood industry.Braz Arch, Biol. Techn. 2009; 52:1539–1572.[http.//dx.doi.org/10.1590/S1516-89132009000600025]
CrossRef

This work is licensed under a Creative Commons Attribution 4.0 International License.


