Physico-Chemical, Textural and Sensory Characteristics of Wheat Flour Biscuits Supplemented with Different Levels of Whey Protein Concentrate
 , , Md. Jahoor Alam3, Abdelmoniem Ibrahim Mustafa1
 1Department of Food Sciences, Faculty of Agriculture, University of Khartoum, Sudan.
2Department of Clinical Nutrition, College of Applied Medical Sciences, University of Hail, Hail KSA.
3Department of Biology, College of Science, University of Hail, Hail KSA.
Corresponding Author Email: amirashrafy2007@gmail.com
DOI : http://dx.doi.org/10.12944/CRNFSJ.7.3.15
Download this article as:
![]()
The objective of this study was to evaluate the nutritional, non-nutritional as well as physico-chemical characteristics of biscuits developed from the supplementation of wheat flour with different levels of whey protein concentrate (WPC). The biscuits were prepared by using composite blends of wheat flour (WF) and WPC in different combination such as 100:0 (WF), 95:5 (WWP 5%), 90:10 (WWP 10%) and 85:15 (WWP 15). Proximate analysis of control as well as treated sample showed significant rise in crude protein content, with increase in WPC supplementation. Moreover, Non-nutritional factor such as tannin content and polyphenols was found to be highest in WF sample followed by WWP (5%), WWP (10%) and WWP (15%). In addition to that, in-vitro protein digestibility (IVPD) was found to be highest in WPC and when IVPD was compared with the crude protein, a significant difference was observed. Additionally, with the increase in WPC ratio the concentration of lysine, aspartic acid and glutamic acid was improved. Moreover mineral analysis revealed that, WF had highest amount of iron 0.66 mg/100g followed by WWP (5%), WWP (10%), WWP (15%) and WPC. Moreover, spread ratio of cookies found to be significant with the increase in the levels of WPC. Sensory evaluation of the samples revealed that, WWP (15%) had highest acceptance rating followed by WWP (10%). Based upon our investigation, we found that WPC could be a good source of supplementation for the development of protein enriched biscuits to combat the problem of malnutrition.
KEYWORDS:Biscuits; Composite flour; Protein malnutrition; Quality characteristics; Whey protein concentrate
Introduction
Bakery products have become very popular worldwide because of their unique taste and easy availability at a reasonable cost. Biscuits are one of the most popular bakery products due to their ready to eat nature, easy handling for convenience, and possess long shelf life.1 In addition to that; most of the bakery products can be fortified and supplemented with low cost proteins, vitamins and minerals to meet specific needs of the population. 2 On the other hand, malnutrition as well as undernutrition is considered as the major health issues around the world more prominently in developing countries and the underlying causes are inadequate food intake in terms of both quality and quantity. 3 Sudan is one of the Sub-Saharan African countries suffering from a severe problem of food and nutrition insecurity from the last two decades.4 There were reports suggesting that, out of ten states, 15 % of the population of seven states is malnourished. Additionally, it is projected that over 360,000 children under the age of five are suffering from severe acute malnutrition. Across Sudan almost three million children are severely food insecure and more than 1.1 million children are acutely malnourished, whilst almost 280,000 are severely malnourished.5 Moreover, protein malnutrition has been reported as a serious problem in such countries because the diet mainly consists of cereals or starchy food. Cereal grains and beans usually contain low amount of lysine as well as typically low amounts of sulfur containing amino acids respectively i.e. methionine and cysteine.6 However, the prolonged consumption of such diet, mainly comprising of cereal grains, could lead to nutritional deficiencies, since cereals fail to supply adequate amounts of certain essential nutrients such as amino acids, vitamins and minerals in our balanced required diet.7 Hence, supplementation of wheat flour with whey protein concentrate (WPC) would be an excellent source for providing required amounts of proteins, particularly in baked foods like biscuits, cookies etc. Such biscuits are globally consumed due to their better nutritional characteristics and long shelf life.8 Wheat is one of the most important economical staple foods around the world providing about 341kcal/100g calories including protein and fat. In addition to that, wheat is considered as an ideal ingredient for commonly available bakery products, because of its unique rheological properties imparting positive effects on baking quality.9 Therefore, wheat is considered as the most popular energy grain due to presence of protein (gluten) which provides strength and elasticity required to produce biscuits, bread and cookies of desirable texture and flavor.10-11 Whey can be described as “the serum of watery portion that separates from the curd during conventional cheese making”. In addition to that, casein and whey proteins are the major proteins present in milk.12 Moreover, WPC is considered as rich source of quality proteins with numerous health benefits and can be available economically. It is rich in calcium, phosphorus, essential amino acids, and water-soluble vitamins. This makes whey protein concentrates a highly nutritious product.13 WPC has the ability to improve the nutritional value of food products such as cookies, breads, cake, crackers, pasta, confectionary products, infant food formulations, and special dietetic foods, due to its various functional properties.14 Hence, for improving the nutritional quality, mainly the protein content of biscuits, the supplementation of flour with WPC can be ideal.
Therefore, the aim of this study was to assess the physico-chemical, nutritional and non-nutritional, in-vitro digestibility properties of biscuits enriched with whey protein concentrate with the objective of improving essential amino acids as well as nutritional values, to combat the malnutrition in children’s.
Materials and Methods
Procurement of Sample
Sudanese wheat flour was obtained from a flour mill of North Khartoum (Sudan). Whey protein concentrate was brought from body building warehouse company (UK). Baking materials were obtained from local market of North Khartoum. All chemicals used were of analytical grade.
Preparation of composite flour blends
Composite flour was prepared by mixing wheat flour with 0, 5, 10, and 15 % whey protein concentrate. A blender was used to mix all the composite flour at an amount of 250g each. The composite flours were stored in an air tight container and kept in the freezer until required.
Processing of biscuits
Biscuits were prepared by using creamery method, as reported by previous study, with modification, for making dough samples.14 All the ingredients were weighed as follows: composite flour (100g), sugar powder (30g), shortening (30g), skim milk (2g), sodium chloride (1g), sodium bicarbonate (0.4g), ammonium bicarbonate (1.5g), glucose (2g), L-cysteine (0.02) and water (15mL). Four blends of wheat flour and wheat protein concentrates were prepared in the ratio of 100:0, 95:5, 90:10 and 85:15. Thereafter dough sheets were prepared of 4mm thickness and a round shape of biscuits were cut using 4.985 cm cutter. All the samples were baked in electric oven at 200 °C for 12 minutes. Thereafter, baked samples were cooled down and kept into plastic bag at room temperature for further investigation.14
Proximate analysis
Moisture, ash, fat and protein contents were determined according to AOAC (2000) methods. However carbohydrate and calorific values were determined by difference method.1, 15
Determination of tannins, phytic acid and polyphenols content
Anti-nutritional factors such as tannin, phytic acid and polyphenol contents were measured. Determination of tannins as well as phytic acid content was performed according to the method mentioned by Hawa et al., (2017).16 Total polyphenols were determined according to Purssion Blue Spectrophotometric method.17
Determination of in vitro protein digestibility
In vitro protein digestibility of control and treated samples was carried out according to the method mentioned by Kiin-Kabari et al., (2015).18
Minerals Analysis
The mineral contents (potassium, phosphorus, calcium, magnesium, potassium and iron) were determined according to method Ahamad et al., (2016) and Algamdi et al., (2018). Five grams of samples were incinerated into crucible at 550 0C for 4 hours and ash contents were cooled and transferred to a 250 mL beaker. Then, 12 mL of 5N HCL and 3 mL of conc. HNO3 were added. The beaker was placed over the heating plate to boil for 10 min. After this period, 100 mL of distilled water were added to boil for another 10 min and cooled down. Later on, the contents were filtered through whattman filter paper No.1, and the volume was diluted up to 250 mL with deionized water. The prepared samples were stored in glass vials for further analysis.19-20
Determination of amino acids
Amino acid analysis were carried out using Automatic Amino acid Analyzer (AAA 400) -INGOS Ltd; Czech Republic). Sample preparation and acid hydrolysis were performed according to the method presented by Block et al., (1958).21
Physical characteristics of biscuit samples
Biscuit diameter and thickness were determined. The spread ratio for the entire samples was calculated by using averages of 6 samples according to the following equation:
![]()
Sensory evaluation of biscuits
Fifteen panelists from the Food Research Center and Faculty of Agriculture, University of Khartoum carried the test as per standard procedure.
Statistical analysis
All the experiments were carried out in triplicate and represented as mean ± standard deviation (SD). The data were statistically analyzed using analysis of variance and least significant difference according to Statistical Analysis System (SAS, 2002).
Results and Discussion
Proximate composition
Proximate analysis of wheat flour (WF), whey protein concentrates (WPC) and wheat/whey protein concentrate (WWP) are presented in Table 1. All the results determined were expressed on dry matter basis per 100 g of material. The moisture content of WF and WPC were found to be 11.65 % and 4.75 % respectively. These results were found to be in the agreement of Bashir et al., (2015) and Parate et al., (2011).1,13 Moreover, moisture content of treated samples was found to be 11.30, 11.58 and 10.80 % for WWP (5 %), WWP (10%) and WWP (15 %), respectively. Our results showed no significant differences (P≤0.05) among the treated samples. The ash contents of the WF and WPC were 0.36% and 2.85% respectively. Results showed highly significant differences in their ash content. Moreover, the ash content of the treated samples, WWP (5 %), WWP (10 %) and WWP (15 %) was found to be 0.58, 0.71 and 0.84 % respectively. Our results are in agreement with Munaza et al., (2012).14 On the other hand, total protein concentrations in WF and WPC were found to be 12.46 % and 75.96 % respectively. Among the treated samples, WWP 15 % was found to contain the highest amount of protein followed by WWP (10 %) and WWP (5 %). The analysis of variance showed highly significant differences (P ≤ 0.05) among the samples. It was found that there was linear increase in protein content in the wheat/whey protein flour with the increasing in levels of whey protein concentrate from 5 to 15 %. Our results are in accordance with BIS specification for protein enriched biscuits.22 Total fat content determined for the WF and WPC samples were found to be 1.79 % and 4.997 (5,00 %)% respectively. Abd Al Rahman et al., (2005) and Parate et al., (2011), reported that the total fat content in wheat flour was 1.67 %, similar to the ones obtained in our study. WPC results were also in accordance to our results.13, 23 However, non significant differences in the fat content of wheat/whey protein flour (5 % and10 %) were observed with the increase in level of whey protein. Only wheat whey (15 %) flour showed significant differences in fat content. The results obtained are different from those reported by Munaza et al., (2012) who showed that the fat content of the wheat/whey protein flour biscuits decreased slightly with increase of WPC.14 Moreover, the results of total carbohydrates content were found to be 73.73, 11.44, 69.42, 65.67 and 62.42 % for WF, WPC, WWP (5 %), WWP (10 %) and WWP (15 %), respectively. There was highly significant difference (P ≤ 0.05) observed among the samples. The value for wheat flour was in good agreement with the values reported by Hassan (2005)24, who showed that the carbohydrates contents of wheat flour of three Sudanese wheat cultivars, Sasaraib, El-Nielain and Debaira, (72 % extraction rate) were 72.06, 74.64 and 71.70 %, respectively, and lower than the results reported by Abdel-Kader (2000)25. Calorific values of control (WF) as well as treated sample were calculated and found to be 360.93, 394.57, 361.75, 360.38 and 363.91 kCal, for WF, WPC, WWP (5%), WWP (10%) and WWP (15%), respectively. The analysis of variance showed that there was highly significant difference among the WF and WPC, whereas non significant (P≤0.05) differences were found among the WF and WWP flour blends.
Table 1: Proximate analysis and calorific value of wheat and wheat/whey protein concentrate blend flour.
| Sample | Moisture content (%) | Ash content (%) | Crude protein % (DMB) | Fat % (DMB) | Total carbohydrates (%) | Caloric value (kCal) |
| WF | 11.65a±0.44 | 0.36e±0.07 | 12.46e±0.35 | 1.793c±0.10 | 73.73a±0.80 | 360.93bc±1.50 |
| WPC | 4.75b±0.18 | 2.85a±0.02 | 75.96a±0.62 | 5.00a±0.05 | 11.44e±0.57 | 394.57a±0.80 |
| WWP (5%) | 11.30a±0.58 | 0.58d±0.09 | 16.84d±0.34 | 1.857c±0.01 | 69.42b±0.95 | 361.75bc±2.44 |
| WWP (10%) | 11.58a±0.23 | 0.713c±0.03 | 20.12c±0.16 | 1.913c±0.05 | 65.67c±0.40 | 360.38c±0.63 |
| WWP (15%) | 10.80a±0.69 | 0.84b±0.06 | 23.84b±0.17 | 2.093b±0.12 | 62.42d±0.97 | 363.91b±2.42 |
Mean ±SD value(s) bearing different superscript(s) in a column are significantly different (P≤0.05).
WF: Wheat flour
WPC: Whey protein concentrate
WWP (5%): Wheat flour 95% + whey protein concentrate 5%
WWP (10%): Wheat flour 90% + whey protein concentrate 10%
WWP (15%): Wheat flour 85% + whey protein concentrate 15%
The anti-nutritional factors
Anti-nutritional factors can be defined as any biological compound present in food which decreases the utilization of food nutrient or food intake, leading to impaired gastrointestinal and metabolic performance. 26 Several anti-nutritional factors have been found in wheat flour and whey protein concentrate mixture, such as phytic acids, tannins and polyphenols, which can exert a negative effect on the performance of newly developed food products. Therefore such anti-nutritional factors were measured. Results are presented in table 2.
Table 2: Anti-nutritional factors of wheat flour, whey protein concentrate and wheat /whey protein concentrate blend flour (mg/100g)
| Sample | Phytic acid mg/100g | Tannins mg/100g | Polyphenols mg/100g |
| WF | 544.91a ±44.73 | 0.068a ±0.06 | 223.91a ±29.29 |
| WPC | ND | ND | ND |
| WWP (5%) | 508.01a ±16.53 | 0.057a ±0.04 | 221.38a ±35.80 |
| WWP (10%) | 515.51a ±36.67 | 0.044a ±0.04 | 209.86a ±31.50 |
| WWP (15%) | 512.92a ±38.95 | 0.0360a ±0.02 | 200.49a ±11.44 |
Mean±SD value(s) bearing different superscript(s) in a column are significantly different (P≤0.05). ND = Not Detected
The phytic acid contents of WF, WPC, WWP (5 %), WWP (10 %) and WWP (15 %) were found to be 544.91, 0.00, 508.01, 515.92, and 512.92mg/100g, respectively. The statistical analysis showed non significant difference (P ≥ 0.05) among the tested samples. The phytic acid content of WF was higher, followed by WWP (15 %), WWP (10 %) and WWP (5 %). Coulibaly, et al., 2011 reported that recommended daily intake (RDI) of phytic acid for each country can vary. It has been observed that, the average intake of phytate in American and British diet varies from 631 to 746 mg/day27. Furthermore average intake can vary depending over the physiological need of individuals such as children, pregnant woman etc. On the other hand, phytic acid has been reported to cause chelation of mineral cofactors leading to lowering of digestive enzymes activity. Moreover, Tannin content of WF, WPC, WWP (5 %), WWP (10 %) and WWP (15 %) were found to be non significantly different (P ≥ 0.05). WF had higher tannin content (0.0627 mg/100g), followed by WWP 5 % (0.0572 mg /100g), WWP 10 % 0.0440 and WWP 15 % 0.0360 mg/100g, while tannin was not detectable in WPC. The tannin content of WF was lower than that reported by Ali (2006), who found that, tannin content of spelt and common wheat’s were 200 mg/100g. The result obtained was higher than that reported by Al jack (2009)28, 29. Additionally it’s been reported that, tannin can lower protein digestibility as it has water soluble polyphenols and forms complexes with proteins.30 On the other hand, polyphenols content of WF, WPC, WWP (5 %), WWP (10 %) and WWP (15 %) were found to be 223.91, 0.00, 221.38, 209.86 and 200.49 mg/100g, respectively. The results obtained for WF was higher than that mentioned by Al jack (2009), who showed that the polyphenols contents of wheat flour was found to be 21.07 mg/100g.
In vitro protein digestibility
The results of in vitro protein digestibility (IVPD) are depicted in Table -3. Highly significant differences (P ≤ 0.05) were observed among samples. Ayo et al., (2007) reported higher amounts of IVPD than our determined results. Moreover, incorporation of different concentration of WPC increased IVPD especially in WWP (5 %) and WWP (10 %), but slightly decreased with 15% fortification of WWP.31
Table 3: Effect of whey protein concentrate on invitro Protein digestibility (%) of wheat/whey protein concentrate blend flour.
| Sample | Protein (DMB) % | In vitro protein digestibility % |
| WF | 12.46e ±0.35 | 74.99e ±0.01 |
| WPC | 75.96a ±0.62 | 80.33a ±0.05 |
| WWF (5%) | 16.84d ±0.34 | 76.59b ±0.04 |
| WWF (10%) | 20.12c ±0.16 | 76.08c ±0.06 |
| WWF (15%) | 23.84b ±0.17 | 75.86d ±0.04 |
Mineral Analysis
The minerals content of WF, WPC, WWP5 %, WWP10 % and WWP15 % are shown in Table 4. Calcium (Ca), magnesium (Mg), sodium (Na), potassium (K), phosphorus (P) content in WPC were found to be highest 37.37, 19.08, 18.50, 430.00 and 259 mg/100g respectively, followed by WWP (15 %), WWP (10 %), WWP (5 %) and WF. The statistical analysis showed a significant difference (P ≤ 0.05). Moreover, Ca and Mg content of WF were found to be lower than the results reported by Tang et al., (2008)32 and Araujo et al., (2008)33, on the other hand Ca content was found to be higher than the value reported by Al jack (2009)29 i.e. 4.86 mg/100g for wheat flour biscuit. It was found that there was an increase in Ca and Mg contents in the wheat/whey protein flour with the increasing levels of whey protein concentrate from 5 % to 15 %. Sodium contents in WF was lower than 3.44 mg/100g as reported by previous study Ali et al., (2006)28, and higher than those results reported by Taha et al., (2000)34 for Condor cultivars. K content for WF was within the range showed by Araujo et al., (2008)33, but it was higher than that reported by Taha (2000)34. Moreover, the amount of P in WF was lower than the range reported by Tang et al., (2008)32 and higher than that observed by Taha (2000)34. On the other hand, Fe content in WF, WPC, WWP 5%, WWP 10% and WWP 15% was found to be 0.657, 0.340, 0.608, 0.490 and 0.377 mg/100g respectively. The iron content decreased with increased level of whey protein concentrate in the wheat /whey flour (5 % to 15 %), due to the low amount of iron in WPC. There were highly significant differences among the composite flour samples.
Table 4: Effect of whey protein concentrate on minerals (mg/100g) content of wheat/whey protein concentrate blend flour.
| Sample | Ca | Mg | Na | K | P | Fe |
| WF | 5.28e±0.03 | 10.25d±0.25 | 1.45e±0.00 | 306.67c±11.55 | 22.00c±2.00 | 0.660a±0.01 |
| WPC | 37.37a±0.34 | 19.08a±0.29 | 18.50a±0.25 | 430.00a±10.00 | 259.00a±1.00 | 0.340e±0.02 |
| WWP (5%) | 7.433d±0.28 | 12.50c±0.43 | 3.00d±0.05 | 316.67c±15.28 | 239.67b±8.14 | 0.608b±0.01 |
| WWP (10%) | 9.68c±0.06 | 14.92b±0.72 | 3.63c±0.03 | 330.00c±10.00 | 245.00b±1.00 | 0.490c±0.01 |
| WWP (15%) | 17.70b±0.10 | 18.67a±0.52 | 5.18b±0.03 | 353.33b±15.28 | 246.33b±0.58 | 0.377d±0.01 |
Mean ± SD value(s) bearing different superscript(s) in a column are significantly different (P≤0.05).
Amino acids profile
The amino acid composition of the different composite flours is presented in Table 5. This revealed that, WPC had the highest level of all amino acids and considered to be as high quality protein that contains all the amino acids needed for human. Moreover, lysine is an essential amino acid contained in milk proteins as well as in cereal proteins in low amount. On the other hand, supplementation of WPC gave advantage over conventional wheat flour biscuits as it improved the lysine content of the entire treated sample. Lysine content of the WF (control) was found to be 3.47g/100g of protein. However, WPC had the highest amount of lysine i.e. 10.07 g/100g. WWP (5%), (10%) and (15%) had 4.24, 3.49 and 3.98g/100g of lysine, respectively. Incorporation of various levels of WPC increases lysine content especially on WWP 5 %, but slight increase in WWP10 % and WWP15 %. The value for lysine in WPC was lower than that reported by Boumba, et al., (2001) for WPC 65 %. Histidine was found to be 0.449, 3.72, 0.81, 1.06 and 1.61g/100g protein for WF, WPC, WWP5 %, WWP10 % and WWP15 %, respectively35. It was found that there was increase in amino acids content in the wheat/whey protein flour blend with the increasing levels of whey protein concentrate addition.
Table 5: The Amino acids content of wheat flour, whey protein concentrates (WPC) and wheat/whey protein concentrate blend flour in (g/100g protein)
| Amino acids | WF | WPC | WWF (5%) | WWF (10%) | WWF (15%) |
| Theronine | 0.27±0.01e | 1.75±0.02a | 0.42±0.05d | 0.50±0.01c | 0.98±0.04b |
| Valine | 0.22±0.06e | 2.59±0.26a | 0.43±0.15d | 0.62±0.11c | 0.95±0.23b |
| Methionine | 0.17±0.09e | 1.28±0.17a | 0.24±0.21d | 0.39±0.19c | 0.54±0.27b |
| Isoleucine | 0.12±0.16e | 1.52±0.13a | 0.31±0.22d | 0.41±0.17c | 0.78±0.23b |
| Leucine | 0.70±0.06e | 4.09±0.11a | 0.87±0.18d | 1.02±0.21c | 1.61±0.13b |
| Phenylalanine | 0.87±0.27e | 6.76±0.20a | 1.51±0.16d | 1.77±0.19c | 2.04±0.06b |
| Histidine | 0.45±0.02e | 3.72±0.15a | 0.81±0.28d | 1.06±0.20c | 1.61±0.14b |
| Lysine | 3.47±0.07d | 10.07±0.19a | 4.24±0.27b | 3.49±0.15e | 3.98±0.24c |
| Seronine | 0.45±0.09e | 2.27±0.03a | 0.45±0.12d | 0.60±0.09c | 0.93±0.11b |
| Glutamic | 3.43±0.03d | 10.06±0.05a | 4.71±0.11e | 6.96±0.04c | 7.83±0.02b |
| Proline | 0.87±0.15c | 6.41±0.19a | 1.92±0.07b | 0.65±0.15d | 0.38±0.09e |
| Glycine | 0.73±0.09e | 7.63±0.12a | 1.81±0.20d | 2.26±0.28b | 2.11±0.16c |
| Alanine | 0.52±0.15e | 7.64±0.11a | 1.47±0.09d | 2.53±0.14c | 3.14±0.19b |
| Tyrosine | 0.18±0.15e | 1.35±0.19a | 0.24±0.23d | 0.36±0.17c | 0.53±0.28b |
| Aspartic acid | 1.71±0.02e | 10.15±0.14a | 2.44±0.09d | 2.60±0.06c | 4.70±0.04b |
Mean ± SD values bearing same superscripts within a row are not significantly different (P≤0.05).
Physical characteristics of wheat biscuits supplemented with whey protein concentrate
Physical characteristics of developed biscuits were measured by evaluating diameter, thickness and spread ratio of the biscuits. These results are presented in Table 6.
Biscuit thickness and diameter
The biscuits made from the blends of WF and WPC are shown in figure 2 having a diameter of 6.53 cm, 6.60, 6.56 and 6.56 cm for WF (A), WWP 5% (B), WWP 10% (C) and WWP 15% (D) respectively. It was observed that, an increase in diameter appears on addition of WPC to WF. Moreover, thickness of biscuits was found to be 0.944, 0.900, 0.800 and 0.768 (cm) for WF (A), WWP 5% (B), WWP1 0% (C) and WWP1 5% (D), respectively. Analysis of variance for the samples showed nonsignificant difference (P ≥0.05). The spread ratio of biscuits prepared from WF, WWP 5%, WWP 10% and WWP 15% blends was found to be 6.94, 7.36, 8.19 and 8.55 cm respectively. Our results showed a significant increase (P≤0.05) with increasing the levels of whey protein concentrates, but no significant differences (P≤0.05) were observed between the biscuits made with WF (A) control and level of 5 % of WPC in terms of spread ratio. The analysis of variance showed high significant difference (P ≤ 0.05) between control and other WWP samples (10% and 15%).
Table 6: Effect of whey protein concentrate on physical characteristics of biscuits.
| Sample | Thickness (cm) | Diameter (cm) | Spread ratio |
| WF | 0.944a±0.09 | 6.53a±0.14 | 6.94b±0.56 |
| WWP (5%) | 0.900a±0.07 | 6.60a±0.12 | 7.36b±0.48 |
| WWP (10%) | 0.800b±0.00 | 6.56a±0.05 | 8.19a±0.08 |
| WWP (15%) | 0.768b±0.03 | 6.56a±0.13 | 8.55a±0.49 |
Mean±SD value(s) bearing different superscript(s) in a column are significantly different (P≤0.05).
Sensory evaluation of biscuits
The sensory characteristics of biscuits produced are presented in table 7. Biscuits were evaluated for color, aroma, texture, taste, and overall acceptability. The color preference scores were found to be in the range of 4.20-7.40. The highest value was recorded for WWP 15% (D) which was 7.40 but WWP 10% (C) and WWP 5% (B) gave 6.60, 5.50 respectively, while the lowest value was given to WF (A) (4.20). Increasing levels of WPC resulted in increased score of color. No significant (P≥0.05) differences between WF (A) and WWP 5% (B) and also between WWP5 % (B) and WWP 10 % (C) were observed. Our results showed a significant difference between WF (A) and WWP 10% (C) and high significant difference between WF (A) and WWP 15 % (D). The significant difference among the samples could be due Mailliard reaction between reducing sugars and proteins.
Table 7: Sensory evaluation of biscuit prepared from biscuit wheat flour containing different levels of whey protein concentrate.
| Sample | Color | Aroma | Taste | Texture | Mouth feel | Overall acceptance |
| Scores | ||||||
| A | 4.20c±2.66 | 4.70c±1.70 | 5.10b±2.38 | 5.00c±1.05 | 5.20b±2.10 | 5.10b±1.85 |
| B | 5.50bc±1.43 | 6.00bc±0.94 | 6.20ab±1.40 | 5.90bc±1.85 | 6.20ab±1.32 | 6.00ab±1.15 |
| C | 6.60ab±2.07 | 7.10ab±1.37 | 6.70ab±1.64 | 7.20ab±1.69 | 7.30a±1.64 | 7.00a±1.63 |
| D | 7.40a±1.07 | 7.80a±1.62 | 7.70a±1.49 | 7.50a±1.58 | 6.80a±1.55 | 7.50a±1.65 |
Mean±SD value(s) bearing different superscript(s) in a column are significantly different (P≤0.05).
The aroma preference ranged between 4.70 and 7.80. Appearance score for WF (A) was 4.70 which increased upon increasing the amount of whey protein concentrate on blending WWP 5% (B), WWP 10% (C) and WWP 15% (D) and was found to be 6.00, 7.10 and 7.80 respectively. The results showed non-significant (P≥0.05) difference between WF (A) and WWP 5% (B) and also between WWP 5% (B) and WWP 10% (C) as well as between WWP 10% (C) and WWP 15% (D). WF (A) showed high significant (P≤0.05) difference with WWP 10% (C) and WWP 15% (D). The texture preference scores varied from 5.00 to 7.50. The highest value was given by WWP 15% (D) (7.50), while WWP 10% (C), WWP 5% (B) and WF (A), obtained (7.20, 5.90 and 5.00 respectively). No significant (P≥0.05) differences were observed between WF (A) and WWP5 % (B) and also between WWP 5% (B) and WWP 10% (C), whereas high significant (P≤0.05) difference between WF (A) and both WWP 10% (C) and WWP15%( D).
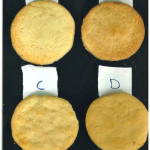 |
Figure 1: Biscuits made from wheat flour and different ratios of whey protein concentrate 5, 10 and 15%. Click here to View figure |
The taste scores of the biscuits were found to be in the range of 5.10 to 7.70. The WF (A) control obtained the lowest value followed by WWP 5% (B) with no significant (P≤0.05) difference, whereas the WWP 15% (D) obtained the highest scores in all levels. Mouth feels score varied from 5.20 to 7.30 and highest value was given to WWP 10% ( C) biscuits (7.30) followed by WWP 15% (D) (6.80), and WWP 5% (B) (6.20), while WF (A) Control, had the least score of mouth feel (5.20). Concerning the overall acceptance the WF (A) control showed the lowest score (5.10) while WWP 5% (B), WWP 10% (C) and WWP 15%(D), obtained scores of 6.00, 7.00 and 7.50, respectively. It was found that there was an increase in overall acceptance score in the biscuits with increased levels of whey protein concentrate, with high significant (P≤0.05) differences between WF (A), WWP 10% (B) and WWP 15% (C).
Conclusions
Biscuits are considered as a better composite food than the other bakery products because of its ready to eat nature, widespread consumption by different sections of the population and comparatively longer shelf-life. In addition to that, these features would be attractive for such countries where protein energy malnutrition is prevalent, and also in areas needing child feeding programs as well as for low income and disaster relief operations. Based upon our results, we conclude that protein, fat, and minerals of the experimental wheat/whey flours increased with increasing the level of whey protein concentrate (WPC) addition. Addition of WPC to wheat flour decreased moisture, carbohydrate and iron content. Incorporation of WPC in wheat flour has improved the amino acid profile of the produced biscuits. Sensory evaluation scores of biscuits containing WPC showed significant increase in all the parameters compared with control biscuits. It can be concluded that WPC can be used for supplementing bakery products to combat the problem of malnutrition. The best level for supplementation is 10 % i.e. meeting the protein requirements of children of age 4-8 years of age. However, further studies are needed to fortify wheat/whey protein concentrate with iron and folic acid.
Limitation
The newly developed food product had few limitations such as due to the time frame of the project; we were not able to exploit further fortification of wheat flour with other vitamins or minerals as well as some easily available cereal grains which contain high protein. Further study can be carried out by using different cereal grains which are cheap, easily available and having a potential nutritional source.
Acknowledgements
We are grateful to the Department of Food Sciences, Faculty of Agriculture, University of Khartoum, Sudan and Department of Clinical Nutrition, College of Applied Medical Sciences, Hail University, Hail for the encouragement and providing facilities to carrying out the present study.
Funding
The author(s) received no financial support for the research, authorship, and/or publication of this article.
Conflicts of Interest
We declare that, there are no potential conflicts of interest with respect to the research, authorship and publication of this article.
References
- Bashir A., Ashraf S.A., Khan M. A., Azad, Z.R.A.A. Development and compositional analysis of protein enriched soybean-pea-wheat flour blended cookies. Asian J Clin Nutr. 2015; 7: 76-83.
- Indrani D. Prabhasankar, P. Rajiv, J. Venkateswara R. G. Influences of whey protein concentrate on the rheological characteristics of dough, microstructure and quality of unleavened flat bread (parotta). Food Res Int. 2007; 40: 1254-1260.
- Thongram S., Tanwar B., Chauhan A., Kumar, V. Physicochemical and organoleptic properties of cookies incorporated with legume flours. Cogent Food & Agric. 2016; 2: 1172389. doi.org/10.1080/23311932.2016.1172389.
- Abdalla S., Leonhauser I. Dietary food consumption patterns in Sudan. BRJASR 2012; 2(9):180-185.
- O’Driscoll D. Drivers of Malnutrition in South Sudan. Knowledge, evidence and learning for development. UK Department for International Development and other Government departments. 2018; 1-14.
- Akbar Z., Shehzad A., Zahoor T., Khan M. R., Shabbir M. A., Rakha A., Jahangir M. A., Shuja M. Z. Effect of Soy Flour supplementation on quality of cookies. Int J Emerging Technol Adv Eng. 2016; 6(2): 175-177.
- Yousaf A.A., Ahmed A., Ahmad A., Hameed T., Randhawa M. A., Hayat I., Khalid N. Nutritional and functional evaluation of wheat flour cookies supplemented with gram flour. Int J Food Sci Nutr. 2012; 64(1):63-8. doi: 10.3109/09637486.2012.694851.
- Amir B., Mueen-ud-din G., Abrar M., Mahmood S., Nadeem M., Mehmood A. Chemical composition, rheological properties and cookies making ability of composite flours from maize, sorghum and wheat. J Agroaliment Proc Technol. 2015; 21(1): 28-35.
- Ndife J., Kida F., Fagbemi S. Production and quality assessment of enriched cookies from whole wheat and full fat soya. Eur J Food Sci Technol. 2014;. 2(1): 19- 28.
- Asefa B. The physicochemical and sensory characteristics of cookies baked from wheat flour and mango pulp. Food Science and Quality Management. 2017; 65. 16-21.
- Wani S.H., Gull A., Allaie F., Safapuri, T.A. Effects of incorporation of whey protein concentrates on physicochemical, texture, and microbial evaluation of developed cookies. Cogent Food & Agric. 2015; 1: 1092406. doi.org/10.1080/23311932.2015.1092406.
- Seelam B.S., David J., Kumari, A. Effect of sweet potato flour and whey protein concentrate on dough for preparation of cookies. The Pharma Innovation Journal. 2017; 6(5): 99-102.
- Parate V.R., Kawadkar D. K., Sonawane, Shriram S. Study of whey protein concentrate fortification in cookies variety biscuits. Int J Food Eng. 2011; 7(2):1-12.
- Munaza B., Prasad S. G. M. Gayas B. Whey protein concentrate enriched biscuits. Int J Sci Res Pub. 2012; 2(8):431-476.
- AOAC International. Association of Official Analytical Chemists, Official Methods of Analysis, Washington, DC. USA., 2000. ISBN-13: 978-093558467-7.
- Hawa A., Satheesh N. Kumela, D. Nutritional and anti-nutritional evaluation of cookies prepared from okara, red teff and wheat flours. Int Food Res J. 2018; 25(5): 2042-2050.
- Price M. L., Butler L.G. Rapid visual estimation and spectrophotometer determination of tannin content of sorghum grain. J Agric Food Chem. 1977; 25:1268-1273.
- Kiin-Kabari D. B., Giami S.Y. Physico chemical properties and in-vitro protein digestibility of non-wheat cookies prepared from plantain flour and Bambara groundnut protein concentrate. J Food Res. 2015; 4(2): 78-86.
- Ahamad S. R., Al-Ghadeer, A. R., Ali, R., Qamar, W., Aljarboa, S. Analysis of inorganic and organic constituents of myrrh resin by GC–MS and ICP-MS: An emphasis on medicinal assets. Saudi Pharm J. 2016; 25: 788-794.
- Alghamdi A.A., Awadelkarem, A. M., Hossain A.B.M. S., Ibrahim N.A., Fawzi M., Ashraf S.A. Nutritional assessment of different date fruits (Phoenix dactylifera L.) varieties cultivated in Hail province, Saudi Arabia. Biosc Biotech Res Comm. 2018; 11(2): 263-269.
- Block R. J., Durrum E. L., Zweig G. Annual of paper chromatography and paper electrophoresis 2nd ed., Academic press, New York. 1958; P 75-80.
- Indian Standards (IS: 7487 – 1986) Specification for protein enriched biscuits
- Abd Alrahman R. E. Evaluation of wheat flours for bread, biscuits and cake making. M. Sc. Thesis, University of Khartoum. 2005.
- Hassan E. G. Effect of bran particle size on wheat flour dough and bread quality. M. Sc. Thesis, University of Khartoum. 2005.
- Abdel-Kader Z. M. Enrichment of Egyptian ‘Balady’ bread. Part 1. Baking studies, physical and sensory evaluation of enrichment with decorticated cracked broad beans flour (Vicia faba L). Nahrung/ Food. 2000; 44 (6): 418-421.
- Dunlop R. H. Pathophysiology of plant toxicants. In: Dunlop, R.H. and Malbert, C.M. (edds) Veterinary pathophysiology. Oxoford: Blackwell. 2004.
- Coulibaly A., Kouakou B., Chen J. Phytic Acid in Cereal Grains: structure, healthy or harmful ways to reduce phytic acid in cereal grains and their effects on nutritional quality. Am J Plant Nutr Fert Technol. 2011;1 (1): 1-22.
- Ali M. F. 2006. Physio-chemical properties of water melon seeds flour and its use in biscuits making. M.Sc. thesis, Faculty of Agric., University of Khartoum, Sudan.
- Al jack, A. M. Physicochemical characteristics of wheat flour supplemented with pearl millet (Pennisetum glaucum L.) and lupin (Lupinus termis) flours and biscuit quality. M. Sc. Thesis, University of Khartoum. 2009.
- Barbana C., Boye J. I. In vitro protein digestibility and physico-chemical properties of flours and protein concentrates from two varieties of lentil (Lens culinaris). Food Fun. 2013. 4, 310.
- Ayo J. A., Ayo V.A., Nkama I., Adewori R. Physiochemical, in-vitro digestibility and organoleptic evaluation of “Acha” wheat biscuit supplemented with soybean flour. Niger Food J. 2007; 25(1): 77-89.
- Tang J., Zou Ch, He Z., Shi R., Ortiz- Monastrio I., Qu Y., Zhang Y. Mineral element distribution in milling fractions of Chinese wheat’s. J Cereal Sci. 2008; 48:821-828.
- Araujo R. G. O., Macedo S. M., Korn M. G. A., Fernandantel M., Roy E. B., Ferriea S. C. Mineral composition of wheat flour consumed in Brazilian cities. J Braz Chem Soc. 2008; 19(5): 935-942.
- Taha A. O. M. The role of sorghum flour starches (amylose/ amylopectin) in composite bread quality. M.Sc. thesis, Faculty of Agric., University of Khartoum, Sudan. 2000.
- Boumba V. A., Voutsinas L. P., Philippoulos C. D. Composition and nutritional value of commercial dried whey products from feta cheese manufacture. Int J Dairy Technol. 2001; 54(4):141-145.
Accepted on: 10/12/2019
Second Review by: Dr. Erik Albert Karlsson Cambodia
Final Approval by: Prof. Jiwan S. Sidhu


Web of Science Coverage
Emerging Sources Citation Index (ESCI)
2024 Journal Impact Factor: 1.1
Scopus Journal Metrics
CiteScore 2025: 2.6
CiteScore Details
Sustainable Nutrition: Food Systems, Nutrient Retention, and Public Health Impact
![]()
This journal is a member of, and subscribes to the principles of, the Committee on Publication Ethics (COPE)


