Modified Atmospheric Packaging (MAP) of Trichosanthes Dioica (Parwal) Sweet and Effect of Storage Temperature on the Physicochemical, Microbial and Sensory Characteristics
 , Rama Chandra Pradhan4
 1Centre of Food Science and Technology, Institute of Agricultural Sciences, Banaras Hindu University, Varanasi, India.
2Animal Husbandry and Dairying, Institute of Agricultural Sciences, Banaras Hindu University, Varanasi, India.
3Division of Food Science and Post-Harvest Technology, ICAR – Indian Agricultural Research Institute, New Delhi, India.
4Department of Food Process Engineering, National Institute of Technology, Rourkela Rourkela, Odisha, India.
Corresponding Author Email: bhushanmishra909@gmail.com
DOI : http://dx.doi.org/10.12944/CRNFSJ.7.3.11
Download this article as:
![]()
Trichosanthes dioica (Parwal) sweet was packed under air and modified atmospheric packaging (MAP) with a gas composition of 98% N2 (2% O2 impurity), and 70% N2 : 30% CO2, respectively. The samples were stored at 5, 10 and 25oC and evaluated for various microbial count, nutritional analysis (moisture, fat and protein), titratable acidity (TA), total carotenoids, vitamin C, DPPH inhibition activity, total phenolic content, hydroxymethylfurfuraldehyde (HMF), thiobarbituric acid (TBA), free fatty acid (FFA), Textural profile analysis and sensory attributes. Results showed that a combination of 70 %N2+30% CO2 had most significant effect to arrest the microbial growth followed by 100% N2 and fresh. Similarly this combination of N2 and CO2 retained the proximate and textural quality of the products concluded that the MAP conditions of 70% N2: 30% CO2 and storage at 5°C, were the most suitable conditions for preserving the Parwal sweet up to 50 day.
KEYWORDS:Trichosanthes Dioica (Parwal) Sweet; Modified Atmospheric Packaging (MAP); Microbial Count; Antioxidant; Physicochemical; Sensory Properties
Introduction
From time immemorial ethnic food such as traditional sweets has played a significant role in our society and religion. Parwal or pointed gourd (Trichosanthes dioica) sweet is a type of indigenous dairy product prepared by filling of khoa in previously boiled parwal in sugar syrup.1-3 Parwal is a member of cucurbitaceae family and perennial, herbaceous and dioecious in nature.4 The edible part of the fruit is an influent source of the carotenoid (vitamin A) ascorbic acid (vitamin C), minerals and possesses cardiotonic and anthelmintic properties.5-7
Customarily, production of khoa is very high and accounts 5.5% of total milk production as it is the base material for number of relish milk sweets i.e. peda, barfi and kalakand, parwal sweet etc.1,8,9 The shelf life of this kind of products is limited due to various constraints (i.e. temperature, moisture content, packaging material and storage conditions, etc.) which affects physical, biochemical and microbiological qualities.10 In general, the shelf life of commercial traditional products ranges from few days (at 25°C) to few weeks (at 4°C) and restricts the large-scale manufacturing and marketing.10,11 Biochemical changes i.e., hydroxymethylfurfuraldehyde (HMF), free fatty acid (FFA), thiobarbituric acid (TBA), proximate composition, microbial counts and physical properties alteration in some traditional sweets during storage period were studied at 4 and 37 °C.1,8,12 Other study has shown an increase in the storage life of traditional sweets by influencing in their water activity and sugar content etc.13-15
Recent trends in food science industries implied that the enrichment of nutrition value of the final product under consideration.16-21 Modified atmospheric packaging (MAP) is a technique commercially uses in minimal processing of fruits and vegetables by replacing the internal gases composition of the packaging material with a desirable amount of the gases. Most common gases use in MAP of traditional sweets are oxygen, nitrogen and carbon dioxide.22-24 Oxygen in MAP causes several types of deterioration that include fat oxidation, pigment oxidation, browning reaction, aerobic microbial growth and strictly prohibit the anaerobic microbial spoilage. Therefore, to increase the shelf life, MAP should contain a low concentration of oxygen.25,26 Nitrogen is relatively safe as compared to oxygen concentration which leads to displacing the oxygen in packs resulting delays in fat oxidation and growth of aerobic microorganisms.27,28 Antimicrobial activity of carbon dioxide retards the growth of aerobic microorganisms during their growth phase.29,30 Several research studies reported the effect of different processing techniques and conditions on the physicochemical characteristics of final product.31-35 Ghayal et al.,12 reported that the influence of gas compositions on the storage stability of MAP sweet was found to be more stable for the sample packed under 100 % N2 than the sample packed under 50% CO2:50% N2 followed by atmospheric gas composition. However, for lal peda packed under the gas composition of 70 % N2: 30 % CO2 was better to retain the shelf life with respect to sample packed 98 % N2 followed by air atmosphere.8 Another study reported that the effect of MAP on the shelf life of kalakand was up to 60 days in the gas composition of 50% N2 and 50% CO2 at 10 °C however 98 % N2 and 98 % CO2 was least significant at all storage temperature (5, 10 and 37°C).36 However, no scientific evidence is available on the modified atmosphere packaging (MAP) and storage stability of laboratory prepared Parwal sweet.
The purpose of the present study was to explore the influence of various gas compositions on the storage stability of the Parwal sweets stored at different temperature. In this paper, published researches on modified atmosphere packaging specifically on traditional ethnic sweets are critically reviewed and opportunities for future research are explored.
Materials and Methods
Materials
In the present study milk (Fat = 6% and SNF = 9%) was procured from the Department of Dairying and Animal Husbandry farm’s, Banaras Hindu University, Varanasi, India. Citric Acid (C6H8O7.H2O) (Mol. Wt.-210.14) from Fisher Scientific, India. However, sugar and fresh parwal were acquired from the local market of Varanasi, India.
Method
Preparation of Parwal sweet
The khoa was prepared using the procedure given by Aneja et al.,37 however; the Parwal sweet was prepared by the method given by Viswas et al.,1 and additionally, some almond slices were put to improve appearance.
Packaging of Parwal sweet
The Parwal sweet (one in each pack) were packed in low-density polyethylene (LDPE) pouches (150 gauge thick with dimension 18×30 cm and oxygen transmission rate (OTR) 480 cc/0.001inch/100 inch2/24h/atm O2 and water transmission rate (WTR) 1.2 g/1002 inch/24 h at 90 % RH using modified atmospheric packaging (MAP) system (Reepack®, VAC-STAR, AG S 220 MP) from Switzerland coupled with gas mixer (MAP mix-9000, PBI DANSENSOR, Ringsted, Denmark). Two combinations of MAP gases used to pack the Parwal sweet samples were i.e. 98% N2 (with 2 % O2 impurity) and 70% N2 + 30% CO2, respectively. One another gas combination (air atmosphere) was used to pack the sample as to as control. Packed samples were investigated for their shelf life evaluation at different temperature viz., 5, 10 and 25°C at the interval of 10 days with respect to microbial, physicochemical, textural and sensory attributes.
Microbial count analysis
Microbial profiling of the laboratory prepared Parwal sweet were performed with respect to total plate count (TPC), yeast and mold count (YMC) and coliform counts. During microbial analysis plate count agar (PCA) was used for TPC, potato dextrose agar (PDA) for yeast & mold and violet red bile agar (VRBA) for coliform as a growth medium. 10-2 dilution of the serial dilution was speeded on solidified medium subsequently TPC and coliform were incubated at 37 °C and yeast and mold 25 °C for 24-48 h.8
Proximate composition of Parwal sweet
The proximate composition of the parwal sweet was evaluated following the method described by Patel et al.,21 However, determination of titratable acidity (TA) was performed titration method. All calculated data were presented on the percent wet basis (% w.b).38
Antioxidant properties
The total carotenoids estimation of Parwal sweet was performed using UV–1800 spectrophotometer (Shimadzu, Japan) at 452 nm and Vitamin-C (L-ascorbic acid) 2,6-Dichlorophenol-Indophenol (DCPIP) by titration method.39 Radical scavenging activity was measured with the help of stable free radical, 2,2-diphenyl-2-picryl 1 hydrazyl (DPPH).17 Total phenolic content was determined using the method as described by Pandey and Patel16 using Folin-Ciocalteau reagent and Gallic acid standard calibration curve (25, 50, 75, 100, 125 and 150 ppm).
Hydroxymethylfurfural (HMF) analysis
Dehydration or catalytic conversion of sugar into organic acid was determined in terms of HMF.40-,41 1.0 g sample was thoroughly mixed with 9.5 mL distilled water. Then, 10.0 mL of 3 N oxalic acid was added and the tubes were kept in boiling water bath for 60 min. The contents of the tubes were cooled and 10 mL of 40 % trichloroacetic acid solution was added and stayed for 10 minutes to precipitate. The precipitated was filtered through Whatman No. 42 filter paper. 1 mL of filtrate was taken into 10 mL test tube and 7 mL of distilled water added followed by 2 mL of 0.05 M trichloroacetic acid solution and mixed properly. The reaction mixture was placed into a water bath at 40 °C for 50 min subsequently absorbance was taken at 443 nm using UV–1800 spectrophotometer (Shimadzu, Japan) and the results were expressed as µmol/L. From the standard curve (5 to 50 µmol/100g), the HMF content in the samples was determined using the following regression Eq (A.1):
![]()
Thiobarbituric Acid (TBA) Analysis
The degree of fat oxidation was measured in terms of TBA relative substances value.8 2 g of sample was taken into 50 mL of 20% trichloroacetic acid and well blended followed by 50 mL of distilled water and stayed for 10 min for precipitation. The precipitate was filtered, and 5 mL of filtrate was taken into test tubes with 5 mL of 0.01 M 2-thiobarbituric acid. The test tubes were subjected at 95 °C water bath for 30 min to color development, cooled and absorbance was taken at 532 nm. Reference determination was made using the same additionally distilled water instead of sample.
Free Fatty Acid (FFA) Analysis
Determine the FFA content of the Parwal sweet was performed using the method prescribed by Deeth et al.,42 The method consisted of accurate weighing of 1.0 g of Parwal sweet sample into a 60 ml stoppered test tube. 20 ml of extraction mixture (Isopropanol: Petroleum ether: 4.0 N H2SO4 in the ratio of 40:10:1) was added and mixed thoroughly. This was followed by the addition of 12 ml petroleum ether and 8 ml distilled water. The test tube was stoppered and tempered at 40oC for 10 min. The contents were vigorously shaken for 20 s. The two-layer were allowed to separate for 10-15 min and an aliquot of the upper layer (5-8ml) was withdrawn and titrated against 0.02N methanolic KOH solution using 1% methanolic phenolphthalein indicator. A blank was run in the same manner as above using distilled water. The results were expressed as µeq of oleic acid/g.
The FFA content of Parwal sweet was obtained from the following Eq (A.2):
![]()
Where: T = ml of 0.02 N KOH used; N = normality of methanolic KOH solution; P = proportion of upper layer of aliquot titrated / total aliquot and W = weight of sample.
Analysis of texture of Parwal sweet
A texture profile analyzer (TA-XT2i, M/s Stable Micro Systems, UK) was used to analyze the texture profile of Parwal sweet following the method as described by Jha et al.,8 and Londhe et al.,10
Sensory Attributes
Sensory analysis of the samples was carried out using an untrained panel constituting of 15 respondents using a 9-points Hedonic scale.43 The responses with respect to the color & appearance, flavor, body & texture and overall acceptability (OAA) of the samples were collected from each of the respondents and the results were statistically analyzed.
Statistical Analysis
Each experiment was conducted in triplicate (n=3) and obtained data were analyzed using a statistical analysis software PROC RSREG of SAS (SAS 2008, USA). A consequent least significant difference (P < 0.05) test was applied for multiple sample assessment.
Results and Discussion
Microbial quality of Parwal sweet
Initially the population of TPC and YMC ware 3.27 and 3.08 log10 cfu/g, respectively. However, the coliform count was not detected (nil) throughout the study. In the samples stored under air as control, 98% N2, and 70% N2: 30% CO2 at 25°C microbial count (TPC and YMC) recorded as their critical limits (>5.0) within 10 days (Table 1). Hence, further microbial analysis of sample stored with air at 25°C was discontinued after 10 days however it was continuous till 20th days to evaluate the influence of MAP and air atmospheric condition on other quality parameters.
In the sample packed under air atmosphere, microbial counts were (TPC and YMC) reached their critical limits within 20 days (5.43 and 5.89 log10cfu/g) stored at 10°C and 30 days (5.67 and 4.89 log10cfu/g) stored at 5°C respectively. However, in the sample packed under 98% N2 displayed a gradual increase in the TPC and YMC and showed their critical limits at 30 and 40 days of storage (5.75 log10cfu/g at 10°C and 5.47 log10cfu/g at 5°C). Similarly, when stored under 70% N2: 30% CO2 gas composition, the TPC and YMC were detained significantly during 30 days of storage at 10°C and 50 days at 5°C respectively.
At the last day of storage, the TPC and YMC 4.91 and 4.85 log10cfu/g (at 10°C) were 4.64 and 405 log10cfu/g (at 5°C) respectively. In control sample (air atmosphere) the microbial activity was highest it may be due to the presence of sufficient oxygen under pack which accelerates the growth of aerobic microbes.25 However, sample with 98% N2 was found to better in retention of shelf life than packed under air. Because nitrogen is an inert gas which does not support the growth of microorganism.27,28 The gases combination of MAP viz., 70% N2: 30% CO2 displayed best retention in the shelf life of Parwal sweet sample, probably due to the antimicrobial/anaerobic the activity of CO2 under package.27,29 The results were agreed with results reported by Jha et al.,8 for storage stability of MAP lal peda.
Table 1: Microbial evaluation of Parwal sweet packaged under air and MAP stored at 5, 10 and 25°C.
| Storage period (days) | Atmosphere | Total plate count (log10 cfu/g) | Yeast and mold count (log10 cfu/g) | Coliform count (log10 cfu/g) | ||||||
| 5˚C | 10 ˚C | 25 ˚C | 5 ˚C | 10 ˚C | 25 ˚C | 5 ˚C | 10 ˚C | 25˚C | ||
| 0 | Fresh | 3.27 ± 0.07 | 3.27 ± 0.07 | 3.27 ± 0.07 | 3.08 ± 0.01 | 3.08 ± 0.01 | 3.08 ± 0.01 | NIL | NIL | NIL |
| 10 | Control | 4.03 ± 0.15a | 4.63 ± 0.01a,b | 6.53 ± 0.50c | 3.14 ± 0.04a | 4.73 ± 0.08b | 6.14 ± 0.07c | NIL | NIL | NIL |
| 100% N2 | 3.68 ± 0.03a | 3.92 ± 0.01b | 5.61 ± 0.27c | 3.11 ± 0.54a | 3.56 ± 0.01a | 5.59 ± 0.54c | NIL | NIL | NIL | |
| 70 %N2 + 30% CO2 | 3.31 ± 0.50a | 3.44 ± 0.01b | 5.26 ± 0.00c | 3.10 ± 0.54a | 3.20 ± 0.03a,b | 5.04 ± 0.00c | NIL | NIL | NIL | |
| 20 | Control | 4..83 ± 0.44a | 5.43 ± 0.03b | 3.69 ± 0.05a | 5.89 ± 0.04b | NIL | NIL | |||
| 100% N2 | 4.05 ± 0.08a | 4.46 ± 0.01b | 3.54 ± 0.00a | 5.17 ± 0.06b | NIL | NIL | ||||
| 70 %N2 + 30% CO2 | 3.39 ± 0.04a | 4.13 ± 0.01b | 3.09 ± 0.11a | 3.86 ± 0.01a,b | NIL | NIL | ||||
| 30 | Control | 5.67 ± 0.17a | 6.38 ± 0.08b | 4.89 ± 0.07a | 7.65 ± 0.08b | NIL | NIL | |||
| 100% N | 4.52 ± 0.07a | 5.75 ± 0.03b | 4.38 ± 0.01a | 5.31 ± 0.02b | NIL | NIL | ||||
| 70 %N2 + 30% CO2 | 3.51 ± 0.04a | 4.91 ± 0.02b | 3.14 ± 0.02a | 4.85 ± 0.01b | NIL | NIL | ||||
| 40 | Control | 6.22 ± 0.01 | 5.79 ± 0.04 | NIL | ||||||
| 100% N2 | 5.47 ± 0.27 | 5.04 ± 0.14 | NIL | |||||||
| 70 %N2 + 30% CO2 | 4.13 ± 0.14 | 3.52 ± 0.03 | NIL | |||||||
| 50 | Control | 7.40 ± 0.02 | 6.12 ± 0.00 | NIL | ||||||
| 100% N2 | 5.77 ± 0.21 | 5.30 ± 0.00 | NIL | |||||||
| 70 %N2 + 30% CO2 | 4.64 ± 0.00 | 4.05 ± 0.00 | NIL | |||||||
Note: Values presents in mean ± standard deviation of triplicate for each sample (n=3); values are significantly different at the level of p<0.05 for each storage period, storage temperature and packing conditions.
Proximate Composition
Initially, the nutritional composition of laboratory prepared fresh Parwal sweet was protein (15.40% w.b.) and fat (28.22% w.b.), and moisture (15.30% w.b.) respectively (Table 2). It was observed that there was a simultaneous and quick loss in moisture content (15.28%, fresh to 11.41%, 20 days) stored at 25°C respectively under air atmosphere and varied significantly (p<0.05) with another storage period, temperature and MAP conditions. Gas compositions of 70% N2: 30% CO2 displayed greater retention of moisture content (14.55%) after 50 days of storage at 5°C with respect to sample packed with 98% N2 (13.03%) and air atmosphere (11.24%) respectively. Jha et al.,8 and Ghayal et al.,12 reported similar observations in rabri and lal peda during storage period packed under MAP and air atmosphere samples, respectively.
Protein and fat compositions of Parwal sweet were significantly (p<0.05) influenced with different storage periods, storage temperatures and packing conditions. Gas composition of 70% N2: 30% CO2 at 5°C was found to most significant to prevent the degradation of nutritional compositions compared to sample packed under 98% N2 and air atmosphere, varied from 15.40% to 14.62% (protein) and 28.22% to 27.39% (fat) after 50 days of storage, however the sample store at 10°C displayed the greater rate deterioration than stored at 5°C ranged from 15.40% to 13.74 and 28.22% to 25.43%) respectively, after 30 days of storage (Table 2). Sample stored at 25°C displayed 24.22% (from 15.40 to 11.67%) reduction in total protein content and 26.82 % (from 28.22 to 20.65%) reduction in total fat content after 20 days of storage under same packaging condition, however, sample packed under 98% N2 and air atmosphere displayed 27.53% & 33.57% reduction in protein and 29.91% & 35.33% reduction in fat contents respectively. In sample stored at 5°C under 70% N2: 30% CO2 reduction was five times lower in protein content and nine times lower fat content with respect to sample stored at 25°C under the same. This reduction may be due to hydrolysis of protein into free amino acids44,45 and hydrolysis of fat by present microorganisms and enzymatic activities into free fatty acids.13
Titratable acidity of the Parwal sweets increased gradually due to increasing in the storage temperature and period under MAP and air atmosphere. The acidity in the khoa based Parwal sweet is expressed as lactic acid of khoa and ascorbic acid of parwal.7,10 Initial TA of Parwal sweet was found to be 0.20% respectively and increased slightly packed under 70% N2: 30% CO2 gas composition at 5ºC of storage temperature. However, the sample stored at 10 and 25ºC under same gas composition displayed significantly (p<0.05) increasing in TA varied from 0.20 to 0.43% (30th days) and 0.20 to 0.67% (20th days) respectively (Table 2). Parwal sweet packed in 70% N2: 30% CO2 was found to most valuable to retain the TA of the sample compared packed under 98% N2 followed by air atmosphere. So, storage of the Parwal sweet at relatively lower temperature i.e. 5ºC under 70% N2: 30% CO2 gas composition was efficient to maintain the TA at an acceptable limit even at the last days (50th) of storage.
Antioxidant Properties
Carotenoids and vitamin C are major antioxidants in parwal which possesses cardiotonic and anthelmintic properties5-7 in their respective products if utilized properly. Total carotenoids (µg/100g), vitamin C (mg/100g), DPPH inhibition activity (%) and total phenolic content (mg/g) in fresh laboratory prepared Parwal sweet was found to 82.59, 53.51, 67.15, 71.84 and 29.87 respectively (Table 3). These values were found to be diminished significantly (p<0.05) during progression in storage temperature and period. Samples stored at 25ºC displayed faster decrement in these values with respect to samples stored at 10ºC followed by 5ºC respectively. A significant effect of different packing conditions was also observed, displayed that sample packed under air atmosphere and 98% N2 resulted in a high rate of deterioration followed by packed under 70% N2: 30% CO2 respectively. In the sample packed under 70% N2: 30% CO2 and stored at 5ºC was found to be reduction of 10.87% of total carotenoids, 8.71% of vitamin C, 9.96% of DPPH inhibition activity and 11.01% of total phenolic content after 50 days of storage was much lower than the samples stored at 10 & 25ºC, were 17.31 & 46.92%, 24.05 & 38.98%, 23.05 & 32.42%, 14.48 & 19.99% and 15.73 & 26.88% respectively after 30 & 20 days of storage respectively. However, the effect of packing conditions (98% N2 & air atmosphere) on the reduction of these contents stored at 5ºC were 28.25 & 38.07%, 24.48 & 36.76%, 20.36 & 28.90%, 25.56 & 48.98% and 21.06 & 27.68% respectively, were much higher than the sample packed under 70% N2: 30% CO2. The results were agreement with the finding of other researchers46,47 reported the rapid decreasing in the antioxidant activity, carotenoids and phenolic content in two different pigment’s carrots stored under different gas composition. It may be due to higher concentration of inert nitrogen leads to displacing the oxygen in packs resulting delays degradation,28 however, carbon dioxide hinders the aerobic metabolism.35
Table 2: The nutritional composition of Parwal sweet packaged under air and MAP stored at 5, 10 and 25°C.
| Storage period (days) | Atmosphere | Moisture | Fat | Protein | Titratable acidity | ||||||||
| 5˚C | 10 ˚C | 25 ˚C | 5 ˚C | 10 ˚C | 25 ˚C | 5 ˚C | 10 ˚C | 25˚C | 5˚C | 10˚ C | 25 ˚C | ||
| 0 | Fresh | 15.30 ± 0.95 | 15.30 ± 0.95 | 15.30 ± 0.95 | 28.22 ± 0.00 | 28.22 ± 0.00 | 28.22 ± 0.00 | 15.40 ± 0.00 | 15.40 ± 0.00 | 15.40 ± 0.00 | 0.20 ± 0.00 | 0.20 ± 0.00 | 0.20 ± 0.00 |
| 10 | Control | 14.72 ± 0.37a | 13.23 ± 0.25b | 10.65 ± 0.28c | 26.89 ± 0.54a | 25.15 ± 0.54b | 20.65 ± 0.54c | 14.83 ± 0.27a | 14.58 ± 0.27 a,b | 12.65 ± 0.27c | 0.23 ± 0.04a | 0.24 ± 0.00a | 0.29 ± 0.00b |
| 100% N2 | 15.23 ± 0.44a | 13.98 ± 0.54b | 11.14 ± 0.42c | 27.54 ± 0.54a | 27.12 ± 0.54a | 22.72 ± 0.00b | 15.07 ± 0.27a | 14.76 ± 0.27a,b | 13.06 ± 0.00c | 0.22 ± 0.01a | 0.23 ± 0.02a | 0.27 ± 0.06b | |
| 70 %N2 + 30% CO2 | 15.30 ± 0.35a | 14.52 ± 0.41b | 11.56 ± 0.30c | 28.17 ± 0.00a | 28.02 ± 0.00a | 23.45 ± 0.00b | 15.38 ± 0.44a | 15.29 ± 0.44a | 13.13 ± 0.54b | 0.21 ± 0.01a | 0.23 ± 0.01a,b | 0.27 ± 0.00c | |
| 20 | Control | 14.44 ± 0.00a | 12.54 ± 0.34b | 10.41 ± 0.44c | 26.26 ± 0.54a | 24.26 ± 0.00b | 18.25 ± 0.00c | 14.05 ± 0.27a | 13.57 ± 0.00a,b | 10.23 ± 0.00c | 0.27 ± 0.00a | 0.42 ± 0.00b | 0.83 ± 0.14c |
| 100% N2 | 14.93 ± 0.27a | 13.28 ± 0.34b | 11.07 ± 0.27c | 27.12 ± 0.54a | 26.67 ± 0.00a,b | 19.78 ± 0.00c | 14.84 ± 0.27a | 14.32 ± 0.00a,b | 11.16 ± 0.00c | 0.24 ± 0.04a | 0.38 ± 0.02b | 0.72 ± 0.02c | |
| 70 %N2 + 30% CO2 | 15.25 ± 0.43a | 13.87 ± 0.65b | 11.34 ± 0.34c | 28.12 ± 0.54a | 27.54 ± 0.00a | 20.65 ± 0.00b | 15.29 ± 0.44a | 14.84 ± 0.00a,b | 11.67 ± 0.00c | 0.23 ± 0.01a | 0.24 ± 0.04a | 0.67 ± 0.01b | |
| 30 | Control | 13.76 ± 0.44a | 10.21 ± 0.54b | 25.85 ± 0.54a | 23.16 ± 0.04b | 13.51 ± 0.27a | 12.12 ± 0.23b | 0.34 ± 0.01a | 0.91 ± 0.06a | ||||
| 100% N2 | 14.72 ± 0.27a | 12.82 ± 0.37b | 27.04 ± 0.54a | 25.43 ± 0.03b | 14.42 ± 0.27a | 13.47 ± 0.22b | 0.30 ± 0.00a | 0.88 ± 0.04a | |||||
| 70 %N2 + 30% CO2 | 15.17 ± 0.45a | 13.27 ± 0.54b | 28.04 ± 0.54a | 26.86 ± 0.13b | 15.05 ± 0.44a | 14.33 ± 0.74a,b | 0.24 ± 0.03a | 0.43 ± 0.12b | |||||
| 40 | Control | 12.54 ± 0.44 | 23.67 ± 0.54 | 12.87 ± 0.27 | 0.52 ± 0.14 | ||||||||
| 100% N2 | 14.02 ± 0.27 | 26.45 ± 0.54 | 14.08 ± 0.27 | 0.44 ± 0.8 | |||||||||
| 70 %N2 + 30% CO2 | 14.87 ± 0.44 | 27.74 ± 0.54 | 14.88 ± 0.44 | 0.25 ± 0.02 | |||||||||
| 50 | Control | 11.24 ± 0.00 | 21.57 ± 0.00 | 11.56 ± 0.00 | 1.22 ± 0.54 | ||||||||
| 100% N2 | 13.03 ± 0.00 | 25.13 ± 0.00 | 13.42 ± 0.00 | 1.06 ± 0.28 | |||||||||
| 70 %N2 + 30% CO2 | 14.55 ± 0.00 | 27.39 ± 0.00 | 14.62 ± 0.00 | 0.31 ± 0.02 | |||||||||
Note: Values presents in mean ± standard deviation of triplicate for each sample (n=3); values are significantly different at the level of p<0.05 for each storage period, storage temperature and packing conditions.
Hydroxymethylfurfural (HMF)
HMF content (μmoles/100 g) of the MAP (98% N2, 70% N2:30% CO2) and air atmosphere packed Parwal sweets stored at different temperatures (5, 10 and 25°C) for different storage period were estimated as shown in Figure 1 (a-c). The HMF content for sample packed under air atmosphere varied with variation in temperature. The sample stored at 5°C showed a minimal and gradual increase in the HMF content followed by sample stored at 10°C; however, a sudden increasing in HMF content were observed in case of sample stored at 25°C and reached maximum the limits among all samples. The HMF content in sample increased gradually with increasing in storage period was also observed. It was observed the highest (33.5) in sample packed under air atmosphere stored at 25°C after 20 days, was much higher than the sample packed under 70% N2:30% CO2 gas composition and stored at minimum of storage temperature (5°C) after 50 days of storage content (28.6), which was lowest among all samples. In sample packed under 70% N2:30% CO2 was found to be detained the formation of HMF compared to samples packed under 98% N2 followed air atmosphere. Based on the above findings, it could be assured that the effect of storage temperature on the HMF content was most significant (p<0.05) than the others. Jha et al.,8 and Londhe et al.,10 reported that the combination of carbon dioxide and nitrogen showed better results in the prevention of HMF formation in the brown peda and the lal peda packed under air atmosphere and another MAP, respectively. Jain et al.,36 studied the shelf life of kalakand stored at different temperature (10, 25, and 37°C) and gas compositions, reported that the HMF content was increasing during storage as the storage temperature was increasing.
Table 3: Antioxidant properties of Parwal sweet packaged under air and MAP stored at 5, 10 and 25°C.
| Storage period (days) | Atmosphere | Total Carotenoid (μg/100g) | Vitamin C (mg/100g) | DPPH Inhibition activity (%) | Total Phenolic Content (mg/g) | ||||||||
| 5 ˚C | 10˚C | 25 ˚C | 5 ˚C | 10 ˚C | 25 ˚C | 5 ˚C | 10 ˚C | 25˚C | 5˚C | 10˚ C | 25 ˚C | ||
| 0 | Fresh | 82.54 ± 9.22 | 82.54 ± 9.22 | 82.52 ± 9.22 | 53.07 ± 1.87 | 53.07 ± 1.87 | 53.07 ± 1.87 | 67.15 ± 0.56 | 67.15 ± 0.76 | 67.15 ± 0.56 | 29.87 ± 0.13 | 29.87 ± 0.13 | 29.87 ± 0.13 |
| 10 | Control | 75.52 ± 0.82a | 72.11 ± 1.83a,b | 57.12 ± 0.87c | 48.23 ± 2.41a | 40.58 ± 0.22b | 36.15 ± 0.48c | 64.12 ± 2.54a | 58.54 ± 0.22a,b | 47.34 ± 0.93c | 26.45 ± 0.02a | 25.15 ± 0.22a,b | 21.64 ± 0.33c |
| 100% N2 | 77.02 ± 1.64a | 74.85 ± 5.07a,b | 57.20 ± 1.02c | 50.51 ± 0.54a | 48.155 ± 0.45b | 39.34 ± 1.52c | 65.84 ± 0.81a | 63.34 ± 0.30a,b | 51.31 ± 0.08c | 27.24 ± 0.80a | 26.78 ± 1.04a,b | 23.84 ± 0.57c | |
| 70 %N2 + 30% CO2 | 81.14 ± 0.81a | 80.12 ± 4.41a,b | 60.85 ± 0.13c | 53.21 ± 0.63a | 51.64 ± 0.86a,b | 42.27 ± 0.27c | 67.25 ± 0.73a | 65.78 ± 0.72a,b | 54.12 ± 1.82c | 28.17 ± 1.13a | 27.15 ± 0.92a,b | 25.68 ± 1.24c | |
| 20 | Control | 67.54 ± 1.13a | 62.07 ± 0.65b | 27.19 ± .1.57c | 48.25 ± 1.22a | 34.25 ± 0.13b | 25.81 ± 1.06c | 57.07 ± 0.16a | 50.74 ± 1.07b | 31.31 ± 1.52c | 25.55 ± 0.23a | 24.28 ± 1.16a,b | 18.11 ± 0.04c |
| 100% N2 | 70.26 ± 0.72a | 65.54 ± 1.62b | 38.25 ± 2.14c | 49.85 ± 0.74a | 42.84 ± 0.72b | 28.48 ± 0.55c | 58.51 ± 0.83a | 53.54 ± 0.21b | 40.87 ± 0.50c | 26.87 ± 0.77a | 24.08 ± 1.42b | 20.48 ± 3.55c | |
| 70 %N2 + 30% CO2 | 78.32 ± 0.42a | 71.21 ± 2.71b | 43.81 ± 0.92c | 52.85 ± 0.38a | 48.54 ± 1.04b | 32.65 ± 1.02c | 65.55 ± 0.43a | 61.37 ± 0.72a,b | 45.38 ± 2.42c | 28.58 ± 0.41a | 26.57 ± 0.12b | 21.84 ± 1.03c | |
| 30 | Control | 60.78 ± 2.37a | 51.98 ± 0.05b | 46.21 ± 0.53a | 28.87 ± 1.21b | 55.75 ± 0.82a | 35.91 ± 0.25b | 24.15 ± 2.24a | 20.18 ± 0.13b | ||||
| 100% N2 | 65.16 ± 1.53a | 55.85 ± 2.07b | 47.45 ± 0.80a | 35.16 ± 1.22b | 58.14 ± 2.17a | 42.18 ± 1.03b | 25.04 ± 0.82a | 22.24 ± 0.28b | |||||
| 70 %N2 + 30% CO2 | 77.02 ± 5.32a | 68.25 ± 0.81b | 50.78 ± 0.17a | 41.64 ± 0.12c | 63.88 ± 1.71a | 51.67 ± 1.48b | 27.00 ± 0.78a | 25.17 ± 0.11b | |||||
| 40 | Control | 54.20 ± 1.28 | 42.27 ± 2.68 | 50.01 ± 1.25 | 23.24 ± 1.88 | ||||||||
| 100% N2 | 62.49 ± 0.87 | 43.18 ± 0.81 | 55.96 ± 0.14 | 25.75 ± 0.17 | |||||||||
| 70 %N2 + 30% CO2 | 75.84 ± 2.14 | 49.78 ± 0.22 | 61.21 ± 0.83 | 27.02 ± 1.23 | |||||||||
| 50 | Control | 51.12 ± 1.83 | 33.84 ± 0.52 | 47.74 ± 1.22 | 21.87 ± 3.15 | ||||||||
| 100% N2 | 59.22 ± 0.58 | 40.41 ± 1.05 | 53.27 ± 0.51 | 23.58 ± 1.16 | |||||||||
| 70 %N2 + 30% CO2 | 73.57 ± 0.44 | 48.85 ± 1.24 | 60.46 ± 1.58 | 26.58 ± 2.18 | |||||||||
Note: Values presents in mean ± standard deviation of triplicate for each sample (n=3); values are significantly different at the level of p<0.05 for each storage period, storage temperature and packing conditions.
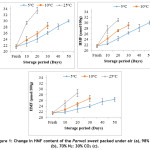 |
Figure 1: Change in HMF content of the Parwal sweet packed under air (a), 98% N2 (b), 70% N2: 30% CO2 (c). Click here to View figure |
Thiobarbituric Acid (TBA)
Parwal sweet is a milk-based product contained a high amount of milk fat (28.22%) makes it prone to oxidation degradation followed by rancidity. TBA values Parwal sweets packed under air and MAP atmosphere at 5, 10 and 25°C for different days of storage are shown in Figure 2 (a-c), depicted alteration in gas compositions, storage temperature and periods significantly (p<0.05) influenced the TBA value. It was observed that the rate of the increase of TBA value was more in sample packed under air atmosphere and 98% N2 with progression in storage temperature and period than the sample packed under 70% N2:30% CO2 gas composition. The trend for increasing of TBA value in the samples packed under different gas compositions was 70% N2:30% CO2 < 98% N2 < air respectively. Similar findings were reported in dietetic rabry and kalakand.12,36 Similarly, some researchers36,48 mentioned the increase in TBA value of different types of milk during storage period. They also reported relationship of TBA value and occurrence of off flavor in milk, which makes the product unacceptable.
Free Fatty Acid (FFA)
As stated earlier Parwal sweet is a dairy-based product containing a high amount of milk fat thus leads to greater possibility of degradation either hydrolytic or autoxidative liberate FFAs.27,28 The FFA value of the Parwal sweet samples packed under different gas compositions and stored at different temperature and storage periods are shown in Figure 3 (a-c) depicted the same trends as observed in TBA value. FFA value of sample stored at different temperature and storage periods observed increased significantly (p<0.05) with progression as well. Similar findings have been reported by several researchers in brown peda, dietetic rabry and khoa.9,10,14 General trend for increasing FFA value as recorded in samples packed under different gas compositions were 70% N2:30% CO2 < 98% N2 < air. FFA value in the sample packed under 70% N2:30% CO2 and stored at 5°C was found to be the lowest compared to samples packed under 98% N2 & air atmosphere and storage temperature of 10 and 25°C respectively.
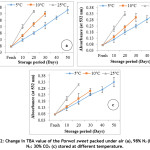 |
Figure 2: Change in TBA value of the Parwal sweet packed under air (a), 98% N2 (b), 70% N2: 30% CO2 (c) stored at different temperature. Click here to View figure |
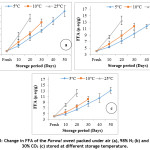 |
Figure 3: Change in FFA of the Parwal sweet packed under air (a), 98% N2 (b) and 70% N2: 30% CO2 (c) stored at different storage temperature. Click here to View figure |
Texture quality of Parwal sweet
The textural properties are the key factors, play a decisive role to determine primary acceptability of any kinds of product. Effect of different storage temperature, periods and gas compositions on the textural properties of Parwal sweet were given in Table 4, depicted that significant different (p<0.05) to each other. In the sample packaged under 98% N2 and air atmosphere displayed sudden rise in the hardness compared to sample packed under 70% N2:30% CO2 gas composition. Progression in storage temperatures and periods also displayed a gradual increase in hardness. Moisture content in the samples plays a key role in their hardness. It was found that sample stored at 5°C was found to be detained to increase the hardness of sample than sample stored at 10 and 25°C respectively. As observed that the sample stored at 5°C under 70% N2:30% CO2 displayed a gradual increase in hardness from 2650.5 (fresh) to 3742.05g, however sample packed under 98% N2 and air atmosphere displayed steep increasing 2650.5 to 4833.53g and 2650.5 to 5732.42g after 50th day. In the sample packed under MAP displayed lower rate of increasing in the hardness it may be due to its greater moisture retention capacity than air atmosphere. This result was in agreement with the findings of Jha et al.,8 and Jain et al.,36 who reported that the increase of total solid content in kalakand and lal peda resulted increasing the hardness.
The adhesiveness of a product is related to its sensory stickiness. Table 4 shows that the average adhesiveness of the Parwal sweet samples decreased significantly (p<0.05) with increasing the storage period and temperature. This is possibly due to the reduction in the moisture content of the sample during storage which causes less attractive forces between the surface of food and to which it contacts. Parwal sweet samples stored under MAP and air atmosphere also were found to significantly different (p<0.05) to each other. The adhesiveness of the samples stored at 5°C decreased from -120.32 (fresh) to -42.33 (air), -63.12 (98% N2) and -93.84 g.sec (70% N2:30% CO2) respectively after 50 days of storage (Table 4).
Cohesiveness is the ratio of the area under the second bite curve and before reversal compression to under the first bite of the products. It is the measure of the extent to which the Parwal sweet structure was disrupted during the first compression. It was observed that cohesiveness of sample packed under MAP and air atmosphere increased gradually with increasing the storage period and temperature (10 and 25°C). However, the cohesiveness of the sample packed under 70% N2:30% CO2 condition and stored at 5°C remained fairly constant throughout the storage. The cohesiveness of the samples packed under air, 98% N2 and 70% N2:30% CO2 and stored at 5°C was in the ranged of 0.20 (fresh) to 0.49, 0.38 and 0.25 respectively, after 50 days of storage. The result was agreement with the results reported by Jha et al.,8 and Londhe et al.,10 for lal peda and brown peda cohesiveness, was remain constant stored under MAP condition. Loss in moisture content may be responsible for increment in the cohesiveness with progression of storage and temperature. The finding was also in agreement with the result reported by Jha et al.,8 and Jain et al.,36 for cohesiveness of lal peda and kalakand increased with increasing the total solids.
Springiness refers to a sample’s ability to return to its original form after compression. It is the height that the sample recovers between the first and second compression. Springiness of Parwal sweet samples displayed that increased significantly (p<0.05) during progression in storage period, temperature and alteration in gas composition (Table 4). Springiness values of Parwal sweet during storage with air, 98% N2 and 70% N2:30% CO2 ranged between 0.27 (fresh) to 0.48, 0.47 and 0.43 respectively after 50th days of storage at 5°C. Observations were similar to the results reported by Jha et al.,8 and Jain et al.,36 for lal peda and kalakand stored under 98% N2, 98% CO2 & 50% N2: 50% CO2 and air, 98% N2 & 70% N2:30% CO2. The springiness values in Parwal sweet was higher than those reported in lal peda at 10°C after 30th days of storage8, but similar than those reported in kalakand by Jain et al.,36 Texture profile analysis (TPA) graph of samples packed under 70% N2:30% CO2 and stored at 5°C after (50th days) were showed in Figure 4 (a-c), depicted the textural changes (hardness, adhesiveness, springiness and their dependent cohesiveness).
Effect on MAP packed Parwal sweet sensory attributes
Sensory attributes of all samples were found to be decreased significantly (p<0.05) with increasing the storage period and temperatures (Table 5). Progression in the storage temperatures and periods displayed a decrement in the sensory attributes of samples. The sample stored at a higher temperature (25°C) were found to be unacceptable within 10 days of storage and sample stored at 10°C was 30 days, hence discarded from further sensory evaluation however sample stored at 5°C was acceptable after 50 days of storage under 70% N2:30% CO2 respectively. Parwal sweet sample packed under 70% N2: 30% CO2, was found to be the maximum sensory score among all the samples packed under different gas compositions. Nonetheless, the samples stored at 5°C packed under 70% N2: 30% CO2 showed the highest sensory characteristics of the samples.
Table 4: Textural changes in Parwal sweet packaged under air and MAP stored at 5, 10 and 25 °C.
| Storage period (days) | Atmosphere | Hardness (g) | Adhesiveness (g.sec) | Springiness | Cohesiveness | ||||||||
| 5˚C | 10˚C | 25˚C | 5˚C | 10˚C | 25˚C | 5˚C | 10˚C | 25˚C | 5˚C | 10˚ | 25˚C | ||
| 0 | Fresh | 2650.52 ± 65.11 | 2650.57 ± 65.11 | 2650.5 ± 65.11 | -120.32 ± 21.11 | -120.32 ± 21.11 | -120.32 ± 21.11 | 0.27 ± 0.003 | 0.27 ± 00.03 | 0.27 ± 00.03 | 0.20 ± 00.01 | 0.20 ± 00.03 | 0.20 ± 00.01 |
| 10 | Control | 3238.25 ± 106.15a | 3760.05 ± 106.10b | 3958.2 ± 111.11c | -109.88 ± 12.41a | -89.85 ± 14.12b,c | -65.11 ± 05.17c | 0.32 ± 0.002a | 0.31 ± 00.02a,b | 0.37 ± 00.05c | 0.28 ± 00.06a | 0.36 ± 00.05b | 0.41 ± 00.01c |
| 100% N2 | 3109.05 ± 64.07a | 3641.41 ± 89.95b | 3833.5 ± 112.00c | -115.04 ± 08.94a | -101.67 ± 17.71b,c | -77.13 ± 10.15c | 0.31 ± 0.004a | 0.33 ± 00.02b,c | 0.34 ± 00.04c | 0.24 ± 00.08a | 0.28 ± 00.01b | 0.58 ± 00.03c | |
| 70 %N2 + 30% CO2 | 2650.15 ± 65.11a | 2827.14 ± 08.75b | 3248.51 ± 25.43c | -118.72 ± 02.17a | -112.38 ± 11.67b,c | -84.18 ± 07.01c | 0.33 ± 0.001a | 0.37 ± 00.01b | 0.39 ± 00.02c | 0.22 ± 00.05a | 0.23 ± 00.08b | 0.43 ± 00.05c | |
| 20 | Control | 4116.18 ± 106.54a | 5258.28 ± 100.30b | 5651.4 ± 110.11c | -103.11 ± 20.45a | -72.36 ± 13.67b | -41.73 ± 11.23c | 0.37 ± 0.005a | 0.42 ± 00.04b | 0.48 ± 00.05c | 0.35 ± 00.02a | 0.48 ± 00.06b | 0.51 ± 00.01c |
| 100% N2 | 3979.52 ± 110.61a | 4543.45 ± 100.24b | 5444.20 ± 106.15c | -110.44 ± 14.21a | -87.84 ± 05.13b,c | -52.60 ± 01.80c | 0.35 ± 0.0045a | 0.41 ± 00.01b | 0.44 ± 00.02c | 0.271 ± 00.01a | 0.35 ± 00.03b | 0.49 ± 00.03c | |
| 70 %N2 + 30% CO2 | 2870.12 ± 85.61a | 3829.21 ± 113.68b | 5238.0 ± 67.10c | -115.75 ± 11.54a | -105.63 ± 02.18b,c | -57.30 ± 13.15c | 0.34 ± 0.003a | 0.39 ± 00.04b | 0.42 ± 00.03c | 0.23 ± 00.08a | 0.25 ± 00.07b | 0.47 ± 00.07c | |
| 30 | Control | 4552.84 ± 57.11a | 6454.43 ± 101.76b | -89.51 ± 03.11a | -51.55 ± 0.23b | 0.41 ± 0.002a | 0.51 ± 00.05b | 0.39 ± 00.05a | 0.53 ± 00.04b | ||||
| 100% N2 | 3762.67 ± 110.61a | 5246.56 ± 123.32b | -96.12 ± 07.94a | -66.62 ± 0.04b | 0.39 ± 0.003a | 0.48 ± 00.07b | 0.31 ± 00. 09a | 0.39 ± 00.03b | |||||
| 70 %N2 + 30% CO2 | 3126.24 ± 105.64a | 4546.1 ± 108.43b | -110.47 ± 02.11a | -87.72 ± 0.04b | 0.37 ± 0.001a | 0.44 ± 00.01b | 0.23 ± 00.07a | 0.34 ± 00.17b | |||||
| 40 | Control | 5679.51 ± 87.30 | -65.62 ± 05.78 | 0.44 ± 0.003 | 0.45 ± 00.06 | ||||||||
| 100% N2 | 5356.02 ± 110.11 | -86.56 ± 08.11 | 0.43 ± 0.002 | 0.34 ± 00.03 | |||||||||
| 70 %N2 + 30% CO2 | 3578.42 ± 106.39 | -97.85 ± 01.58 | 0.41 ± 0.010 | 0.24 ± 00.01 | |||||||||
| 50 | Control | 5732.42 ± 101.21 | -42.33 ± 01.06 | 0.48 ± 0.002 | 0.49 ± 00.06 | ||||||||
| 100% N2 | 4833.53 ± 23.57 | -63.12 ± 07.13 | 0.46 ± 0.002 | 0.38 ± 00.05 | |||||||||
| 70 %N2 + 30% CO2 | 3742.05 ± 15.62 | -93.84 ± 01.048 | 0.43 ± 0.009 | 0.25 ± 00.01 | |||||||||
Note: Values presents in mean ± standard deviation of triplicate for each sample (n=3); values
are significantly different at the level of p<0.05 for each storage period, storage temperature and packing conditions.
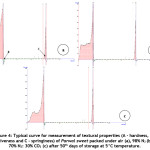 |
Figure 4: Typical curve for measurement of textural properties (A – hardness, B – adhesiveness and C – springiness) of Parwal sweet packed under air (a), 98% N2 (b) and 70% N2: 30% CO2 (c) after 50th days of storage at 5°C temperature. Click here to View figure |
Table 5: Sensory evaluation of Parwal sweet packaged under air and MAP stored at 5, 10 and 25°C.
| Storage period (days) |
Atmosphere | Color and appearance | Flavor | Body & texture | Overall acceptability (OAA) | ||||||||
| 5˚C | 10 ˚C | 25 ˚C | 5 ˚C | 10 ˚C | 25 ˚C | 5 ˚C | 10 ˚C | 25˚C | 5 ˚C | 10 ˚C | 25 ˚C | ||
| 0 | Fresh | 9.00 ± 00.00 | 9.00 ± 00.00 | 9.00 ± 00.00 | 9.00 ± 00.00 | 9.00 ± 00.00 | 9.00 ± 00.00 | 9.00 ± 00.00 | 9.00 ± 00.00 | 9.00 ± 00.00 | 9.00 ± 00.00 | 9.00 ± 00.00 | 9.00 ± 00.00 |
| 10 | Control | 7.60 ± 00.50a | 6.70 ± 00.54b | 6.00 ± 00.00c | 7.40 ± 00.54a | 6.90 ± 00.54b | 6.00 ± 00.10c | 7.80 ± 00.27a | 7.10 ± 00.27b | 6.00 ± 00.00c | 7.70 ± 00.27a | 7.05 ± 00.42b | 6.38 ± 00.18c |
| 100% N2 | 8.00 ± 00.50a | 7.00 ± 00.50b | 6.20 ± 00.27c | 7.90 ± 00.14a | 6.10 ± 00.54b | 5.90 ± 00.04c | 8.30 ± 00.17a | 6.30 ± 00.27b | 6.30 ± 00.27c | 8.10 ± 00.61a | 6.65 ± 00.52b | 6.13 ± 00.21c | |
| 70% N2 + 30% CO2 | 8.50 ± 00.15a | 8.10 ± 00.50b | 6.50 ± 00.50c | 8.40 ± 00.27a | 7.40 ± 00.54b | 6.40 ± 00.53c | 8.80 ± 00.44a | 8.50 ± 00.44a,b | 6.80 ± 00.54c | 8.78 ± 00.54a | 8.10 ± 00.08b | 6.57 ± 00.14c | |
| 20 | Control | 7.30 ± 00.44a | 6.27 ± 00.07b | 6.90 ± 00.39a | 6.07 ± 00.10b | 7.30 ± 00.21a | 6.10 ± 00.03b | 7.30 ± 00.27a | 6.40 ± 00.00b | ||||
| 100% N2 | 7.50 ± 00.50a | 6.84 ± 00.20b | 7.40 ± 00.08a | 6.90 ± 00.03b | 7.80 ± 00.31a | 6.50 ± 00.10b | 7.10 ± 00.41a | 5.00 ± 00.00b | |||||
| 70 %N2 + 30% CO2 | 8.30 ± 00.44a | 7.38 ± 00.03b | 8.20 ± 00.02a | 7.02 ± 00.10b | 8.30 ± 00.14a | 7.00 ± 00.28b | 7.90 ± 00.54a | 7.50 ± 00.00b | |||||
| 30 | Control | 6.40 ± 00.44a | 5.00 ± 00.32b | 6.40 ± 00.11a | 5.40 ± 00.04b | 6.80 ± 00.05a | 5.10 ± 00.23b | 6.80 ± 00.27a | 5.40 ± 00.43b | ||||
| 100% N2 | 7.20 ± 00.27a | 5.40 ± 00.32b | 6.90 ± 00.08a | 5.70 ± 00.17b | 6.80 ± 00.08a | 5.70 ± 00.34b | 6.60 ± 00.41a | 5.80 ± 00.43b | |||||
| 70 %N2 + 30% CO2 | 8.10 ± 00.27a | 6.14 ± 00.01b | 7.92 ± 00.51a | 6.50 ± 00.13b | 8.05 ± 00.14a | 6.80 ± 00.74b | 8.25 ± 00.24a | 6.80 ± 00.21b | |||||
| 40 | Control | 6.10 ± 00.04 | 5.90 ± 00.09 | 6.30 ± 00.26 | 6.60 ± 00.07 | ||||||||
| 100% N2 | 6.70 ± 00.27 | 6.60 ± 00.01 | 6.80 ± 00.17 | 6.73 ± 00.17 | |||||||||
| 70 %N2 + 30% CO2 | 7.50 ± 00.14 | 7.64 ± 00.04 | 7.80 ± 00.43 | 7.71 ± 00.24 | |||||||||
| 50 | Control | 5.10 ± 00.07 | 5.40 ± 00.20 | 5.61 ± 00.01 | 5.40 ± 00.07 | ||||||||
| 100% N2 | 6.40 ± 00.00 | 6.30 ± 00.10 | 6.40 ± 00.07 | 6.40 ± 00.13 | |||||||||
| 70 %N2 + 30% CO2 | 7.20 ± 00.04 | 7.10 ± 00.07 | 7.55 ± 00.02 | 7.52 ± 00.07 | |||||||||
Note: Values presents in mean ± standard deviation of triplicate for each sample (n=3); values are significantly different at the level of p<0.05 for each storage period, storage temperature and packing conditions.
Conclusions
An attempt was made to evaluate the shelf life of laboratory prepared Parwal sweet stored under air and MAP with variation in gas composition viz., 98 % N2, 70% N2: 30% CO2 during three different storage temperatures (5, 10 and 25°C). The sample stored under air displayed lower nutritional value, antioxidant activity and higher microbial load, HMF, TBA, FFA with poor textural and sensory quality comparatively. Therefore, the MAP could be considered as an option to ensure the storage stability of Parwal sweet. The sample packed under 70% N2: 30% CO2 was optimally effective in preserving the microbial, textural, sensory and physicochemical properties of Parwal sweet at 5°C for 50 days followed by stored at 10 °C for 30 days. This study could prove to be helpful in preservation of other vegetables based dairy products using MAP.
Acknowledgments
Authors are immensely thankful to Centre of Food Science and Technology, Institute of Agricultural Sciences, Banaras Hindu University, for providing the opportunity to complete this work by extending the facilities.
Funding
Financial support is provided by the Centre of Food Science and Technology, Institute of Agricultural Sciences, Banaras Hindu University, India.
Compliance with Ethics Requirement
It is certified that:
- The manuscript has not been submitted to more than one journal for simultaneous consideration.
- The manuscript has not been published previously (partly or in full).
- A single study is not split up into several parts to increase the quantity of submissions and submitted to various journals or to one journal over time.
- No data have been fabricated or manipulated (including images) to support our conclusions
- No data, text, or theories by others are presented as if they were the author’s own (“plagiarism”). Proper acknowledgments to other works have been given, quotation marks are used for verbatim copying of material, and permissions are secured for material that is copyrighted.
- Consent to submit has been received explicitly from all co-authors, as well as from the responsible authorities – tacitly or explicitly – at the institute/organization where the work has been carried out, before the work is submitted.
- Authors whose names appear on the submission have contributed sufficiently to the scientific work and therefore share collective responsibility and accountability for the results.
Conflict of Interest
The authors have no conflicts of interest to declare.
Informed consent
This article does not contain any studies with either animals or human participants performed by any of the authors.
References
- Viswas N. R., Pandey R. K., Singh V. P., Dubey M., Chaubey A. K. Technology of stuffed parwal sweet production. Int J Res Stud Biosci. (2014); 2(8): 1-5.
- Kewat R.N., Singh R.P., Abidi A.B. Screening of pointed gourd (Trichosanthes dioica) varieties and strains for sweet making. Pantnagar J Res. (2007); 5: 14-16.
- How to prepare parwal sweet. (Indian vegetarian recipes in English) http://nishamadhulika.com/en/336-parwal-sweet-recipe.html. Accessed 08 January 2018.
- Mythili J. B., Thomas P. In vitro multiplication of pointed gourd (Trichosanthes dioica Roxb.). Sci Hort. (1999); 79: 87-90.
CrossRef - Kirtikar K. R., Basu B. D. Indian Medicinal Plants, 2nd edn. Lalit Mohan Basu, Allahabad, India. (1956); pp. 1110-1111.
- Gopalan C., Ramasastri B. V., Balasubramanian S. C. Nutritive value of Indian foods. ICMR, National Institute of Nutrition, Hyderabad, India, (1982); p. 156.
- Rai P. K., Shukla S., Mehta S., Rai N. K., Rai A. K., Watal G. Therapeutic phytoelemental profile of Trichosanthes dioica. Adv Mat. Lett. (2010); 1(3): 210-216.
CrossRef - Jha A., Kumar A., Jain P., Gautam A. K., Rasane P. Effect of modified atmosphere packaging on the shelf life of Lal peda. Food Sci Technol. (2015); 52(2): 1068-1074.
CrossRef - Chowdhury T., Chattopadhaya S., Saha N. C. Modified atmosphere packaging (MAP) and the effect of chemical preservative to enhance shelf life of khoa. (An abstract, World Academy of Science, Engineering and Technology, International Journal of Nutrition and Food Engineering, 2016), http://waset.org/abstracts/52712. Assessed 10-11 October 2016
- Londhe G. K., Pal D., Raju P. N. Effect of packaging techniques on shelf life of brown peda, a milk-based confection. LWT-Food Sci Technol. (2012); 47: 117-125.
CrossRef - Mishra, B. B., Patel, A. S., Kar, A. Storage Stability of Encapsulated Anthocyanin-Rich Extract from Black Carrot (Daucus Carota Sativus) using different Coating Materials. Curr. Agri. Res. (2018); 7(1): 53-61.
CrossRef - Ghayal G., Jha A., Kumar A., Gautam A. K., Rasane P. Effect of modified atmospheric packaging on chemical and microbial changes in dietetic rabri during storage. J Food Sci Technol. (2015); 52(3): 1825-1829.
CrossRef - Chetana R., Krishnamurthy S., Reddy Y.S. Rheological behaviour of syrup containing sugar substitutes. Eur J Food Res Technol. (2004); 218: 345-348.
CrossRef - Chetana R., Srinivasa P. C., Reddy Y. S. Moisture sorption characteristics of burfi, an Indian traditional sweet using sugar substitute. Eur J Food Res Technol. (2005); 220: 136-141.
CrossRef - Chawla R., Singh A. K., Patil G. R. Shelf life enhancement of functional doda burfi (indian milk cake) with biopreservatives application. Int J Res Sci Technol. (2015); 5: 26-40.
- Patel A. S., Pandey A. K. Fortification of Limonia acidissima fruit powder to develop the phenolic enriched herbal biscuits. J Biores Eng Technol. (2014); 1: 74-85.
- Patel A. S., Pradhan R. C. Quality ranking of bottle gourd seed cake powder incorporated biscuits using fuzzy analysis of sensory attribute. BIOINFOLET-A Quart J Life Sci. (2015);12(4a): 901-908.
- Patel, A. S., Lakshmibalasubramaniam, S., Nayak, B. Steric stabilization of phycobiliprotein loaded liposome through polyethylene glycol adsorbed cellulose nanocrystals and their impact on the gastrointestinal tract. Food Hydrocolloid., (2020); 98: 105252.
CrossRef - Dhakane J. P., Kar A., Patel A. S., Khan I. Effect of soy proteins and emulsification-evaporation process on physical stability of lycopene emulsions. Int J Chem Studies. (2017); 5(5): 1354-1358.
- Patel, A. S., Kar, A., & Khan, I. (2017). Process for development of β-carotene Nanocomposites with ɷ-fatty acids.
- Patel A. S., Pradhan R. C., Kar A., Mohapatra D. Effect of Fortification of De-oiled Bottle Gourd (Lagenaria siceraria) Seed on the Functional and Chemical Characteristics of the Biscuit: A Nutritional Assessment. Curr Res Nutr Food Sci. 2018; 6(3).
CrossRef - Randell K., Hattula T., Ahvenainen R. Effect of packaging method on the quality of rainbow trout and baltic herring fillets. LWT – Food Sci Technol. (1997); 30: 56-61.
CrossRef - Gimenez B., Roncales P., Beltran J. A. Modified atmosphere packaging of filleted rainbow trout. J Sci Food Agric. (2002); 82: 1154-1159.
CrossRef - Oliveira M., Abadias M., Usall J., Torres R., Teixido N., Vinas I. Application of modified atmosphere packaging as a safety approach to fresh-cut fruits and vegetables, A review. Trends Food Sci Technol. (2015); 46: 13-26.
CrossRef - Lalitha K. V., Gopakumar K. Growth and toxin production by Clostridium botulinum in fish (Mugil cephalus) and shrimp (Penaeus indicus) tissue homogenates stored under vacuum. Food Microbiol. (2001); 18: 651-665.
CrossRef - Modified atmosphere packaging of fresh produce: current status and future needs. LWT, Food Sci Technol. (2010); 43: 381-392.
CrossRef - Parry R. T. Principles and Applications of modified atmosphere packaging of Food, ed. By R.T. Parry; Glasgow, UK, Blackie, (1993); p. 1-18.
CrossRef - Church N. MAP fish and crustaceans-sensory enhancement. Food Sci Technol Today. (1998); 12(2): 73- 83.
- Hotchkiss J. H. Microbiological hazards of controlled/modified atmosphere food packaging. J Assoc Food Drug Off. (1989); 53: 41-49.
- Stammen K., Gerdes D., Caporaso F. Modified atmosphere packaging of seafood. Food Sci Nutr. (1990); 29: 301-331.
CrossRef - Pradhan R. C., Patel A. S., Mishra S. Physico-chemical properties of bottle gourd kernel. J Agric Eng. (2015); 52(4): 28-34.
- Duhan S., Kar A., Nain L., Patel A. S., Dash S. K. Development of continuous flow microwave and hot water bath system for destruction of spoilage microorganisms in food. Ind J Agric Sci. (2017); 87(2): 210-214
- Ghosh P., Pradhan R. C., Patel A. S., Kar A., Mishra S. Physicochemical characteristics of Syzygium cumini Curr Res Nutr Food Sci. (2017); 5(1), 25-35.
CrossRef - Patel, A., Balunkeswar Nayak. “Mobilization of lipophobicity of cellulose nanocrystals (CNCs): An efficient encapsulation of phycobiliproteins.” In abstracts of papers of the American Chemical Society, vol. 256. 1155 16TH ST, NW, Washington, DC 20036 USA: Amer Chemical Soc. 2018.
- Mohapatra D., Patel A. S., Kar A., Deshpande S. S., Tripathi M. K. Effect of Different Processing Conditions on Proximate Composition, Anti-oxidants, Anti-nutrients and Amino Acid Profile of Grain Sorghum. Food Chem. 2018; 271:129-135.
CrossRef - Jain V., Rasane P., Jha A., Sharma N., Gautam A. Effect of modified atmospheric packaging on the shelf life of kalakand and its influence on microbial, textural, sensory and physico-chemical properties. J Food Sci Technol. (2015); 52(7): 4090-4101.
CrossRef - Aneja R. P., Mathur B. N., Chauhan R. C., Banerjee A. K. Technology of Indian dairy products. Dairy India Publication, New Delhi, India, (2002); 122-125.
- Anklam E. Determination of the moisture (water) content in milk products. European Commission Joint L Research Centre, Environment Institute Food and Drug Analysis, Consumer Protection Unit Ispra – Italy. (1997); pp. 5.
- Davis J. G., MacDonald F. J. Richmond’s Dairy Chemistry. 5th edn., London, Charles Griffin and Co. Ltd., London. (1953); pp. 36.
- Deeth H. C., Fitz-Gerald C. H., Wood A. F. A convenient method for determining the extent of lipolysis in milk. Aust J Dairy Technol. (1975); 30: 109-111.
- Rangana S. Handbook of analysis and quality control for fruit and vegetable products. 2nd edn., Tata McGraw hill education Private Limited. (1986); pp. 83.
- Nishino T., Shibahara-Sone H., Kikichi-Hayakawa H., Arendt E. K. Transit of radical scavenging activity of milk products prepared by Millard reaction and Lactobacillus caseiistrain Shirota fermentation through the hamster intestine. J Dairy Sci. (2000); 83: 915-922.
CrossRef - Miller N. J., Sampson J., Candeias L. P., Bramley P. M., Rice-Evans C. A. Antioxidant activities of carotenes and xanthophylls. FEBS Lett. (1996); 384: 240-242.
CrossRef - D’Aniello A., Petrucelli L., Gardner C., Fisher G. Improved method for hydrolyzing proteins and peptides without inducing racemization and for determining their true D-amino acid content. Anal Biochem. (1993); 213(2): 290-295.
CrossRef - Fountoulakis M., Lahm H. Hydrolysis and amino acid composition analysis of proteins, Review. J Chromatogr A. (1998); 26: 109-134.
CrossRef - Cliffe S. S., Fawer M. S., Maier G., Takata K. M., Ritter G. Enzyme assays for the phenolic content of natural juices. J Agric Food Chem. (1994); 42: 1824-1828.
CrossRef - Zakrzewska M. E., Bogel-Lukasik E., Bogel-Lukasik R. “Ionic liquid-mediated formation of 5-hydroxymethylfurfurals-a promising biomass-derived building block”. Chem Rev. (2011); 111: 397-417.
CrossRef - Putten R. J., Waal J. C., Jong E., Rasrendra C. B., Heeres H. J., Vries J. G. Hydroxymethylfurfural, a versatile platform chemical made from renewable resources. Chem. Rev. (2013); 13: 1499-1597.
CrossRef
Accepted on: 29/09/2019
Second Review by: Chinyere Nkem Nigeria
Final Approval by: Prof. Min-Hsiung Pan


Web of Science Coverage
Emerging Sources Citation Index (ESCI)
2024 Journal Impact Factor: 1.1
Scopus Journal Metrics
CiteScore 2025: 2.6
CiteScore Details
Sustainable Nutrition: Food Systems, Nutrient Retention, and Public Health Impact
![]()
This journal is a member of, and subscribes to the principles of, the Committee on Publication Ethics (COPE)


