Is Soft Drink Consumption Linked to Higher Body Mass Index and Energy Intake Among Adults in Mauritius?
 2, Rajesh Jeewon1*
 1Department of Health Sciences, Faculty of Science, University of Mauritius, Réduit, Mauritius.
2Faculty of Agriculture, University of Mauritius, Reduit, Mauritius.
Corresponding Author Email: r.jeewon@uom.ac.mu
DOI : http://dx.doi.org/10.12944/CRNFSJ.7.3.12
Download this article as:
![]()
The World Health Organisation recommends people to keep their calorie intake from soft drink (SD) less than 10% of their daily calorie intake. Even though, calorie intake from soft drink consumption is low, there is an increase in the frequency of consumption. Also, besides, it is well understood that change in weight is not only dependent on soft drink consumption but also factors such as calorie intake and physical activity. The objective of this study is to investigate SD consumption and its association with BMI, physical activity and calorie intake among adults. 511 adults aged 20-60 years (208 male and 303 female) were recruited. The questionnaire used to elicit information included 3-day 24-hour dietary recall, physical activity habits and soft drink consumption. Anthropometric measurements (height, weight and waist circumference) were also taken. The data was analysed using SPSS version 2.0. Chi-square tests, Person coefficient test, and Spearman’s correlation tests were used to infer any relationships between variables. The mean daily calorie intake among the population is 2501 ± 86.46 Kcal/day. Energy intake by both genders is within the range recommended by USDA (males: 2182 ± 33.48 Kcal/day and female: 1925 ± 28.55 Kcal/day). BMI is slightly higher among female 25.00 ± kg/m^2 as compared to male 24.73 kg/m^2. Mean Energy intake from SD is found to be 88.57 ± 3.37 Kcal/day that accounts for 3.54% of the daily calorie intake and hence in line with the WHO recommendation. A significant association is seen between SD consumption and BMI (P= 0.02), however obesity and overweight is seen to be independent of SD consumption. Furthermore, a positive correlation wasfound between SD consumption and physical activity (P=0.01) and it is observed that 26.3 % of the population who had a sedentary lifestyle are overweight. No association was found between calorie intake and SD consumption (P= 0.731) since the percentage calorie from SD does not exceed the recommendation of WHO. A significant relationship is found between SD consumption and BMI. However, it is observed that physical activity has a higher influence on BMI independent of calorie intake and soft drink consumption. Even though soft drink is reported herein not influence on the prevalence of obesity and overweight, long-term soft drink consumption can result in health problems related to obesity.
KEYWORDS:Adults; Body Mass Index; Calorie Intake; Physical Activity Level; Soft Drinks
Introduction
The addition of sugar is not nutritionally necessary in an individual’s diet as most of our food consist of natural sugars that provide us with sufficient energy. Nevertheless, for the last few decades, there has been an increase in the consumption of sugary products. Soft drinks (SD) have become an ultimate liquid to quench thirst over water but these products contain a high amount of refined sugar known as free sugars. SD can be in the form of carbonated drinks or juices that consist of a high quantity of refine sugar. Several studies have associated SD with weight gain and metabolic syndrome that include morbidities such as diabetes and cardiovascular disease. In addition to this, SD has low satiety and contributes to a high glycemic load.1, 2, 3, 4
The World Health Organisation (WHO) has reported that high consumption of free sugars result in a rise in body mass index (BMI). Therefore, WHO recommends adults and children to reduce their daily intake of free sugars to less than 10% of their daily total energy intake.5 The quantity of free sugars (30g) present in a can of soft drink (330ml) exceeds the UK’s daily-recommendation.6 Studies report that the amounts of SD consumed worldwide have increased excessively and this evidently leads to higher calorie intake, which in turn has strongly been associated with adiposity, diabetes and cardio-metabolic diseases.2,3,7,8
People have been largely exposed to a western lifestyle that comprises of high intake of calorie-dense food such as SD and fast food and decreased physical activity, thus leading to the obesity epidemic.2 Several studies have reported that sedentary people have a greater BMI compared to their active counterpart. Furthermore, it has been reported that people who are not physically active or engaged in sedentary activities such as watching television are more likely to consume high caloric food. Also, these individuals consume larger portion of meals and binge-eat on unhealthy snacks and SD, which will eventually lead to weight gain as a result of low energy expenditure.9 Another study show that a constant positive energy imbalance of at least 50 calories per day is reported to a gain of 5-pounds over a period of one year.10 Among women, high consumption of SD is related to an increase of energy intake in terms of simple carbohydrates, fructose, and sucrose and simultaneously leading to a decrease in the intake of starch, cereal, magnesium, and fiber.11
Even though that energy intake is on the rise, the level of physical activity is decreasing more rapidly.12,13,14 There are several controversial reports on the level of physical activity among consumers and non-consumers of soft drinks. Nevertheless, calories from SD still add up to the total energy intake, therefore, physical activity is very crucial to burn out excess calories to prevent obesity and its associated health problem.13
Mauritius, a small island located in the Indian Ocean is a multi-ethical and multi-cultural country with 1.2 million inhabitants and in 2015, a national survey on non-communicable diseases reported that 19.1% of the population is obese. Mauritius is a fast developing tropical country with sudden lifestyle changes and accompanied by increased consumption of fast food, higher intake of SD and neglect of traditional foods.15 Recent studies have focused on issues such as BMI, PAL , energy intake , nutrition intervention programs and different target population . 16,17,18,19,20,21,22,23,24,25,26,27,28 However, no study has been conducted to evaluate the influence of SD consumption on BMI and energy intake among adults.
This study aims at establishing the relationship between SD consumption and BMI among adults. The objectives of the investigation are as follows:
- To assess BMI and waist circumference (WC) among adults who consume soft drinks.
- To investigate the relationship of daily calorie intake and soft drink consumption towards BMI and WC.
- To study the association of physical activity level towards soft drink consumption, BMI, calorie, and WC.
Methods
Participants and socioeconomic demographics
The cross-sectional study consisted of 511 participants (208 males and 303 females) aged between 20 to over 60 years old. The questionnaire used, consisted of 5 age groups: 20-29, 30-39, 40-49, 50-59 and 60 years. The level of education was classified as follows: primary, secondary, tertiary, and postgraduates. Participants were categorized as students, employed, housewife and unemployed. The University of Mauritius (Department of Health Sciences research ethics committee) granted approval for the research and prior consent was obtained from all participants.
3-day 24h recall
Diet recalls for 2 weekdays and 1 weekend were recorded in order to assess the energy intake. The participants needed to record the first thing they ate or drank in the morning up to the last thing they ate or drank before going to bed. They had to record the amount of food they have consumed and time of the day.
Physical activity level
The participants were asked the number of times per week that they do physical activities. If they did not, the section was skipped. If they were engaged in physical activities, they were asked the type of activity they do and to indicate the number of times they practice per week and how much time they devote to the exercises. Physical activity level was divided into 3 parts that is in line with the World Health Organisation physical activity guidelines.
- Vigorous- the person must carry out muscle strengthening activities for two or more days per week (PAL value: 2.00-2.40).
- Moderate- the participant must carry out moderate intensity activity for at least 300 minutes per week (PAL value: 1.70-1.99).
- Walking- the person must devote at least 150 minutes per week for walking or carry out moderate intensity activity for that amount if time (PAL value: 1.70-1.99).
- Sedentary- the person do not much effort for example travel by bus, have little body movements and they sit most of the time (PAL value: 1.40-1.69) .29
The participants were asked the type of activities they do, for example jogging, swimming, or weight lifting. Then according to the amount of strength and time devoted to the activities the participants was classified in the appropriate physical activity level. Moreover, the work of the people was also considered when measuring the physical activity level, for examples labourers in fields and people carrying out duties such as loading of steels, heavy boxes or work at construction sites were seen as carrying out vigorous physical activities if they complete the 300 minutes per week.
3-days soft drink consumption
The participants had to state the brand, frequency, and amount of soft drink they consumed. The consumption of SD is recorded according to daily average consumption during the 3 days reported by the participants. According to beverages labels 100 ml of soft drink consists of at least 42.4 kcal (10g sugar) and 100 ml of diluted juice contain a minimum of 36kcal (9g sugar). High soft drink consumption is designated to people who take more than 200 ml of soft drink that account for more than 84.9 Kcal.
Table 1: Classification of soft drink consumption
| Soft Drinks (Kcals) | Classification |
| 0-42.3 | Rarely |
| 42.4-84.8 | Moderate |
| ≥84.9 | High |
Anthropometric measurements
Measurements of the participant’s height, weight and waist circumference were taken. The BMI was calculated the general formula weight divided by square of the height. 28 BMI and waist circumference were divided into three categories for each gender (Tables 2 and 3).
Table 2: Classification of BMI
| BMI (KG/m2 ) | Classification |
| <18.5 | Underweight |
| 18.5-24.9 | Normal |
| 25-29.9 | Overweight |
| ≥ 30 | Obese |
Table 3: Classification of waist circumference
| Waist circumference (cm) | Classification |
| Male | |
| ≤ 94.9 | Normal |
| 95-101.9 | High |
| ≥ 102 | Very high |
| Female | |
| ≤ 80.9 | Normal |
| 81.0-88.9 | High |
| ≥90 | Very high |
Statistical Analyses
Data was analysed using Statistical Package for the Social Science (SPSS) version 20.0. Descriptive test were expressed as percentage. Chi-square test, Pearson’s correlation test, and Spearman’s coefficient test were used to show predictive test between the variables. P-value < 0.05 showed a significant relationship between the variables.
Results
Soft drink consumption and energy intake.
The average calorie intake is 2501± 86.46 Kcal among the sample population; men have an average calorie intake of (2182 ± 33.48 kcal/day) and women (1925 ± 28.55 kcal/day). The sampled population consume a high amount of SD (51.5%), and the frequency of SD consumption is more prevalent among females (54.8%). Men consume a higher amount of calorie from SD (103.1 ± 6.00) as compared to women (76 ± 3.81). Table 4 indicates that people aged 30-39 years old consume high amount of calorie from SD (58.6%). People with a primary level of education are more likely to consume of high amount of SD (58.2%) as compared to 36.4 % postgraduates who rarely take SD. The consumption of SD is high among the unemployed (57.1%) and housewives (57.6 %). However, no significant association is found between soft drink consumption, gender (P= 0.072), age (P=0.544), level of education (0.064) and occupational status (P=0.07).
Table 4 : Soft drink consumption among the sampled population
| Variables | Mean (Kcal) ± S.E | ||
| Whole Sample | Male | Female | |
| Soft drinks | 88.57 ± 3.37 | 103.1 ± 6.00 | 78.60 ± 3.81 |
| Calorie intake | 2501 ± 86.46 | 2182 ± 33.48 | 1925 ± 28.55 |
| Percentage (%) of SD consumption | |||
| Characteristics | High | Moderate | Rarely |
| Whole sample | 51.5 | 23.5 | 25.0 |
| Male | 45.2 | 33.3 | 38.3 |
| Female | 54.8 | 66.7 | 61.7 |
| Age | |||
| 20-29 | 53.0 | 23.3 | 23.7 |
| 30-39 | 58.6 | 18.4 | 23.0 |
| 40-49 | 50.6 | 26.0 | 23.4 |
| 50-59 | 40.0 | 27.5 | 32.5 |
| 60+ | 51.4 | 22.9 | 25.7 |
| Level of education | |||
| Primary | 58.2 | 29.1 | 12.7 |
| Secondary | 52.2 | 23.6 | 24.2 |
| Tertiary | 48.5 | 23.3 | 28.2 |
| Postgraduates | 50.0 | 13.6 | 36.4 |
| Occupational status | |||
| Employed | 53.7 | 20.8 | 25.5 |
| Unemployed | 57.1 | 7.1 | 35.7 |
| Housewife | 57.6 | 33.3 | 9.1 |
| Student | 42.9 | 26.3 | 30.8 |
| Region of residence | |||
| Rural | 55.1 | 62.5 | 51.6 |
| Urban | 44.9 | 37.5 | 48.4 |
Soft drink consumption, anthropometric measurements, and physical activity.
The mean BMI is 25.00±5.19 kg/m2 for females and 24.73±3.84 kg/ m2 for men. In addition, the mean waist circumference for women is 86.41±16.57 cm whereas for men, it is 91.22±10.52 cm. 26.2% overweight people consume high amount of soft drink compared to 11.0% obese people. A significant association between soft drink consumption and BMI is obtained (p=0.020). There is no relationship between soft drink consumption, normal BMI (P=0.560), overweight (P=0.612) and underweight (0.803). However, a negative association is reported between soft drink consumption and obesity (p<0.001). 42.2% people who rarely consume SD have a normal waist circumference and 25.1% who have a high intake of SD, have a high waist circumference. A significant relationship between soft drink intake and very high waist circumference (P=0.023) was found. 69.6% of participants, who consume high amount of SD, adopt a sedentary lifestyle whereas only 6.5% who do vigorous physical activity consume high amount of soft drinks. A statistically significant relationship is obtained between soft drink consumption and physical activity (p= 0.001).
Table 5: Anthropometric measurement.
| Anthropometric | Percentage (%) | p-value | |
| Male (n= 208) | Female (n=303) | ||
| BMI | |||
| Underweight | 6.7 | 5.3 | |
| Normal weight | 45.2 | 54.1 | |
| Overweight | 38.5 | 20.8 | |
| Obese | 9.6 | 19.8 | |
| Mean (kg/m2) | 24.73±3.84 | 25.00±5.19 | >0.05 |
| Waist circumference | |||
| Normal | 56.7 | 41.3 | |
| High | 29.3 | 15.8 | |
| Very high | 13.9 | 42.9 | |
| Mean (cm) | 91.22±10.52 | 86.41±16.57 | <0.05 |
Table 6: Soft drink consumption, anthropometrics measurement and physical activity
| Percentage of soft drink consumption (%) | p-value | |||
| High | Moderate | Rarely | ||
| BMI | ||||
| Normal weight | 55.9 | 50.0 | 39.8 | |
| Obese | 11.0 | 21.0 | 21.1 | |
| Overweight | 26.2 | 26.7 | 32.8 | |
| Underweight | 6.8 | 3.3 | 6.3 | 0.020 |
| Waist circumference | ||||
| Normal | 51.3 | 45.0 | 42.2 | |
| High | 23.6 | 21.7 | 16.4 | |
| Very high | 25.1 | 33.3 | 41.4 | 0.022 |
| Physical activity level | ||||
| Sedentary | 696 | 60.0 | 50.8 | |
| Moderate | 24.0 | 36.7 | 36.7 | |
| Vigorous | 6.5 | 3.3 | 12.5 | 0.001 |
Physical activity and soft drink consumption.
Men (vigorous PAL= 12%) have a higher physical activity than women (vigorous PAL= 4%). A significant relationship is observed between physical activity, body mass index, and waist circumference (p < 0.05, Table 8). The results demonstrate that the level of physical activity is low among obese (19.4%). People who adopt high physical activity are more likely to have a normal BMI (73.0%) and waist circumference (64.9%). 35.9% of participants, who are sedentary, have a very high waist circumference.
Table 7: Frequency of soft drink consumption and physical activity
| Anthropometric Measurements | Physical Activity level (%) | p-value | ||
| Sedentary | Moderate | Vigorous | ||
| Gender | ||||
| Males | 51.4 | 36.5 | 12.0 | |
| Females | 70.3 | 25.7 | 4.0 | < 0.001 |
| Soft drinks | ||||
| High | 57.2 | 40.9 | 45.9 | |
| Moderate | 22.5 | 28.6 | 10.8 | |
| Rarely | 20.3 | 30.5 | 43.2 | 0.001 |
| BMI | ||||
| Normal weight | 48.1 | 50.0 | 73.0 | |
| Overweight | 26.3 | 33.1 | 26.1 | |
| Obese | 19.4 | 10.4 | 5.4 | |
| Underweight | 6.3 | 6.5 | – | 0.010 |
| Waist Circumference | ||||
| Normal | 40.0 | 59.1 | 64.9 | |
| High | 24.1 | 16.9 | 16.2 | |
| Very high | 35.9 | 24.0 | 18.9 | <0.001 |
Soft drink consumption and calorie intake
Table 4 demonstrates that the mean calorie intake is higher among men, 2182 ± 33.46 kcal/day compared to women (1925 ± 28.55 kcal/day). Figure 1 shows prevalence of women moderate calorie intake is higher among women (n=200, 66.0%) than men (n=107, 51.4%). A Spearman’s correlation test showed a significant relationship between calorie intake and gender, =0.203, p <.0.001
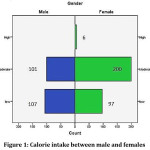 |
Figure 1: Calorie intake between male and females Click here to View figure |
The prevalence of high SD intake (62.4%, 95.21 ± 4.47 kcal/day) is observed (Table 7) among people who have a moderate calorie intake. However there is no significant association between SD consumption and calorie intake (=0.15, p=0.731). Calorie intake is higher among overweight people (2925 ± 299.0 kcal/day) compared to obese people (2353 ± 68.08kcal/day). Nevertheless, calorie intake from SD is higher among obese people and underweight people, 84.37±6.34 Kcal/day and 96.55±16.33 kcal/day respectively. No significant relationship is found between calorie intake, soft drink consumption, overweight, and obesity. The mean calorie intake from SD is higher for people who have a high waist circumference (98.82 ± 7.75 kcal/day). A statistically significant relationship is observed between calorie intake, SD and waist circumference (p<0.001). Sedentary people have a high calorie intake from SD (95.47 ± 3.99 kcal/day) compared to vigorous active individuals (67.02±12.07 kcal/day). However, daily calorie intake is highest among people who are vigorously active (3057 ± 86.90 kcal/day). All levels of physical activity are significantly correlated with calorie intake, SD consumption, and physical activity.
Table 8: Calorie intake and soft drink consumption
| Calorie intake | Mean SD ± S.E(Kcal/day) | Soft drink consumption (%) | ||
| High | Moderate | Rarely | ||
| Low | 79.30 ± 5.16 | 36.9 | 39.2 | 46.9 |
| High | 95.21 ± 4.47 | 62.4 | 59.2 | 51.6 |
| Moderate | 71.11±25.80 | 0.8 | 1.7 | 1.6 |
Table 9: Statistical analysis of soft drink consumption, anthropometric measurements and physical activity level.
| Variables | P-value | Daily | Soft drinks |
| Pearson correlation | |||
| BMI | |||
| Normal weight | 0.41 | 2354 ±30.27 | 93.57±4.55 |
| Overweight | 0.86 | 2925 ± 299.0 | 77.05±8.97 |
| Obese | 0.29 | 2353 ± 68.08 | 84.37±6.34 |
| Underweight | <0.001 | 2134 ± 76.81 | 96.55±16.33 |
| Spearman correlation | |||
| Waist circumference | |||
| Normal | 0.42 | 2444 ± 33.75 | 92.95 ± 4.88 |
| High | 0.001 | 2923± 394.21 | 98.82 ± 7.75 |
| Very high | 0.32 | 2297 ± 31.49 | 74.86 ± 5.64 |
| Physical activity level | |||
| Sedentary | 0.01 | 2381± 135.70 | 95.47 ± 3.99 |
| Moderate | 0.08 | 2616 ± 41.53 | 79.43 ± 6.81 |
| Vigorous | 0.04 | 3057 ± 86.90 | 67.02±12.07 |
Discussion
Evaluation of soft drink consumption and its impact on BMI
Among the sample population, the mean BMI among women was found to be 25.00±5.19 kg/2 and the average BMI among men was 24.73±3.84 kg/2 (p>0.05). The result was consistent with that of Bhurosy & Jeewon who reported no association (p>0.05) between the mean BMI of females (24.5±6.15kg/2) and that of males (24.7±3.31kg/2).20
In addition, a significant correlation is found between soft drink consumption (88.57±3.37 Kcal/day) and BMI (Male: 24.73±3.84 kg/2; Female: 25.00±5.19 kg/2, p=0.020). However, there are controversial reports on any correlation between soft drink consumption and BMI among adults.30, 31, 32 For instance, Bes-Rastrollo et al., reported an association between soft drink consumption and weight gain.30 Whereas, Rombaldi et al.,32 reported that, there is no significant relationship between soft drink consumption and excess weight gain. A possible reason for the increase in weight can be that SD have a low satiety and promote overconsumption of food and beverages.30 Vartanian et al.,7 also reported that along with soft drink consumption, energy intake also could be a confounding factor for increase in BMI. Results show that overweight people has a higher intake of SD compared to obese people ( Table 6).The amount of calorie intake from soft drinks is higher among obese people (mean 84.37± 6.34) compared to those who are overweight (77.05 ±8.97 kcal/day). However, the results of calorie intake among overweight and obese are within the norm as recommended by the WHO. That is, WHO advise people to take less than 10% of their daily calorie intake from free sugars obtained from SD.5
Kvaavik et al., 33 reported that men (11.3%) took more than one serving of soft drink per day compared to women (3.9%) which indicate higher calorie intake from soft drink consumption among men compared to women. Surprisingly, findings obtained during the study indicate that prevalence of SD consumption is higher among women (54.8%) even though the calorie they obtain from SD is low. The high prevalence of SD consumption among women may be due to higher frequent intake. These results indicate that calorie intake of SD consumption is dependent on the amount of soft drink intake but independent on the frequency of soft drink consumption. However, this result is not in line with that reported by Kvaavik et al.,33 where they found that men (27.6%) took SD more frequently than women (21.6%) did. The result is also inconsistent with that of Rehm et al.,34 who reported that men are more likely to take SD than women.
The influence of soft drink consumption and daily calorie intake on waist circumference.
The study reports a higher WC among the female (mean=86.41±16.57 cm) compared to male (mean= 91.22±10.52 cm). A positive correlation was found between WC and both gender (p<0.05). Jiantao et al.,35 reported that, there is 29% increase in visceral adiposity if a person takes more than one serving of SD per day. The latter also found a statistically significant associated between soft drink consumption and visceral adiposity (p<0.001). This result is consistent with our study, where a significant correlation is found between soft drink consumption and WC (p=0.023).
Other scientific investigations have shown a positive correlation between soft drink consumption and WC. A study carried over a period of 10 years indicated that an average consumption of 100 kcal/day of SD, predict a 1.1 cm increase of WC. 36 Moreover, the authors reported a positive correlation between SD and WC. Results hereby also indicate a significant relationship between people with very high waist circumference and SD consumption (p=0.023). These results indicate that, people who regularly consume SD have a higher chance to have an increase of the visceral adiposity after a long period.
Moreover, a significant association is observed between calorie intake, SD consumption and a high WC. The daily calorie intake among people who have a high WC is (2923 ± 394.21 kcal/day) and SD consumption is high (98.82 ± 7.75 Kcal/day). Soft drink consumption is mostly linked with unhealthy lifestyle and consumption of excess calorie. Most of the time, people consume SD when they are having energy dense food such as unhealthy snacks and fast foods. These combinations of foods and beverages consumption lead to a positive energy balance that will lead to weight gain.36 A statistically significant relationship is reported between calorie intake, SD consumption, and WC (p<0.001).
The relationship of physical activity on soft drink consumption.
The results show that high physical activity is more common among men than women (Table 7) are. However, many people adopt a sedentary lifestyle (Men=51.4% and women= 70.3%). Similarly, Kessaram et al., 37 reported that more than 50% of females have a low level of physical activity (less than 600MET) than men. Intake of SD consumption is significantly associated with PAL (p= 0.001). Results report that, 57.2% who have a low level of physical activity consume more SD compared to those who carry out vigorous physical activity (45.9%). Rehm et al., 34 reported that soft drink consumption is more frequent among people who do not meet the Healthy People 2010 physical activity recommendations. Furthermore, results show that 19.4% of obese individuals who adopt a sedentary lifestyle have a higher consumption of soft drinks compared to 5.4% who are vigorously active. The prevalence of SD is higher among obese people and strongly associated to sedentary lifestyle.34
Results show that 35.9% of participants have a very high waist circumference and adopt a sedentary lifestyle as compared to 64.9% individuals who carry out vigorous physical activity and have a normal WC. In this study a significant relationship is observed between SD consumption and very high WC (p=0.023). A high consumption of soft drink and low physical activity is a risk factor of having high visceral adiposity. Cleland et al., 38 reported people are more prone to consume SD while doing sedentary activities (e.g. watching television). 38
The relationship between soft drink consumption, energy intake, and BMI.
The recommended daily calorie intake by the United States Department of Agriculture (USDA) is dependent on age, gender, BMI, basal metabolic rate and level of physical activity. Women are recommended to take 1600Kcal/day to 2400 kcal/day whereas men 2000 Kcal/day to 3000 Kcal/day.39 Results obtained, show that calorie intake for both genders are within the recommended guidelines (women: 1925 ± 28.55 kcal/day; men; 2182 ± 33.48 kcal/day). Results here indicate that a significant correlation is found between calorie intake and gender (p<0.001). The National Health and Nutrition Examination Survey (NHANES) reported that the mean daily calorie intake for men was 2477 Kcal/day and for women, 1825 Kcal/day during 2013 to 2014 which are in line with the results (Table 6). 37 These data indicate that, daily calorie intake among the population is moderate. Results show that calorie intake from soft drink is higher among men than women (Table 6). However, the percentage calorie intake from SD for both genders is 4%. This percentage is in line with the recommended calorie intake from SD suggested by WHOM.41
Although that many studies have documented that an increase in SD consumption lead to an increase in daily calorie intake, this is not the case in our study.42,43 For example, DiMeglio & Mattes.,43 reported that due to low satiety of liquid sugary beverages people tend to over eat in order to achieve the feeling of fullness.43 Thereby, people consume an excess of energy and promote a positive energy balance that will result in weight gain. However, no association is found between calorie intake and soft drink consumption (p=0.731) in our investigation. Herein, we can report that daily calorie intake is not associated with weight gain. A possible explanation is that, people do not exceed their daily energy requirement, even though that they consume high calorie from SD (Table 6). The percentage calorie intake from SD among the population is 3%, which implies that the population do not exceed the recommendation of WHO.5
Relationship of energy intake and soft drink consumption towards obesity, and overweight.
Bleich et al., 44 reported that there is a significant relationship between consumption of SD, obesity and overweight and indicated that obese people have a larger calorie intake than overweight people. Results herein show that there is no significant association between calorie intake and SD consumption in terms of obesity and overweight (Table 9). A possible reason is, despite being overweight and obese, the average calorie intake does not exceed the recommendation given by USDA.39 Moreover, the percentage calorie intakes by both the obese and overweight population are less than 5%. This implies that soft drink intake has a very weak influence on weight gain.
The influence of physical activity level on calorie intake and soft drink consumption.
Stein & Colditz.,45 reported that there is a high prevalence of overweight and obesity due to high-energy intake and low energy expenditure. However, results show that calorie intake is higher among vigorously active people compared to sedentary people (Table 7). In addition, the average amounts of soft drinks consumed by both groups are within the norm recommended by the WHO. Some studies reported that those who adopt a sedentary life style are more at risk of gaining weight.45, 46 Sedentary activities (e.g. watching television) make people prone to consume soft drink and food high in saturated fat and sugar.45 A study by Salmon et al reported that people who spend a lot of time watching television are less physically active and have higher rate of metabolic syndrome. Therefore it is observed that people do not compensate the exceed energy input which results in weight gain.47
Conclusion
The results from the study revealed that, the percentage of calorie intake from soft drink is in accordance with the recommendation of the World Health Organisation and the American Heart Association. There is no association between soft drink consumption, obesity, and overweight. However, high BMI and WC are observed among women as compared to men, but these are still within the normal range. The results show that obesity, high soft drink consumption and sedentary lifestyle is more common among women. Physical activity is the main factor that influences soft drink consumption intake and BMI. The occurrence of normal BMI and WC is higher among participants who have higher physical activity level. The average daily calorie intake is within the range recommended by the USDA dietary guidelines. Therefore, the combination of average daily calorie intake and calorie obtained from SD has no significant influence on BMI. The study reports that BMI is influenced more by physical activity and is independent of calorie intake from daily intake and soft drink consumption. Demographic variables associations with SD consumption are not discussed herein but in general, there were no significant correlation found between level of education, occupation status and intake of SD consumption.
Acknowledgement
We would like to thanks the University of Mauritius for supporting this research project.
Funding
The author(s) received no financial support for the research, authorship, and/or publication of this article.
Conflict of Interest
All authors confirm herein that there is no conflict of interest including any financial, personal or other relationships with other people or organizations that can influence our work.
References
- Eluwa M.A., Inyangmme, Akpantah A.O., Ekanem T.B., Ekong M.B., Asuquo O.R, Nwakanma A.A. A Comparative Study of The Effect of Diet And Soda Carbonated Drinks on the Histology of the Cerebellum of Adult Female Albino Wistar Rats. Afr Health Sci. 2013; 13(3): 541-545.
CrossRef - Basu S., Martin M., Gauden G., David S.Relationship of Soft Drink Consumption to Global Overweight, Obesity, and Diabetes: A Cross-National Analysis of 75 Countries. Am J Public Health. 2013;103(11): 2071-2077.
CrossRef - Malik V.S., Frank H. Sweeteners and Risk of Obesity and Type 2 Diabetes:The Role of Sugar-Sweetened Beverages. Curr Diab Rep. 2012; 12(196).
CrossRef - Bleich S.N.,Wang Y.C.,Wang Y., Gortmaker S.L. Increasing Consumption of Sugar-Sweetened Beverages Among US Adults: 1988–1994 to 1999–2004. Am J Clin Nutr.2009; 89(1):372-381.
CrossRef - World Health organisation. WHO urges global action to curtail consumption and health impacts of sugary drinks. World Health Organisation; 2016.
- Hashem K.M., He F.J., Jenner K.H., Macgregor G.A. Cross-Sectional Survey of the Amount of Free Sugars And Calories in Carbonated Sugar-Sweetened Beverages on Sale in the UK. BMJ Open. 2016;6(11).
CrossRef - Vartanian L.R., Schwartz M.B., Brownell K.D. Effects of Soft Drink Consumption on Nutrition and Health: A Systematic Review and Meta-Analysis. Am J Public Health. 2007;97(4):667-675.
CrossRef - Bray G.A.Soft drink consumption and obesity: it is all about fructose. Curr Opin Lipidol. 2010; 21:51-57.
CrossRef - Gibson S.Sugar-Sweetened Soft Drinks And Obesity: A Systematic Review of the Evidence from Observational Studies And Interventions. Nutr Res Rev. 2008; 21:134-147.
CrossRef - Johnson R.K., Appel L.J., Brands M., Howard B.V., Lefevre M., Lustig R.H., Sacks F., Steffen L.M., Wylie R., Judith. Dietary Sugars Intake and Cardiovascular Health. Circulation. 2009; 120(11):1011-1020.
CrossRef - Schulze M.B., Manson-JELudwig D.S., Colditz G.A., Stampfer M.J., Willett W.C., Hu F.B. Sugar-Sweetened Beverages, Weight Gain, And Incidence of Type 2 Diabetes in Young And Middle-Aged Women. 2004;292(8):927-934.
CrossRef - Centers for Disease Control and Prevention. Physical Activity and Health. 2018. https://www.cdc.gov/physicalactivity/basics/pa-health/index.htm.
- Trumbo P.R, Rivers C. Systematic Review of the Evidence for an Association Between Sugar-Sweetened Beverage Consumption and Risk of Obesity. Nutr Res.2014; 72(9): 566-579.
CrossRef - Woodward-Lopez G.,Kao J.,Ritchie L.,Robert C.,Atkins V. To What Extent Have Sweetened Beverages Contributed to the Obesity Epidemic? Public HealthNutr.2010;14(3):499-509.
CrossRef - Bhurosy T., Jeewon R. Changes in Eating Habits And Food Traditions of Indo-Mauritians. IJTK. 2016;15(3):355-362.
- Bhurosy T., Jeewon R. Food Habits, Socioeconomic Status And Body Mass Index Among Pre-Menoupausal And Post-Menoupausal Women in Mauritius. J Hum Nutr Diet. 2013; 26(Suppl. 1):114-122.
CrossRef - Jodhun B., Pem D., Jeewon R. A Systematic Reviews of Factors Affecting Energy Intake of Adolescent Girls. Afri Health Sci.2016; 16(4): 910-922.
CrossRef - Dunneram Y., Jeewon R. A Scientific Assessment of Socio-Demographic Factors, Physical Activity Level And Nutritional Knowledge As Determinants of Dietary Quality Among Indo-Mauritian women. J Nutr Metab. 2013; 2013: 9 pages.
CrossRef - Fokeena W.B., Jeewon R. 2012. Is There an Association between Socioeconomic Status and Body Mass Index among Adolescents in Mauritius? World J. 2012;2012.
CrossRef - Bhurosy T,. Jeewon R. Effectiveness of a Theory-Driven Nutritional Education Program in Improving Calcium Intake among Older Mauritian Adults. World J. 2013.
CrossRef - Bhurosy T., Jeewon R. Overweight and Obesity Epidemic in Developing Countries: A Problem with Diet, Physical Activity, or Socioeconomic Status? World J. 2014;2014:1-7.
CrossRef - Cannoosamy K., Pem D., Bhagwant S., Jeewon R. Is a Nutrition Education Intervention Associated with a Higher Intake of Fruit and Vegetables and Improved Nutritional Knowledge among Housewives in Mauritius? 2016;8:723.
CrossRef - Pem D., Bhagwant S., Jeewon R. A Pre and Post Survey to Determine Effectiveness of a Dietitian-Based Nutrition Education Strategy on Fruit and Vegetable Intake and Energy Intake among Mauritian adults. 2016;8:127.
CrossRef - Bhurtun D., Jeewon R. Body weight perception and weight control practices among teenagers. ISRN Nutrition.
- Dunneram Y., Jeewon R. Determinants of Eating Habits Among Older Adults. PROG NUTR. 2015;17:274-283.
- Dunneram Y., Ramasawmy D., Pugo-Gunsam P., Jeewon R. Determinants of Eating Habits among Pre-Retired and Post-Retired Mauritians. Int J FoodSci Nutr. 2013;2(3):109-115.
CrossRef - Hurree N., Pem D., Suress B., Jeewon R. A Pilot Study To Investigate Energy Intake And Food Frequency Among Middle Aged And Elderly People in Mauritius. Med J Nutrition Metab. 2017;10(1):1-17.
CrossRef - Bundhun D., Rampadarath S., Puchooa D., Jeewon R. Dietary Intake And Lifestyle Behaviors of Children in Mauritius. Heliyon. 2018;4(2):e00546.
CrossRef - Food and Agriculture Organization. Report of a Joint FAO/WHO/UNU Expert Consultation. Rome. FAO FOOD AND NUTRITION TECHNICAL REPORT SERIES. p38.
- Bes-Rastrollo M., Sanchez-Villega A.S., Gomez-Gracia E., Martínez J.A., Pajares R.M., Martínez-Gonzalez M. Predictors of Weight gain in a Mediterranean Cohort: the Seguimiento Universidad de Navarra Study. Clin Nutr. 2006;83(2):362-370.
CrossRef - Liebman M., Pelican S., Moore S.A., Holmes B., Wardlaw M.K., Melcher L.M., Liddil A.C., Paul L.C., Dunnagan T., Haynes G.W. Dietary Intake, Eating Behavior, And Physical Activity Related Determinants Of High Body Mass Index in Rural Communities in Wyoming, Montana, and Idaho. Int J Pediatr Obes. 2003;27:687.
CrossRef - Rombaldi A.J., Neutzling M.B., Silva M.C., Azevedo M.R., Hallal P.C. Factors Associated with Regular Non-Diet Soft Drink Intake Among Adults in Pelotas, Southern Brazil. Rev Saude Publica. 2011;45(2):1-8.
CrossRef - Kvaavik E., Andersen L.F., Knut-Inge K. The Stability of Soft Drinks Intake from Adolescence to Adult Age And the Association Between Long-Term Consumption of Soft Drinks And Lifestyle Factors And Body Weight. Public HealthNutr. 2004;2(8):152.
CrossRef - Rehm C.D., Matte T.D., Wye G.V., Young C., Frieden T.R.Demographic and Behavioral Factors Associated with Daily Sugar-sweetened Soda Consumption in New York City Adults. Bull N Y Acad Med,J Urban Health. 2008;85(3):375-385.
CrossRef - Jiantao M., McKeown N.M., Hwang S., Hoffmann U., Jacques P.F., Fox C.S.Sugar-Sweetened Beverage Consumption Is Associated With Change of Visceral Adipose Tissue Over 6 Years of Follow-Up. 2016;133(4):370-377.
CrossRef - Funtikova A.N., Subirana I., Gomez S.F., Fito M., Elosua R., Benıtez-Arciniega A.A., Schröder H. Soft Drink Consumption Is Positively Associated with Increased Waist Circumference and 10-Year Incidence of Abdominal Obesity in Spanish Adults. J Nutr. 2015:328.
CrossRef - Kessaram T., McKenzie J., Girin N., Roth A., Vivili P., Williams G., Hoy D. Non-communicable diseases and risk factors in adult populations of several Pacific Islands: results from the WHO STEPwise approach to surveillance. Int J Public Health.
2015;39(4):336-343.
CrossRef - Cleland V., Schmidt M.D., Dwyer T., Venn A.J. Television Viewing And Abdominal Obesity in Young Adults: Is The Association Mediated by Food And Beverage Consumption During Viewing Time or Reduced Leisure-Time Physical Activity? Am J Clin Nutr. 2008;87(5):1148-1155.
CrossRef - United States Department of Agriculture .Dietary Guidelines for Americans. Washington, DC: U.S Government. 2010.
- NATIONAL CENTER FOR HEALTH STATISTICS (NCHS). NCHS Nutrition Data.
- World Health Organization. Noncommunicable Diseases (NCD) Country Profiles. Mauritius. 2015. URL: http://www.who.int/nmh/countries/mus_en.pdf
- Dennis E.A., Flack K.D., Davy B,M. Beverage Consumption and Adult Weight Management, A Review. Eating Behaviours. 2009;10(4):237-246.
CrossRef - DiMeglio D.P.,Mattes R.D. Liquid Versus Solid Carbohydrate: Effects on Food Intake And Body Weight. Int J Obes. 2000; 24:794-800.
CrossRef - Bleich S.N., Wolfson J.A., Vine S., Wang C.Y. Diet-Beverage Consumption and Caloric Intake Among US Adults, Overall and by Body Weight. Am J Public Health. 2014;104(3):e72-e78.
CrossRef - Stein C.J., Colditz G.A. 2004. The Epidemic of Obesity. J Clin Endocrinol Metab. 2004;89(6):2522–2525.
CrossRef - Ford E.S., Kohl H.W., Mokdad A.H., Ajani U.A. Sedentary Behavior, Physical Activity, and the Metabolic Syndrome among U.S. Adults. Obesity. 2012;13(3):611.
CrossRef - Salmon J.,Bauman A.,Crawford D.,Timperio A., Owen N.The Association Between Television Viewing And Overweight Among Australian Adults Participating in Varying Levels of Leisure-Time Physical Activity. Int J Obes. 2000;24:600-606.
CrossRef
Accepted on: 22/10/2019
Second Review by: Dr. Agugo Udodiri A Nigeria
Final Approval by: Prof. Min-Hsiung Pan


Web of Science Coverage
Emerging Sources Citation Index (ESCI)
2024 Journal Impact Factor: 1.1
Scopus Journal Metrics
CiteScore 2025: 2.6
CiteScore Details
Sustainable Nutrition: Food Systems, Nutrient Retention, and Public Health Impact
![]()
This journal is a member of, and subscribes to the principles of, the Committee on Publication Ethics (COPE)


