
Introduction
White jack bean (Canavalia ensiformis) is plant species in the legume family grown in the dry tropical regions but now has spreaded to the wet tropic region.1 Murdiati2 stated that white jack bean is rich of protein (32,32%), carbohydrate (61,15%) and starch (34,73%). White jack bean usually utilized as a source of protein isolate. The extraction of protein isolate often leaves enough residues containing complex carbohydrates, such as starch, dietary fiber (soluble fiber and insoluble fiber) and resistant starch.
Complex carbohydrates contained in the extraction residues of protein isolate can be utilized as a source of dietary fiber and resistant starch. To optimize its utilization, it is necessary to apply a treatment that potentially increase the soluble fiber and resistant starch content. One of alternatives is by applying autoclaving-cooling cycles. The increase of soluble fiber and resistant starch content is expected to contribute an added values for the utilization of white jack bean residue.
Autoclaving or sterilization produced Insoluble Dietary Fiber (IDF) decreased and Soluble Dietary Fiber (SDF) increases. Research results of Benitez3 revealed that onion var. Figuerres bulb skin paste which treated with autoclaving treatment at 115° C for 17-31 minutes decreased the IDF content from 24,2 % to 16,8% and increased the SDF content from 4,5% to 8%. The SDF : IDF ratio increased from 1:5 to 1:2. The research conducted by Harding4 on wheat husks treated autoclaving at 121oC for 15 minutes at a pressure of 20 psi showed soluble fiber enhancement up to 3.2 times.
Autoclaving-cooling treatment of starch could be used to enhance resistant starch content by gelatinization and retrogradation activity.5 Similar observations were reported by Dundar6 for the autoclaving-cooling cycle on HACS (High Amylose Corn Starch) resistant starch, showed that autoclaving at 145oC followed by 72-hours-cooling resulted the highest resistant starch content up to 30.14%.
During gelatinization the starch granules expandand amylose and amylopectin released into the water. Retrogradation follows the gelatinization step where amylose and amylopectine form crystalline structure contributing the formation of resistant starch.7 A repeated autoclaving-cooling process can enhance the resistant starch content.5
The use of autoclave can weaken the nutritional value. Autoclaving – cooling can increase the resistant starch content, however, repeated cycles of can break down the soluble fiber content,8 therefore it needs to be studied how much cycles needed to produce the highest total soluble fiber and resistant starch content.
This study was aimed to determine changes of dietary fiber and resistant starch content of the white jack bean residue after the protein extraction due to autoclaving-cooling cycles. The residue was characterized for the chemical composition and functional properties.
Materials and Methods
Dried white jack bean seeds were used as a primary material in this research that were purchased from Selopura village, Wonogiri district, Central Java, Indonesia. Chemicals used in this experiment were NaOH (Merck), hexane (technical), HCl (Merck), ethanol (Merck), α-amylase (Sigma-Aldrich Co., LLC), amyloglucosidase (Sigma-Aldrich Co., LLC), pancreatin (Sigma-Aldrich Co., LLC), celite (Megazyme International Ireland, Ltd.), cholic acid (Sigma-Aldrich Co., LLC), deoxycholic acid (Sigma-Aldrich Co., LLC), and Termamyl (Novo Industry USA).
Preparation of complex carbohydrates flour of white jack bean
Preparation of complex carbohydrates flour of white jack bean seeds was initiated by removal of protein content as Betancur9 method with modification on defatting process before deproteination. White jack bean seeds were immersed in water in a ratio of 1:3 (w/v) for 12 hours, then their outer skins were removed, soaked again for 3 x 12 hours, washed, drained and ground. The resulting grind was dried in a cabinet dryer at 55oC for 16 hours, ground and then sifted through 60 mesh sieve.
The defatting was conducted by using hexane solvent in a ratio of 1:3 (w/v), stirring for 30 minutes, centrifuging for 15 minutes, removing hexane and aeratng for 16 hours at room temperature. The deproteination was carried out by immersing the material into 0.1 N NaOH solution at pH 12 twice, then the complex carbohydrates were washed with HCl solution in a ratio of 1:3 (w/v) until the pH returned to 7. Subsequently, it was separated by centrifuging it for 10 minutes at 3,500 rpm. The resulting product was cleansed to remove the residue, dried at 55oC, ground, and sifted through 60 mesh sieve.
Autoclaving – Cooling Treatment
The complex carbohydrates flour of white jack bean was diluted in water in a ratio of 1:4 (w/v) followed by heating up to 90oC for 5 minutes. The solution was autoclaved at 121oC for 15 minutes, cooled to room temperature and then cooled at 4° C for 24 hours. This treatment was repeated five times. The resulted flour of each cycle was dried in the cabinet dryer at 55oC for 18 hours, milled, and sifted through 60 mesh sieve.
Determination of Dietary Fiber
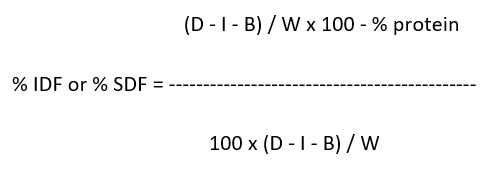
Determination of dietary fiber content was performed according to Asp.10 One g sample was weighed and inserted into a 5 ml centrifuge tube. Sodium phosphate (25 ml, 0.1 M, pH 6.0) was added and the samples were precipitated. After that, termamyl (100 μL) was added, then the tube was incubated in a water bath shaker at 100° C for 15 minutes with a constant shaking. After cooling the tube, 20 ml of aquadest was added and the pH was converted to 1.5 by 4 M HCl. After that 100 mg of pepsin were added, then incubated in a 40o C water bath shaker for 60 minutes with a constant shaking. After cooling the tube, 20 ml of aquadest was added and the pH was converted to 6.8 with 4 M NaOH. Lastly, 100 mg of pancreatin was added, and then the tube was incubated in water bath shaker at 40o C for 60 minutes. The pH was converted to 4.5 with HCl, then the solution was filtered through a dry and weighted crucible (P2) containing 0.5 g celite and then washed with 2 x 10 ml aquadest.
The residue (insoluble fiber / IDF) was washed with 2 x 10 ml of 94% ethanol and 2 x 10 ml of acetone, dried at 105o C overnight, then weighed and kept in an oven at 550o C overnight. The soluble fiber (SDF) was obtained by adding 400 ml of 94% warm ethanol (60o C) to the filtrate, and the precipitate was allowed to be formed for an hour. The solution was filtered, then washed with 2 x 10 ml of 78%, 94% ethanol, and 2 x 10 ml of acetone. The precipitate (SDF) was dried at 105o C overnight, then weighed and ashed as for the IDF. The blank value was obtained by not using any sample. Protein value was corrected by determining the nitrogen content, fraction of dietary fiber and blank with Kjeldahl method and converting to protein (x 6.25). IDF and SDF were calculated by the following formula:
D = weight (g) after drying on fiber determination
I = weight (g) after incineration
B = weight (g) ash-free blank
W = sample weight (g)
% Protein = 9.0 for IDF and 7.5 for SDF
Determination of Resistant Starch
Determination of resistant starch content was performed according to procedure of.11 A 100 mg flour sample was inserted into a centrifuge tube, 10 mL of KCl-HCl buffer pH 1.5 was added and then vortexed. After that, 0.2 mL of pepsin solution (1 g pepsin / 10 mL buffer KCl – HCl) was added and then vortexed. The tubes were incubated in water bath shaker at 40o C for 60 minutes with a constant shaking, and then kept at room temperature. A 9 mL of 0.1 M Tris maleate buffer (pH 6.9) was added, and then 1 mL of α-amylase solution (40 mg α-amylase per mL Tris maleate buffer) was added. The tube was incubated for 16 hours in a water bath shaker at 37o C with a constant shaking, continued with centrifugation 3000 g for 15 minutes, and then the supernatant was discarded. After that, it was washed with 10 mL of distilled water, centrifuged, and the supernatant discarded. 3 mL of aquadest was added and followed by 3 mL of KOH 4M. The tube was put in a water bath shaker at room temperature for 30 minutes with a constant shaking. Later, 5.5 mL of 2 M HCl was added and followed by 3 mL of 0.4 M sodium acetate buffer (pH 4.75).
80 μL of amyloglucosidase was added, mixed in the tube and left 45 minutes in a water bath shaker at 60o C with a constant shaking. It was centrifuged at 3,000g for 15 minutes. The supernatant removed and stored in a tube. The residue was washed with 10 mL aquadest and then centrifuged again. The supernatant was collected, the aquadest was added up to 50 mL. The standard curve of glucose solution (10 – 60 ppm) was prepared from the GOD-POD kit. All 0.5 mL water, sample, and the standard were added into the tube. Then, 1 mL of reagent from GOD PAP kit was added. The tube was mixed in a water bath shaker at 37o C for 30 minutes. The absorbance value at 500 nm was read against the blank (5 mins after incubation) and then it was calculated using a standard curve. Resistant starch was mg glucose x 0.9.
Determination of Total Phenolic Content
The Folin-ciocalteu method was used for determination of total phenolic content12 using Folin-ciocalteu reagents. 120 μL of extracts were added immediately to 600 μL of Folin-ciocalteu reagents of fresh dilution for 10 times. 960 μL of sodium carbonate (75 g/L) solution was added to the mixture after 2 minutes of reaction. The blue color showed was measured at λ = 760 nm against the blank after the reaction lasted for 5 minutes at 50 °C. Ergic acid (AG) was used as a standard and TPC was expressed as μg equivalent AG (EAG) per g of the material.
Chemical Composition
Chemical composition analysis (moisture content, ash content, protein content, fat content) was performed based on AOAC.13
Water Holding Capacity (WHC)
WHC was determined according to Chau14 methods with a slight modification. One g sample was soaked into 10 mL of water in a tube for 24 hours at room temperature. After 24 hours, the sample was centrifuged (2500g, 30 min) and then the supernatant was transferred into a 10 mL volume tube, where the final volume was measured. WHC was measured as milliliter of water retained by one gram of dry sample.
Oil Holding Capacity (OHC)
OHC was determined according to Chau14 method with a modification. One g sample mixed with vegetable oil 1:10 (w / v). The mixture was stirred for 30 minutes at room temperature. After that, the sample was centrifuged (2500g, 30 min) and the supernatant was transferred into a 10 mL volume tube, where the volume was measured. OHC was shown as milliliter of vegetable oil retained by one gram of dry sample.
Swelling Capacity (SC)
SC was determined according to Robertson.15 100 mg of sample was hydrated in water at 10 mL volume in volume tube at room temperature. After equilibration (18 hours), mattress volume was recorded and SC was indicated as the volume (mL) used by the sample per gram of the initial dry weight sample.
Cation Exchange Capacity (CEC)
CEC was determined according to Jimenez.16 0.5 g of dried waste product sample was dissolved in 25 mL of 2 N hydrochloric acid. After 24 hours of continuous stirring, the suspension was centrifuged for 15 minutes at 2500g. The residue was washed several times with water until the supernatant pH was above 4. The acid residue was dissolved in 25 mL of 0.3 M sodium chloride together with the blanks with water, and after stirring and centrifugation, the supernatant was titrated with 0.01 N sodium hydroxide. The CEC was shown as a dry weight meq / g.
Microscopic Images
Microscopic images were taken using Scanning Electron Microscopy / SEM according to Chen.17 Samples were prepared according to Jinglin.18 The sample was dissolved in the acetone to obtain a 1% suspension. A drop of sample – acetone suspension was dropped on the microscope slide. After the acetone was evaporated, the sample was coated by gold flour. Samples were placed on a specimen holder with double-sided scotch tape and sputter-coated with gold (5 mins, 2 mbar). Then each sample was transferred to SEM at 20 kV acceleration voltage, 2000x and 10,000x magnification.
Experimental Design
Triplicate determinations were performed for each test for calculation of average and standard derivation. A one-way analysis of variance was used to subject the data according to Completely Randomized Design used in this study. Duncan’s Multiple Range Test was applied to determine significant differences among 5 treatment means at the 5% significance level. The obtained data were statistically analyzed using SPSS version 23.0.
Results
Table 1: Levels of soluble fiber, insoluble fiber and total dietary fiber in complex carbohydrates of white jack bean in response to autoclaving-cooling cycles*
| Autoclaving–Cooling Cycles | Soluble Fiber (% d.b.) | Insoluble Fiber (% d.b.) | Total Dietary Fiber (% d.b.) |
| 0 | 14.13 ± 0.03a | 14.64 ± 0.02d | 28.76 ± 0.08a |
| 1 | 15.00 ± 0.02b | 13.95 ± 0.03c | 28.95 ± 0.05a |
| 2 | 15.67 ± 0.03c | 13.18 ± 0.03b | 28.85 ± 0.04a |
| 3 | 16.24 ± 0.01d | 12.53 ± 0.01a | 28.77 ± 0.07a |
| 4 | 16.27 ± 0.03d | 12.51 ± 0.01a | 28.78 ± 0.02a |
| 5 | 16.29 ± 0.01d | 12.49 ± 0.01a | 28.78 ± 0.03a |
*all values were means of triplicate determinations ± standard deviation; means within columns with different letter were significantly different (P<0.05).
Table 2: Changes in resistant starch content, total soluble fiber and resistant starch content, and total phenolic content of complex carbohydrates flour of white jack bean in response to autoclaving-cooling cycles*
| Autoclaving–Cooling Cycles | Resistant Starch (% d.b.) | Total Soluble Fiber and Resistant Starch (% d.b.) | Total Phenolic (%d.b.) |
| 0 | 14.12 ± 0.02a | 28.24 ± 0.02a | 6.05 ± 0,21a |
| 1 | 16.68 ± 0.01b | 31.68 ± 0.02b | 9.66 ± 0,22b |
| 2 | 16.68 ± 0.01b | 32.36 ± 0.03c | 13.74 ± 0,21c |
| 3 | 16.71 ± 0.02b | 32.95 ± 0.03d | 15.87 ± 0,20d |
| 4 | 16.70 ± 0.01b | 32.96 ± 0.01d | 17.10 ± 0,21e |
| 5 | 16.68 ± 0.01b | 32.97 ± 0.01d | 18.22 ± 0,20f |
*all values were means of triplicate determinations ± standard deviation; means with different letter were significantly different (P<0.05).
Table 3: Chemical composition of complex carbohydrates flour of white jack bean compared to that of treated with autoclaving-cooling cycles of 3 times*
| Chemical composition(% d.b) | White Jackbean Complex Carbohydrate Flour | White Jackbean Complex Carbohydrate Flour treated with autoclaving-cooling cycles of 3 times |
| Moisture (% w.b) | 10.73 ± 0.43a | 10.68 ± 0.43a |
| Ash | 1.20 ± 0.15a | 0.92 ± 0.04b |
| Fat | 0.02 ± 0.00a | 0.02 ± 0.00a |
| Protein | 2.27 ± 0.01a | 1.85 ± 0.07b |
| Carbohydrate (by difference) | 96.51 ± 0.14a | 97.20 ± 0.08b |
| Starch | 68.67 ± 0.12a | 68.42 ± 0.39a |
| Resistant starch | 14.15 ± 0.07a | 16.88 ± 0.15b |
| Soluble fiber | 14.30 ± 0.07a | 16.25 ± 0.17b |
| Insoluble fiber | 14.54 ± 0.22a | 12.33 ± 0.12b |
| Total dietary fiber | 28.84 ± 0.18a | 28.58 ± 0.17a |
| HCN (ppm) | 3.35 ± 0.53a | 14.90 ± 1.05b |
*all values were means of triplicate determinations ± standard deviation; means within rows with different letter were significantly different (P<0.05).
Table 6: The functional properties of complex carbohydrates of white jack bean compared to that of treated with autoclaving-cooling cycles of 3 times*
| Functional properties | White jack bean complex carbohydrates | White jack bean complex carbohydrates treated with autoclaving-cooling cycles of 3 times |
| Water Holding Capacity / WHC (%) | 232 ± 2a | 352 ± 2b |
| Oil Holding Capacity / OHC (%) | 106 ± 2a | 116 ± 1b |
| Swelling Capacity / SC (%) | 327 ± 2a | 775 ± 1b |
| Cation Exchange Capacity / CEC (meq/kg) | 29 ± 1a | 85 ± 0b |
*all values were means of triplicate determinations ± standard deviation; means within rows with different letter were significantly different (P<0.05).
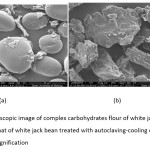 |
Figure 1: Microscopic image of complex carbohydrates flour of white jack bean (a) compared to that of white jack bean treated with autoclaving-cooling cycles of 3 times (b) on 500x magnification Click here to View figure |
Discussions
Dietary Fiber
Levels of soluble fiber, insoluble fiber and total dietary fiber in complex carbohydrates of white jack bean in response to autoclaving-cooling cycles were shown in Table 1. The result of this research showed that three cycles of autoclaving-cooling treatment increased the soluble fiber content mean of complex carbohydrates flour of white jack bean (Table 1) from 14.13% to 16.24%. The autoclaving process caused breakdown of glycosidic bonds in the dietary fiber so that the components of soluble fiber attached to the insoluble fiber was detached and counted as the soluble fiber.3 The insoluble fiber content of complex carbohydrates flour of white jack bean decreased as the autoclaving-cooling cycles increased. The insoluble fiber content mean decreased until the third cycle (from 14.6% to 12.5%).
Insoluble fiber content could decrease by the autoclaving process due to some insoluble fiber components were degraded or broken down into simple carbohydrates. Benitez3 stated that onion bulb skin treated with autoclaving at 115oC for 17 minutes decreased the insoluble fiber content because part of insoluble fiber such as uronic acid was released, while cellulose was damaged.
The increase of soluble fiber content was due to the breaking of the bond between phenolic component and dietary fiber so that the soluble fiber content that was released became analyzed. According to Duenas,19 heating might increase soluble fiber content and total phenolic content. This was happened because autoclaving could break the bond between phenol and dietary fiber so that the free phenolic content and soluble fiber content increased.
Other research had also shown the effect of autoclaving-cooling cycle treatment which resulted the increase of soluble fiber and the decrease of insoluble fiber. Redondo20 examined the effect of autoclaving at 121°C for 15 minutes at turnip (Brassica napus). The results showed that there was an increase in soluble fiber content from 0.578 g / 100 g to 0.852 g / 100 g.
Resistant Starch
The result of this research showed that autoclaving-cooling treatment could increased the resistant starch content. Changes in resistant starch content of complex carbohydrates flour of white jack bean in response to autoclaving-cooling cycles were shown in Table 2. The resistant starch content mean of white jack bean complex carbohydrates increased in the first cycle of autoclaving-cooling (14.12% to 16.68%). After the first cycle, the resistant starch content were not significantly different compared to other cycles.
Autoclaving-cooling cycles could increase resistant starch content. Niba21 studied about the effect of autoclaving-cooling cycles for 7 days of corn bread. The resistant starch content increased from 3.07 g/100 g (not stored) to 5.73 g/100 g (2 days stored) and 5.83 g/100 g (4 days stored) and after 7 days the resistant starch content decreased 2.50 g/100 g. Dundar6 studied about autoclaving-cooling cycle at 4oC for 24, 48, and 72 hours of HACS resistant starch content. Autoclaving-cooling cycle for 72 hours resulted the highest resistant starch (30.14%). Similarly, research on corn starch treated with 1 cycle of autoclaving-cooling yielded resistant starch content of 4.10%, 3 cycles yielded 8.50% and 6 cycles yielded 11.20%.22 Whereas the research on modified cassava flour treated with 1 cycle of autoclaving-cooling yielded resistant starch content of 4.20%, 2 cycles yielded 6.30%, and 3 cycles yielded 8.70%.23
Resistant starch could be formed by autoclaving-cooling cycle treatment. The starch dissolved in water and then autoclaved caused the starch underwent gelatinization, that was the discharge of amylose from starch granules. Furthermore, the autoclaved starch paste was stored at 4oC so that it caused retrogradation on amylose. The activity of gelatinization and retrogradation cycles led to the increase levels of resistant starch.24
The best treatment in this study was chosen according to the one resulted the highest total soluble fiber and resistant starch. It was due to its high benefit for health. The third autoclaving-cooling cycle produced the highest total soluble fiber and resistant starch content as high as 32.95%. Changes in total soluble fiber and resistant starch content of complex carbohydrates flour of white jack bean in response to autoclaving-cooling cycles were shown in Table 2.
Total Phenolic Content
Autoclaving-cooling cycles could increase the total phenolic content. Changes in total phenolic content of white jack bean complex carbohydrates in response to autoclaving-cooling cycles were shown in Table 2. Autoclaving-cooling cycles could increase the total phenolic content mean of complex carbohydrates of white jack bean from 6.05% to 18.22%. The results of this study were in line with the results of Duenas19 that studied the effect of autoclaving treatment on the total phenolic bound to dietary fiber. They reported an increase in total phenolic due to autoclaving process. Similarly, the research of Jambrec25 on the influence of autoclaving on wheat phenolic compounds proves that autoclaving could increase phenolic compounds from 48-57% to 61-75%.
Phenolic compounds can bind to dietary fiber. Nutrients such as carbohydrates can trap polyphenols.26 The bonds among polyphenols and carbohydrates were a hydrogen bond.27 Autoclaving treatment damaged the peel and seed tissue so that phenolic compounds bounded to the cell wall were released.28
Autoclaving treatment could hydrolyze bonds between phenolic compounds with polysaccharides. It was explained by West,29 that the pressurized heating treatment disconnected the bonds that bind phenolic acid to arabinoxylan in the bran, turned it into a more extractable form. As a result, it increased the total phenolic content.
Chemical Composition
The chemical composition of complex carbohydrates flour of white jack bean could change because of autoclaving – cooling treatment. The chemical composition of complex carbohydrates flour of white jack bean compared to that of treated with autoclaving-cooling cycles of 3 times were shown in Table 3. The water content and fat content mean was not significantly different, while the ash content mean decreased from 1.20% to 0.92% and the protein content mean decreased from 2.27% to 1.85%. This was due to the dissolution of components so that the levels of those properties decreased. Carbohydrate content (by difference) mean increased from 96.51% to 97.20% due to the decrease in ash and protein content. Resistant starch content mean increased from 14.15% to 16.88%, while soluble fiber mean increased from 14.30% to 16.25%, and insoluble fiber mean decreased from 14.54% to 12.33% due to 3 cycles autoclaving – cooling treatment.
Starch content mean was not significantly different, while HCN levels mean increased from 3.35 ppm to 14.9 ppm. It was due to the release and activation of HCN occurred during the autoclaving-cooling process so that the level increased. Heat treatment at 72° C might damage the linamarase enzyme, but might not damage the glucoside.30 mentioned that warming caused most of HCNs to escape. This resulted the increase of HCN levels. However, HCN levels were still within safe limit because they were below 50 ppm.
Functional Properties
The increased ability of complex carbohydrates of white jack bean in water holding capacity (WHC), oil holding capacity (OHC), swelling capacity (SC) and cation exchange capacity (CEC) were happened because of autoclaving-cooling cycles treatment on complex carbohydrates of white jack bean. The functional properties of complex carbohydrates of white jack bean compared to that of treated with autoclaving-cooling cycles of 3 times were shown in Table 4.
Ashwar31 found that the ability of WHC increased was due to two times autoclaving in rice (0.98 g/g to 1.87 g/g) and the ability of OHC increased from 0.88 g/g to 1.05 g/g (Table 6). Similarly, Dundar6 studied the effect of the autoclaving-cooling process on corn flour, found that the autoclaved-cooled corn flour had two-fold solubility and oil-binding capacity than the natural corn flour.
The hydration properties (water holding capacity and swelling capacity) could affect the ability of dietary fiber to be bound to foodstuff.3 The main factors affected the swelling capacity (SC) and water holding capacity (WHC) were polysaccharide compositions and intermolecular organizations of polysaccharides.33 Some physical properties such as particle size, porosity, and density affected the hydration properties of dietary fiber.3 The smaller particle size would reduce the ability of dietary fiber to bind water or organic molecules.34 The autoclaving-cooling treatment caused the fiber particle size to increase in size as well as increased the ability of WHC, OHC and SC.
Viscosity mean of complex carbohydrates of white jack bean treated with autoclaving-cooling cycle (176 cP) was smaller than white jack bean complex carbohydrates (3,810.33 cP). This was due to resistant starch properties which was easily dissolved when heated. As a result, the viscosity decreased. According to Marsono,35 starch treated with autoclaving-cooling would decrease viscosity. The decrease in viscosity value could be marked by the damage of starch granules and then it become easily soluble. It resulted in a decrease in starch swelling capacity and viscosity.36
Morphological Properties
The complex carbohydrates of white jack bean treated with autoclaving-cooling cycles of 3 times had a microscopic structure that was more porous and hollower so that it could bind more water, oil, and cation than that of white jack bean without autoclaving-cooling cycle. This was in line with Chen17 that stated that polysaccharides treated with high temperature and pressure could change their structure to be hollower and thus affected the water-binding ability of the fibers. Microscopic images of complex carbohydrates flour of white jack bean compared to that of white jack bean treated with autoclaving-cooling cycles of 3 times flour at 500x magnification were shown in Figure 1.
The result of Al-Sheraji36 research informed that polysaccharides treated with high temperature and pressure changed their structure into more cavities in order to bind water molecules through hydrogen bonds. As a result, there was an increase in water holding capacity (WHC) and swelling capacity (SC).
Changes also occurred in the particle size of complex carbohydrates of white jack bean treated with autoclaving-cooling cycles of 3 times. The complex carbohydrates of white jack bean treated with autoclaving-cooling cycles of 3 times particles became greater in size, leading to the increased ability of WHC, OHC, and SC.34
Three cycles of autoclaving-cooling was capable of producing the highest total soluble fiber and resistant starch content. Meanwhile, the complex carbohydrates of white jack bean with autoclaving-cooling cycles relatively had the similar chemical characteristics mean with the complex carbohydrates of white jack bean, such as 10.68% moisture content, 0.92% ash content, 0.02% fat content, 1.85% protein content, 97.20% carbohydrate content (by difference), and 68.42% starch content. In response to heating process, more of HCNs were activated and consequently, HCN levels mean became higher (14.90 ppm). The complex carbohydrates flour of white jack bean treated with 3 cycles autoclaving – cooling produced higher WHC, OHC and SC value than that of untreated white jack bean.
Acknowledgements
The authors thank LPPM UGM (Research and Community Service Institute of Gadjah Mada University) for financially funding the research through Research Fund of Penelitian Unggulan Perguruan Tinggi (Superior Colleges Research) in the year 2015 (number 79/LPPM/2015) and 2016 (number 790/UN1-P.III/LT/DIT-LIT/2016) on behalf of Prof. Dr. Ir. Agnes Murdiati, MS.
References
- Sheahan C.M. Plant guide for jack bean (Canavalia ensiformis) USDA Natural Resources Conservation Service. Cape May Plant Materials Center. Cape May. New Jersey. 2013 http://plants.usda.gov/plantguide/pdf/pg_caen4.pdf. Accessed on August, 3rd, 2014.
- Murdiati A, Anggrahini S, Supriyanto, Alim A. Peningkatan kandungan protein mie basah dari tapioca dengan substitusi tepung koro pedang putih (Canavalia ensiformis L.) (Increased protein content of wet noodles from tapioca with substitution of white jack bean flour (Canavalia ensiformis L.). Agritech. 2015;(35):251–260.
- Benitez V, Molla E, Martin-Cabrejas M.A, Aguilera Y, Lopez-Andreu J, Esteban R.M. Effect of sterilization on dietary fiber and physicochemical properties of onion by-products. Food Chem. 2011;(127):501–507.
CrossRef - Harding S.V, Sapirstein H.D, Rideout T.C, Marinangeli C.P.F, Dona A.K.M, Jones P.J.H. Consumption of wheat bran modified by autoclaving reduces fat mass in hamsters. Eur J Nutr. 2014 (53): 793–802.
CrossRef - Sajilata M.G, Singhai R.S, Kulkarni P.R. Resistant Starch – A Review. Food Engineering and Technology Dept. Institute of Chemical Technology. Mumbai. India.2005.
- Dundar A.N, Gocmen D. Effects of autoclaving temperature and storing time on resistant starch formation and its functional and physicochemical properties. Carbohydrate Polymers. 2013 (97):764–771.
CrossRef - Estiasih T. Teknologi dan aplikasi polisakarida dalam pengolahan pangan (Technology dan application of polysaccharides in food handling). UB Press. Malang. East Java. Indonesia. 2006
- Wennberg M, Nyman M. On the possibility of using high pressure treatment to modify physico-chemical properties of dietary fibre in white cabbage (Brassica oleracea var. capitata). Inn. Food Sci. and Em. Tech. 2004;(5):171–177.
- Betancur-Ancona, D, Peraza-Mercado G, Moguel-Ordonez Y, Fuertes-Blanco S. Physicochemical Characterization of Lima Bean (Phaseolus lunatus) and Jack bean (Canavalia ensiformis) Fibrous Residues. Food Chem. 2004;84:287–295.
CrossRef - Asp N.G, Johansson C.G, Hallmer H, Siljestrom M. Rapid enzymic assay of insoluble and soluble dietary fiber. J Agric Food Chem. 1983;(31):476–482. In Hartati S, Marsono Y, Suparmo, Santoso U. Komposisi kimia serta aktivitas antioksidan ekstrak hidrofilik bekatul beberapa varietas padi (Chemical composition and antioxidant activity of rice bran hydrophilic extract of selected rice variety). Agritech. 2015;35(1):35–42.
CrossRef - Goni I, Garcia-Diz L, Manas E, Saura-Calixto F. Analysis of resistant starch: a method for foods and food products. Food Chem. 1996;56(4):445-449.
CrossRef - Slinkard K, Singleton V.L. Total phenol analysis: automation and comparison with manual methods. Am J Enol Victic. 1977;(28):49–55.
- AOAC. Official methods of analysis of AOAC international 18th ed. AOAC International, Maryland, USA. 2005.
- Chau C.F, Huang Y.L. Comparison of the chemical composition and physicochemical properties of different fibers prepared from the peel of Citrus sinensis L. cv. Liucheng. J Agr Food Chem. 2004;(51):2615–2618.
- Robertson G.I, Monredon F.D, Dysseler P, Guillon F, Amado R, Thibault J.F. Hydration properties of dietary fiber and resistant starch: An European collaborative study. LWT – Food Sci Tech. 2000; (33): 72–79.
- Jimenez A, Rodriguez R, Fernandez-Caro I, Guillen R, Fernandez-Bolanos J, Heredia A. Dietary fibre content of table olives processed under different European styles: study of physico-chemical characteristics. J Sci Food Agric. 2000; (86): 1903–1908.
CrossRef - Chen Y, Ran Y, Yin L, Zhang N. Novel blasting extrusion processing improved the physicochemical properties of soluble dietary fiber from soybean residue and in vivo evaluation. J of Food Eng. 2014;(120):1 –8.
CrossRef - Jinglin Y.J, Wang S, Fengmin J, Sun L, dan Yu J. The structure of C-type rhizoma Dioscorea starch granule revealed by acid hydrolysis method. Food Chem. 2009;113(2):585–591.
CrossRef - Duenas M, Sarmento T, Aguilera Y, Benitez V, Molla E, Esteban R.M, Martin-Cabrejas M.A. Impact of cooking and germination on phenolic composition and dietary fiber fractions in dark beans (phaseolus vulgaris L.) and lentils (lens culinaris L.). LWT – Food Sci and Tech. 2016;(66):72–78.
- Redondo A, Villaneuva M.J, Rodriguez M.D, Saco M.D. Autoclaving effects on the dietary fibre content of carrots (Daucus carrota) and turnips (Brassica napus): an evaluation of different methods. Z. Leb. Unt. Forsch A. 1997;(205):457–463.
- Niba I.L, Effect of storage period and temperature on resistant starch and beta-glucan content in cornbread. Food Chem. 2003;83(4):493–498.
CrossRef - Zhao X.H, Lin Y. The impact of coupled acid or pullulanase debranching on the formation of resistant starch from banana starch with autoclaving–cooling cycles. Eur Fo od Res Tech. 2009; 230(1):179-184.
CrossRef - Asbar R. Peningkatan pati resisten tipe III pada tepung singkong modifikasi (Mocaf) dengan perlakuan pemanasan-pendinginan berulang dan aplikasinya pada pembuatan mi kering (Improved type III resistant starch on modified cassava flour (mocaf) with recurrent heating-cooling treatment and its application on making dry noodles). Thesis. Bogor Agricultural Institute. Bogor. 2014.
- Setiarto R.H.B, Jenie B.S.L, Faridah D.N, Saskiawan I. Kajian peningkatan pati resisten yang terkandung dalam bahan pangan sebagai sumber prebiotik (Study of Increased resistant starch contained in food as prebiotic source). Jurnal Ilmu Pertanian Indonesia. 2015;20:(3):191-200.
- Jambrec D, Sakac M, Misan A, Mandic A, Pestoric M. Effect of autoclaving and cooking on phenolic compounds in buckwheat-enriched whole wheat tagliatelle”. J of Cereal Sci. 2015;(66):
1–9.
CrossRef - Jakobek L. Interactions of Polyphenols with Carbohydrates, Lipids, and Proteins. Food Chem. 2015;(175):556–567.
- Saura-Calixto F. Dietary fiber as a carrier of dietary antioxidants: an essential physiological function. J of Agric and Food Chem. 2011;59(1):43–49.
- Bringelsson S, Dimberg L.H, Kamal-Eldin A. Effect of commercial processing on levels of antioxidants in oats (Avena Sativa L.). J Agric Food Chem. 2002;(50):1890–1896.
- West R, Seetharaman K, Duizer L.M. Effect of drying profile and whole grain content on flavour and texture of pasta. J Cereal Sci. 2013;(58):82–88.
- Kalpanadevi V, Mohan V.R. Effect of processing on antinutrients and in vitro protein digestibility of the underutilized legume Vigna unguiculata (L) Walp subsp. Unguiculata. LWT – Food Sci and Tech. 2013;(51):455–461.
- Ashwar B.A, Gani A, Wani I.A, Shah A, Masoodi F.A, Dharmesh C.S. Production of resistant starch from rice by dual autoclaving-retrogradation treatment: in vitro digestibility, thermal and structural characterization. Food Hydro. 2016;(56):108–117.
- Serena A, Knudsen K.E.B. Chemical and physicochemical characterization of co-products from vegetable food and agro industries. Animal Feed Sci and Tech. 2007;(139):109–124.
- Marsono Y. Serat pangan dalam perspektif ilmu gizi (Dietary fiber in nutritional perspective). Speech inaugural Professorship at the Faculty of Agricultural Technology Gadjah Mada University. Yogyakarta. 2003.
- Eerlingen C, Jacobs H, Clauwaert W, Delcour A. Influence of annealing on the pasting properties of starches from varying botanical sources. Cereal chem. 1995;72(5):480–487.
- Marsono Y. Resistant starch : pembentukan, metabolisme dan aspek gizi – nya (Resistant starch: its formation, metabolism and nutritional aspects). Agritech. 1998;184: 29-35.
- Al-Sheraji S.H, Ismail A, Manap M.Y, Mustafa S, Yusof R.M, Hassan F.A. Functional properties and characterization of dietary fiber from Mangiferapajang Kort fruit pulp. J Agric Food Chem. 2011;59:(8):3980–3985.

This work is licensed under a Creative Commons Attribution 4.0 International License.


