Enrichment of Folate in the Papaya (Carica papaya L.) var Red Lady by using Probiotic Bacteria as Assessed by the HPLC Method and its Functional Group Modifications by the FTIR
 , Pratheepa Velumani1, Jaganmohan Rangarajan2, Vincent Hema3, Vidyalakshmi Rajagopal1*
 1Department of Food Safety and Quality Testing, National Institute of Food Technology, Entrepreneurship and Management, Thanjavur, India
2Department of Food Product Development, National Institute of Food Technology, Entrepreneurship and Management, Thanjavur, India
3Department of Food Processing Business Incubation Center, National Institute of Food Technology, Entrepreneurship and Management, Thanjavur, India
Corresponding Author Email: rvidya@iifpt.edu.in
Download this article as:
ABSTRACT:The red lady variety of papaya was used for folate production and it was locally available throughout the year. The synthesis of folate involves four favorable microbes. Leuconostoc mesenteroides and Lactobacillus acidophilus both belong to the Lactic Acid Bacteria species. The most prevalent strain of brewer’s and baker’s yeastSaccharomyces cerevisiae, and the probiotic strain Streptococcus thermophiluswere used. Three different concentrations of fruit pulp 10%, 20%, and 30% were used. All-beneficial microorganisms showed increased concentration of folic acid content in fruit pulp, even though Lactobacillus acidophilus showed a higher concentration of folic acid 2.98 mg/kg in 30% of fruit pulp compared to control. There was a significant difference observed in pH value during 24 hours of fermentation study. The initial pH was 4.96 ± 0.010, 4.80 ± 0.011 and 4.73 ± 0.005 and after 6 hours, the pH of Lactobacillus acidophilus gradually increased to 5.09 ± 0.011, 4.96 ± 0.010, and 4.84 ± 0.011 in respective of 10%, 20%, and 30% fruit pulp concentrations. There was a significant difference observed in pH value during the 24 hours of the fermentation study. The functional group changes in the fermented papaya pulp were screened for FTIR analysis.
KEYWORDS:Folate; FTIR; HPLC; Micro-Organisms; Papaya
Introduction
Papaya (Carica papaya L.) var Red lady is a tropical and climacteric fruit. Its high nutritive and medicinal properties lead to its commercial importance. Papayas are native to South Mexico and Costa Rica, and their wide range extends to Asia and America. The papaya production in India leads the world, followed by Mexico, Brazil, Nigeria, China, Indonesia, Thailand, Peru, and the Philippines.1 The ripened papaya is a rich source of vitamin A due to the presence of carotenoids. There are three forms of carotenoids identified: β-cryptoxanthin, β-carotene and lycopene. Uniquely, it is rich in vitamin C and a good source of minerals, primarily potassium, magnesium, copper, and boron. Pulpy papaya contributes not only minor nutrients but also carbohydrates: mainly sucrose, fructose, and glucose. It also provides a significant amount of folate; 100 g of pulp supplies 9–12% of the daily requirement for folate.2,3 Folate, or folic acid, is a water-soluble vitamin B9 nutrient and one of the most important nutrients during growth and pregnancy. Folate deficiency leads to adverse effects during pregnancy, mainly neural tube deficiency, low birth weight, miscarriage, prematurity, and preeclampsia.4
Since vitamin B complex is naturally soluble in water, it is lost during processing and washing. To meet the folate requirement and prevent deficiency, folate fortification and supplementation through foods have been carried out in several countries. Since 1998, folic acid supplementation has become mandatory in Canada and the USA through fortified flours to reduce the incidence of neural tube defects in newborns. The metabolism of synthetic folic acid has an adverse effect on the human body because it is not metabolized rapidly and its accumulation in the blood leads to symptoms that are similar to those of vitamin B12 (cobalamin) and can even trigger cancer.5
Synthetic folate is capable of masking vitamin B12 deficiency, but naturally produced folate from fermentation does not mask, so it is better to use food-grade microorganisms for the production of folate. Folate can be produced from several beneficial micro-organisms, mainly bacterial strains like Lactobacillus species, Lactococcus lactis species, Leuconostoc species, S. thermophilus, Bifidus species, and Propionibacterium species.6 Several lactic acid bacterial cultures are investigated in reconstituted milk, mainly Bifidobacterium longum, Lactobacillus acidophilus, Lactobacillus delbrueckii ssp. Bulgaricus and Streptococcus thermophilus.All these strains produce a noticeable amount of folate.7Baker yeast and brewer’s yeast such as Saccharomyces cerevisiae have shown an increase in folate content in foods. In order to maximize the folate content of yeast-fermented foods, it is essential to select the appropriate culture because the various strains of Saccharomyces cerevisiae differ significantly in their folate content.The traditional method of fermenting the cereal-based foods like oats, the fermented products from barley and oats shown a greater folate content, but the use of specific lactic acid bacteria and yeasts hardly indicated a higher folate content. It was discovered that yeast isolates from bran increase the amount of folate produced during the fermentation of oats.8,9
In this research, certain strains of probiotic bacteria and Lactic Acid Bacteria (LAB) were utilized, specifically Lactobacillus acidophilus, Streptococcus thermophilus, Leuconostoc mesenteroides, along with the yeast Saccharomyces cerevisiae. The main objective of this work is to estimate folic acid content in different pulp concentration and its functional group changes after the fermentation process, and as well physiochemical properties of pulp. The goal of this study to utilize the local available fruits and enrich the fruit its nutritional content through mentioned micro-organisms.
Materials and Methods
The in details materials and methods were observed in parallel work with Mango variety.10
Sample Collection
The ripened Red Lady variety of papaya was received from the local farmer Thanjavur India.The folic acid standards, HPLC-grade solvent, and culture media were purchased from Hi-Media and Sigma-Aldrich.
Sample Preparation
The Red Lady var of papaya was cultivated in around Thanjavur due its important in processing as well marketing value. The ripened papaya has 13.5°Brix. One papaya fruit from one tree was selected for the research work. There was one-week gap from the picking of papaya to sample analysis. The ripened papaya was minimally processed due to remove the inedible parts. Using colloidal ball mill pulping of fruits were achieved. For future research, the pulped fruits were stored at -4°C after being sterilized.
Microbial Growth Conditions
Lactobacillus acidophilus MTCC 10307, Leuconostoc mesenteroides MTCC 867, and Streptococcus thermophilus NCDC 459 were supplied by the MTCC (IMTECH, Chandigarh, India) from the NCDC, Dairy Microbiology Division, NDRI, India. Saccharomyces cerevisiae NCIM-3059 was supplied by NCIM and obtained from NCIM, Pune, India. The incubated time, temperature as well culture media with respect to media were mentioned.10Following the incubation period, the cultures were refrigerated for later use.
Cultures Selection for the Synthesis of Folate
The different broth with respect to micro-organisms were prepared according to the technical data. For inoculation, the prepared broth was autoclaved and allowed to cool. The loopful of LAB were cultured in LAB MRS broth and for yeast culture in potato dextrose broth, and nutrient broth was used to grow Streptococcus thermophilus. After the incubation cells were centrifuged and washed to collect the pellets.
Quantification of Pulp for Fermentation
The papaya pulp concentrations of 10 g, 20 g, and 30 g were used for production of folate. This pulp concentration selected based on FSSAI standards for beverages. For each concentration of pulp 10ml of culture were added it contains 108–1010 cfu/ml. Each cultured pulp was incubated at particular temperature and time as well to achieving the uniformity it was incubated in shaker incubator at speed of 120 rpm. The incubated cultured pulp was collected for HPLC analysis to observe the increase folic acid content.
Folate or Folic Acid Determination
The determination of folic acid was performed by using high-performance liquid chromatography (Shimadzu, Japan). The system is equipped with a degasser, autosampler, quaternary pump, a C18 column and an ultraviolet detector at a wavelength of 280 nm. The chromatography was runed based on gradient elution. The solvent mainly used in mobile phase A, B are hydrogen dipotassium phosphate and acetonitrile with respectively.
Sample Preparation for HPLC and FTIR Analysis
The method used to prepare the samples was direct solvent extraction. Prior to analysis, papaya pulp samples were diluted. 10 g of precisely weighed homogenized material was added to a 50 mL centrifuge tube, along with 25 mL of extraction buffer (pH 7.0 of 0.1 M phosphate buffer), then mixture was ultrasonically extracted for 15 minutes. The extraction solution is then added to make up the 50 ml volume. After centrifuging the samples at 4,500 rpm and filtering the supernatant via a 0.22µm filter, the samples were injected into the HPLC apparatus.11,12
For FTIR Analysis, Samples Were Freeze Dried and Analyzed Through the Irtracer-100 Shimadzu.
Analysis of Titratable Acidity in Fruit Pulp and Juice
Titratable acidity tests were carried out using the methodology described by,.13,14The known volume of sample was poured in conical flask. Thereafter, 250 ml of hot boiled water was added and filtered. 100ml of filtered samples were taken for titration. The dilutes samples were titrated against 0.1N NaOH in presence of phenolphthalein indicator. The end point of titration was permanent pale pink color.The titer value, which represents the volume of NaOH needed for titration, was finally reported. The following formula was used to calculate the percentage of titratable acidity:
Whereas, N: normality of NaOH, T: titer value, E: equivalent weight of the acid, W: sample weight V1: volume made up to, V2: volume extracted.
Analysis of Vitamin C in Fruit Pulp and Juice
The Volumetric method was used to determine ascorbic acid or vitamin C.15 This method based on dye solution.The primary ingredients of this dye solution are sodium bicarbonate and 2,6-dichrolophenol indophenol, which can be made up to 200 ml with distilled water. Standard solution: In volumetric flask 100 mg of ascorbic acid was dissolved in 100 ml of 4% oxalic acid solution. The working standard concentration was 100 μg/ml. Then 5 ml was pipette out from the working standard into a 100 ml conical flask and added 10 ml of 4% oxalic acid. This working standard titrated against dye solution, noted down the titer value (V1). The final result was the appearance of a pink hue that persisted for a short while. After weighing the sample and adding a known volume of 4% oxalic acid to centrifuge tubes, the samples were centrifuged at 4500 rpm for ten minutes. Next, pipette 5 ml of the supernatant into a 50 ml conical flask, add 10 ml of 4% oxalic acid, and titrate the mixture against dye (V2).
Where,
V1= titer value of standard
V2 = titer value of sample
Total phenolic compounds
The total amount of phenols in papaya pulp was calculated as indicated by,.16 The pulp sample of 50 mg was taken, and 5 ml of methanol was added. Subsequently sonicate the sample for 45 minutes at 40 °C, this solution was centrifuged for 10 minutes at 1000 rpm. After collecting the supernatant, 200 μl was extracted and 600 μl of water was added. With that 200 μl of FC reagents were added. 1ml of 8% saturated sodium carbonate solution was added after five minutes. The sample was then held in the dark for 30 minutes after the volume was increased to 3 ml using distilled water. At 765 nm, the absorbance measurement was made. The mg/g of gallic acid was used to express the results.
![]()
Statistical Analysis
To determine the significance of the findings, statistical analysis was performed on the different physicochemical parameter data. LTLH-dried fig (RF-untreated fig/control) data were compared with these results, which were shown as means ± standard deviations. Minitab (Version 17.3.1) was used to calculate a one-way analysis of variance (ANOVA).17The data were considered significant when p < 0.05, and the Tukey test was carried out at a 5% significance level.
Results
Different Strains of Fruit Pulp Synthesize Folic Acid at Varied Concentrations.
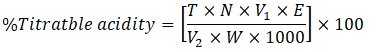
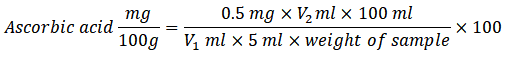
Initially, the folic acid concentration in fruit was observed at 1.6 mg/kg. The HPLC chromatogram results and calibration is presented in Fig. 1 and 2. The effects of Leuconostoc mesenteroides, Lactobacillus acidophilus, Saccharomyces cerevisiae and Streptococcus thermophilus on the folic acid content of fermented pulp concentration (10%, 20% and 30%) are mentioned in Table 1. In 10% of fermented pulp, the concentration of folic acid is lower than in control pulp. In 20% of fermented papaya pulp in Lactobacillus acidophilus, concentrations of folic acid have increased, which is near the control concentration value. Despite those remaining organisms also increased folic concentration as compared to the 10% of papaya pulp. The Lactobacillus acidophilus in 30% of papaya pulp doubled the folic acid concentration of about 2.98 mg/kg as compared to the raw pulp concentration. The HPLC spectral result for Lactobacillus acidophilus of three different fruit concentrations is shown in Fig. 3–5, respectively.
 |
Figure 1: Calibration Curve for HPLC Result |
 |
Figure 2: Papaya Pulp Folic Acid Concentration |
Table 1: Folic Acid Concentration of Papaya Pulp After the Fermentation
|
Strain |
Folic acid concentration (mg/kg) with respect to pulp percentage | ||
| 10% | 20% |
30% |
|
|
Saccharomyces cerevisiae |
0.06 | 0.13 | 0.46 |
| Streptococcus thermophilus | 0.41 | 0.59 |
0.54 |
|
Lactobacillus acidophilus |
0.88 | 1.46 | 2.98 |
| Leuconostoc mesenteroides | 0.27 | 0.25 |
0.26 |
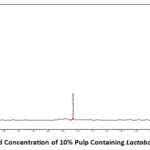 |
Figure 3: Folic Acid Concentration of 10% Pulp Containing Lactobacillus Acidophilus |
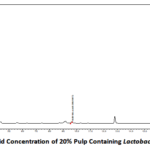 |
Figure 4: Folic Acid Concentration of 20% Pulp Containing Lactobacillus Acidophilus |
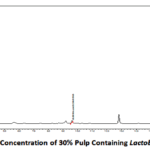 |
Figure 5: Folic Acid Concentration of 30% Pulp Containing Lactobacillus Acidophilus |
FTIR Analysis of Papaya Pulp and Its Functional Group Changes
As shown in Fig. 6, 7 and 8 for fruit pulp concentrations of 10%, 20%, and 30%, respectively, the unfermented papaya pulp (control) and the fermented pulp by beneficial microbes were compared for their changes in functional group and their bands identified with wavenumber. The bands of the absorption spectrum range in size from 3300 to 600 cm-1. Even though each pulp concentration has a range of wave numbers, the bands in this spectrum change to correspond to the varied pulp concentrations. The two vibrational zones between 2000 and 1500 cm-1 and 1500 and 1000 cm-1 show the most difference. There was a wider band between 3500 and 3000 cm-1 in the bands compared to 10%, 20%, and 30% pulp and fermented pulp, which represents O-H stretching vibration of strong bonds and compounds present in intermolecular bonds. These bands are found in 10% [control, Saccharomyces cerevisiae, Streptococcus thermophilus] and 20%, 30% [control, Lactobacillus acidophilus] pulp, respectively. The absorption region is found in each of these pulp concentrations between 3300 and 3200 cm-1. Similar to this, O-H bending vibration of medium hydroxyl group present between the absorption of 1418-1409 cm-1 these group observed in 10% [control, Lactobacillus acidophilus], 20% [control, Lactobacillus acidophilus and Leuconostoc mesenteroides], and in 30% [Leuconostoc mesenteroides and Saccharomyces cerevisiae]. In fruit pulp, this stands in for the carboxylic group. The presence of alcohol in the papaya pulp was indicated by the O-H group, which was found.18 The 10% [Lactobacillus acidophilus and Leuconostoc mesenteroides], 20% and 30% [Leuconostoc mesenteroides, Saccharomyces cerevisiae and Streptococcus thermophilus], all exhibit a strong, sharp C-H stretching vibration.
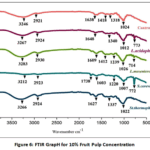 |
Figure 6: FTIR GrapH for 10% Fruit Pulp Concentration |
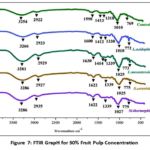 |
Figure 7: FTIR GrapH for 30% Fruit Pulp Concentration |
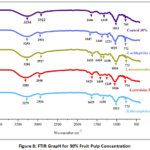 |
Figure 8: FTIR GrapH for 30% Fruit Pulp Concentration |
pH Result of Fermented Papaya Pulp
The pH result from the 24-hour studies has been noted and is listed in Table 2. After a 6-hour period, pH gradually climbed in Lactobacillus acidophilus, Streptococcus thermophilus andSaccharomyces cerevisiae, but pH gradually declined in Leuconostoc mesenteroides. Exactly at 6hrs and 12Hrs both Streptococcus thermophilus andSaccharomyces cerevisiae showed a similar increase in pH i.e 4.73 ± 0.005 to 5.09 ± 0.010. In 24hrs study least pH (3.59 ± 0.010) observed in 10% of Streptococcus thermophilus.
Table 2: pH Result of Different Fruit Pulp Concentration
|
Hours |
Fruit pulp concentration | Mean and SD values | |||
| Lactobacillus acidophilus | Leuconostoc mesenteroides | Streptococcus thermophilus |
Saccharomyces cerevisiae |
||
|
Initial |
10% | 4.96 ± 0.010b | 4.89 ± 0.010a | 4.73 ± 0.005a | 4.72 ± 0.005a |
| 20% | 4.80 ± 0.011e | 4.75 ± 0.005b | 4.61 ±0.010abcde |
4.62 ± 0.010ab |
|
|
30% |
4.73 ± 0.005fg | 4.69 ± 0.005c | 4.55 ±0.010abcde | 4.59 ± 0.005ab | |
| 6hrs | 10% | 5.09 ± 0.011a | 4.25 ± 0.010f | 5.31 ± 0.015ab |
5.01 ± 0.005ab |
|
20% |
4.96 ± 0.010b | 4.39 ± 0.010e | 5.21 ± 0.015ab | 5.10 ± 0.010ab | |
| 30% | 4.84 ± 0.011d | 4.44 ± 0.011d | 5.16 ± 0.011ab |
5.09 ± 0.005ab |
|
|
12hrs |
10% | 4.92 ± 0.005c | 4.18 ± 0.011g | 5.01 ± 0.010abcd | 4.85 ± 0.010ab |
| 20% | 4.76 ± 0.011f | 4.09 ± 0.010h | 5.09 ± 0.010abc |
5.07 ± 0.011ab |
|
|
30% |
4.72 ± 0.010g | 4.23 ± 0.011f | 5.04 ± 0.010abcd | 5.04 ± 0.011ab | |
| 18hrs | 10% | 4.57 ± 0.005h | 3.88 ± 0.005i | 3.74 ± 0.005cde |
4.02 ± 0.011b |
|
20% |
4.55 ± 0.010 h | 3.84 ± 0.005j | 4.02 ± 0.011bcde | 4.16 ± 0.005b | |
| 30% | 4.48 ± 0.015i | 3.89 ± 0.005i | 4.14 ± 0.005bcde |
4.18 ± 0.010b |
|
| 24hrs |
10% |
4.29 ± 0.015j | 3.78 ± 0.010k | 3.59 ± 0.010e | 3.81 ± 0.005b |
| 20% | 4.18 ± 0.011k | 3.75 ± 0.010l | 3.71 ± 0.005de |
4.03 ± 0.005b |
|
|
30% |
4.16 ± 0.015k | 3.63 ± 0.011m | 3.98 ± 0.005bcde |
± 0.011b |
|
*a to m In the values letter are do not share significantly different (P=0.05)
Titratable Acidity Content of Papaya Pulp
The titratable acidity of all variable concentration of pulp as given in Table 3. The TA was increased with increasing the pulp concentration. The highest TA (1.19±0.02) observed in S. cerevisiae 30% of pulp concentration and least TA (0.25±0.02) was found in 10% of L. mesenteroides and S. thermophilus. The difference pulp concentration has significant difference within the pulp percentage (p< 0.05).
Table 3: In-Situ Fermentation’s Effects On Papaya Pulp’s Titratable Acidity (%)
|
Pulp concentration |
Lactobacillus acidophilus | Leuconostoc mesenteroides | Streptococcus thermophilus |
Saccharomyces cerevisiae |
|
10% |
0.27± 0.02de | 0.25±0.02de | 0.25±0.02de | 0.36±0.02c |
| 20% | 0.36±0.02c | 0.31±0.03cd | 0.29±0.00cd |
0.56±0.02b |
|
30% |
0.55±0.02b | 0.55±0.02b | 0.53±0.00b |
1.19±0.02a |
Each value represents the three replicates’ mean ± standard deviation.
Statistically significant differences (p < 0.05) are indicated by letters in the same column.
Vitamin C Content of Papaya Pulp
In papaya the cultures were increased the vitamin C after the fermentation. The highest vitamin content observed in 30% L. mesenteroides of about 105.49±0.25 mg/g followed by S. thermophilus73.60±3.68 mg/g. The least concentration observed in 10% L. acidophilus and S. cerevisiae. The concentration of Vitamin C was high which is double amount of control papaya pulp. Except for 30% L. mesenteroides, there was no noticeable distinction between the various pulp concentrations. Over all Vitamin C content mentioned in Table 4.
Table 4: Impact of In-Situ Fermentation On Papaya Pulp Vitamin C (Mg/G) Content
|
Pulp concentration |
Lactobacillus acidophilus | Leuconostoc mesenteroides | Streptococcus thermophilus |
Saccharomyces cerevisiae |
|
10% |
20.85±1.12i | 29.44±0.68fghi | 25.76±0.68hi | 22.08±0.68i |
| 20% | 40.48±1.36def | 76.05±1.66b | 53.36±1.84c |
36.80±0.68efgh |
|
30% |
50.29±0.92cd | 105.49±0.25a | 73.60±3.68b |
42.93±0.52cde |
Each value represents the three replicates’ mean ± standard deviation.
Statistically Significant Differences (P < 0.05) Are Indicated By Letters In The Same Column.
Phenols Content of Papaya Pulp
The total phenols are important for the redox properties responsible for antioxidant capacity.19L. mesenteroides of 30% fruit pulp has showed high phenols content as compared to other concentration of pulp. The total phenols from all different concentration of pulp were mentioned in Table 5. There was no significance difference observed in papaya pulp.
Table 5: Impact ofIn-Situ Fermentation On Papaya Pulp Total Phenols (Mg GAE/G) Content
|
Pulp concentration |
Lactobacillus acidophilus | Leuconostoc mesenteroides | Streptococcus thermophilus |
Saccharomyces cerevisiae |
|
10% |
13.37±0.23i | 14.24±0.43cdfegh | 13.75±0.30fghi | 14.24±0.37cdfegh |
| 20% | 14.79±0.23abcd | 15.28±0.26ab | 13.86±0.30efghi |
14.59±0.26bcde |
|
30% |
14.21±0.26defgh | 15.53±0.07a | 14.30±0.23cdefg |
14.46±0.17cdef |
Each value represents the three replicates’ mean ± standard deviation.
Statistically significant differences (p < 0.05) are indicated by letters in the same column.
Discussion
Production of Folic Acid by Several Strains in Varying Fruit Pulp Concentrations
Even though Lactobacillus acidophilus has a higher concentration of folic acid synthesizing ability in fruit pulp, the remaining three cultures are proven to have the ability to synthesize folate at lower concentrations. It’s been reported that Saccharomyces cerevisiae synthesizes folic acid in white wheat bread,20 beta-glucan-rich oats and barely matrices,8 oat bran fermentation,9 and fermented soybeans.21The most important probiotic strain, Streptococcus thermophilus, synthesizes folic acid in dairy products, mainly yoghurt,22fermented milk,23,24 cheese,25and fruits and okra soybean.26The LAB species of Leuconostoc mesenteroides synthesized a higher amount of folic acid in reconstituted skim milk concentration,5 even though papaya pulp produced a lesser concentration of folic acid but showed the same ability to synthesize folic acid in fruit pulp. The LAB species of Leuconostoc mesenteroides synthesized a higher amount of folic acid in reconstituted skim milk concentration,5 even though papaya pulp produced a lesser concentration of folic acid but showed the same ability to synthesize folic acid in fruit pulp. In the same way, a LAB mixed culture containing Lactobacillus acidophilus showed an increased concentration of folic acid in banana juice,27 and in dairy products like coco milk drink,28 fermented milk,29and bread.30There was an increase in concentration with increasing fruit pulp concentration, which proved that beneficial microorganisms can synthesize folate in fruit pulp while undergoing fermentation. The beneficial micro-organisms synthesis the folate through de novo pathway, which also responsible for amino acids and nucleotides. This same folate biosynthesis pathway was found in fungi, green plants, and certain protozoa.29,31
FTIR Analysis of Papaya Pulp And Its Functional Group Changes
In all combinations of fruit pulp, the medium hydrocarbons stretching vibrations [C-H] were detected in the range of wave numbers 2931-2921 cm-1. The conjugated alkene compound’s C=C medium stretching vibration and its absorption region between 1600 and 1637 cm-1 were observed in all three pulp concentrations, with the exception of 10% and 30% [control, Lactobacillus acidophilus] where these vibrations were replaced by strong C=C strong stretching vibrations and absorptions between 1648 and 1638 cm-1. According to,32 proteins, phosphate, and fatty acid compounds fall between the range of 1500-1200 cm-1 and the wave number range of 1800-1500 cm-1 represents the amide I and amide II group. Additionally, the medium OH-bending carboxylic group was found in the range of 1400 cm-1 and was present in 10% control, Leuconostoc mesenteroides, 20% control, Lactobacillus acidophilus, Leuconostoc mesenteroides, and lastly 30% Leuconostoc mesenteroides and Saccharomyces cerevisiae. Aromatic amines are seen to have strong C-H stretching vibrations between 1300 cm-1. The zone for protein, nucleic acid, carbohydrates, and DNA was found by,32 as being between the wavenumbers of 1300-900 cm-1. The papaya contains major carbohydrates like fructose, sucrose, and glucose, as well as a region for polysaccharides; these peaks are observed in the fingerprint region between 1200-900 cm-1.32–34The most sugar regions in the range 1240–1220 cm-1 were observed in 10% Leuconostoc mesenteroides and Saccharomyces cerevisiae, 20%, Leuconostoc mesenteroides, Streptococcus thermophilus and in 30%Lactobacillus acidophilus, Saccharomyces cerevisiae.
Ph, Titratable Acidity of Fruit Pulp
In this investigation, a progressive drop in pH was seen in all three varied pulp concentrations after 12 hours. This identical outcome is consistent with probiotic fruit juice made from lactic acid bacteria, which after 12 hours showed a pH reduction reported by,.35 The pH concentration of the Streptococcus thermophilus also decreased after 6 hours and its reported in functional fermented foods and milk products.36,37 After 24 hours of fermentation, lowest pH observed in Leuconostoc mesenteroides strain. Its reported that during storage experiments, the Leuconostoc mesenteroides strain utilized in the production of kimchi displayed a drop in pH.38The pH of wine prepared from mixed fruit and fermented with Saccharomyces cerevisiae reportedly decreased.39The pulp concentration varied considerably (P = 0.05) according to the pH results for Lactobacillus acidophilus and Leuconostoc mesenteroides. In Saccharomyces cerevisiae and Streptococcus thermophilus the varying fruit pulp concentrations do not significantly differ from one another.
The TA of different concentration of papaya pulp showed non-significant difference except in S. cerevisiae (30%). The increase in titratable acidity represent the sugar metabolism by LAB strain and forms lactic acid.40 The fermentation leads to formation of organic acids which leads to increases in TA of fruit pulp. The predominant organic acids present in papaya is citric acid and malic acid.41 The brewer yeast double the highest TA as compared to LAB strains.
The limitations of this study were all selected probiotic micro-organisms not suitable for folate production. The flavour production was not acceptable after the fermentation process.
Conclusion
The present preliminary work is based on the efficiency of beneficial microorganisms to synthesis the folic acid present in fruit pulp. All four microorganisms synthesize folic acid, but Lactobacillus acidophilus synthesizes a higher concentration of folic acid. This works supports lactose intolerance-based folate rich products. The In-situ fermentation also changes the functional group which is responsible for folate production. Even pH and titratable acidity was significantly difference with respect to the micro-organisms. Usually, these studies are mostly carried over in milk and milk products. There are few research papers related to folic acid synthesis in fruits. This study supports folic acid enrichment in fruits which is economically important as well it supports value added too. These results help in the production of fruit juices rich in folate.
Acknowledgement
The authors would like to thank the Ministry of Food Processing Industries and the National Institute of Food Technology Entrepreneurship and Management – Thanjavur, India, for providing guidance and knowledge support.
Funding Sources
The author(s) received no financial support for the research, authorship, and/or publication of this article.
Conflicts of Interest
The author(s) do not have any conflict of interest.
Data Availability Statement
The manuscript incorporates all datasets produced or examined throughout this research study.
Ethics Statement
This research did not involve human participants, animal subjects, or any material that requires ethical approval.
Informed Consent Statement
This study did not involve human participants, and therefore, informed consent was not required.
Clinical Trial Registration
This research does not involve any clinical trials
Permission to Reproduce Material from Other Sources
Not Applicable.
Author Contributions
- Mamatha Rani Rangaswamy – Conceptualization, Methodology, Writing – Original Draft.
- Pratheepa Velumani – Data Collection, Editing
- Jaganmohan Rangarajan – Analysis, Writing – Review and Editing
- Vincent Hema – Visualization, Supervision
- Vidyalakshmi Rajagopal – Conceptualization, Visualization, Resources, Supervision.
References
- National Horticulture Board. https://nhb.gov.in. Accessed February 17, 2026.
- Ming R, Moore PH. Genetics and genomics of papaya. In: Genetics and Genomics of Papaya. Springer; 2014:1-438. doi:10.1007/978-1-4614-8087-7
CrossRef - Farina V, Tinebra I, Perrone A, et al. Physicochemical, nutraceutical and sensory traits of six papaya (Carica papaya L.) cultivars grown in greenhouse conditions in the Mediterranean climate. Agronomy. 2020;10(4):1-16. doi:10.3390/agronomy10040501
CrossRef - Castaño E, Piñuñuri R, Hirsch S, Ronco AM. Folatos y embarazo, conceptos actuales. ¿Es necesaria una suplementación con acido fólico? Rev Chil Pediatr. 2017;88(2):199-206. doi:10.4067/S0370-41062017000200001
CrossRef - Mahara FA, Nuraida L, Lioe HN. Folate in milk fermented by lactic acid bacteria from different food sources. Prev Nutr Food Sci. 2021;26(2):230-240. doi:10.3746/pnf.2021.26.2.230
CrossRef - De Giori GS, LeBlanc JG. Folate production by lactic acid bacteria. In: Polyphenols in Human Health and Disease. Elsevier; 2018:15-29. doi:10.1016/B978-0-12-813008-7.00002-3
CrossRef - Lin MY, Young CM. Folate levels in cultures of lactic acid bacteria. Int Dairy J. 2000;10(5-6):409-413. doi:10.1016/S0958-6946(00)00056-X
CrossRef - Kariluoto S, Edelmann M, Nyström L, et al. In situ enrichment of folate by microorganisms in beta-glucan rich oat and barley matrices. Int J Food Microbiol. 2014;176:38-48. doi:10.1016/j.ijfoodmicro.2014.01.018
CrossRef - Korhola M, Hakonen R, Juuti K, et al. Production of folate in oat bran fermentation by yeasts isolated from barley and diverse foods. J Appl Microbiol. 2014;117(3):679-689. doi:10.1111/jam.12564
CrossRef - Rani M, Velumani P, Rangarajan J, Hema V, Rajagopal V. Mango (Mangifera indica L.) var Banganapalli: impact of in-situ intervention on folic acid concentration and its changes in physicochemical property. Trends Hortic. 2024;7(1):1-16. doi:10.24294/th.v7i1.3485
CrossRef - Thermo Fisher Scientific. Determination of water- and fat-soluble vitamins by HPLC. https://www.dionex.com/en-us/webdocs/88784-TN89-HPLC-WaterFatSolubleVitamins-27Oct2010-LPN2598.pdf. Published 2017. Accessed February 17, 2026.
- Czarnowska-Kujawska M, Gujska E, Michalak J. Testing of different extraction procedures for folate HPLC determination in fresh fruits and vegetables. J Food Compos Anal. 2017;57:64-72. doi:10.1016/j.jfca.2016.12.019
CrossRef - Ranganna S. Handbook of Analysis and Quality Control for Fruit and Vegetable Products. 2nd ed. Tata McGraw-Hill; 1986.
- Food Safety and Standards Authority of India. Manual of Methods of Analysis of Foods: Fruit and Vegetable Products. Food Safety and Standards Authority of India; 2016.
- Sadasivam S, Manickam A. Biochemical Methods. 3rd ed. New Age International; 2008.
- Chandra S, Khan S, Avula B, et al. Assessment of total phenolic and flavonoid content, antioxidant properties, and yield of aeroponically and conventionally grown leafy vegetables and fruit crops: a comparative study. Evid Based Complement Alternat Med. 2014;2014:253875. doi:10.1155/2014/253875
CrossRef - Mangang IB, Lakshmi NV, ML. Low-temperature low-humidity pretreatment followed by RF heating: a novel method of fig preservation. Sustain Food Technol. 2025. doi:10.1039/D5FB00304K
CrossRef - Cholassery S, Krishna V, Sethuraj S, et al. Analysis of physicochemical and sensory parameters of wine produced from Carica papaya. J Appl Biol Biotechnol. 2019;7(5):74-78. doi:10.7324/JABB.2019.70512
CrossRef - Soobrattee MA, Neergheen VS, Luximon-Ramma A, Aruoma OI, Bahorun T. Phenolics as potential antioxidant therapeutic agents: mechanism and actions. Mutat Res. 2005;579(1-2):200-213. doi:10.1016/j.mrfmmm.2005.03.023
CrossRef - Hjortmo S, Patring J, Jastrebova J, Andlid T. Biofortification of folates in white wheat bread by selection of yeast strain and process. Int J Food Microbiol. 2008;127(1-2):32-36. doi:10.1016/j.ijfoodmicro.2008.06.001
CrossRef - Maryati Y, Susilowati A, Melanie H, Lotulung PD. Fermentation of soybean (Glycine max L. Merr) using mixed inocula of Rhizopus sp. and Saccharomyces cerevisiae for alternative source of folic acid. IOP Conf Ser Mater Sci Eng. 2019;536(1):012124. doi:10.1088/1757-899X/536/1/012124
CrossRef - Khalili M, Rad AH, Khosroushahi AY, Khosravi H, Jafarzadeh S. Application of probiotics in folate bio-fortification of yoghurt. Probiotics Antimicrob Proteins. 2020;12(2):756-763. doi:10.1007/s12602-019-09560-7
CrossRef - Iyer R, Tomar SK. Dietary effect of folate-rich fermented milk produced by Streptococcus thermophilus strains on hemoglobin level. Nutrition. 2011;27(10):994-997. doi:10.1016/j.nut.2011.01.003
CrossRef - Meucci A, Rossetti L, Zago M, et al. Folates biosynthesis by Streptococcus thermophilus during growth in milk. Food Microbiol. 2018;69:116-122. doi:10.1016/j.fm.2017.08.001
CrossRef - Albano C, Silvetti T, Brasca M. Screening of lactic acid bacteria producing folate and their potential use as adjunct cultures for cheese bio-enrichment. FEMS Microbiol Lett. 2020;367(9):fnaa059. doi:10.1093/femsle/fnaa059
CrossRef - Albuquerque MAC, Bedani R, Vieira ADS, LeBlanc JG, Saad SMI. Supplementation with fruit and okara soybean by-products and amaranth flour increases the folate production by starter and probiotic cultures. Int J Food Microbiol. 2016;236:26-32. doi:10.1016/j.ijfoodmicro.2016.07.008
CrossRef - Budiari S, Maryati Y, Susilowati A, Lotulung PD, Mulyani H. Pengayaan asam folat pada jus pisang fermentasi menggunakan kultur bakteri asam laktat (folic acid enrichment of fermented banana juice with lactic acid bacteria). Biopropal Ind. 2020;11(2):67-75. doi:10.36974/jbi.v11i2.6032
CrossRef - Yuliana N, Rangga A. Manufacture of fermented coco milk drink containing lactic acid bacteria cultures. Afr J Food Sci. 2010;4(9):558-562.
- Wu Z, Wu J, Cao P, et al. Characterization of probiotic bacteria involved in fermented milk processing enriched with folic acid. J Dairy Sci. 2017;100(6):4223-4229. doi:10.3168/jds.2017-12640
CrossRef - Azmi S, Ahmed J, Ramalingam K. Nutritional enhancement of wheat bread by probiotic Lactobacillus consortium. 2023;12(4):1-12.
CrossRef - Iyer R, Tomar SK. Folate: a functional food constituent. J Food Sci. 2009;74(9):R114-R122. doi:10.1111/j.1750-3841.2009.01359.x
CrossRef - Dziuba B, Babuchowski A, Nałecz D, Niklewicz M. Identification of lactic acid bacteria using FTIR spectroscopy and cluster analysis. Int Dairy J. 2007;17(3):183-189. doi:10.1016/j.idairyj.2006.02.013
CrossRef - Dhaulaniya AS, Balan B, Yadav A, et al. Development of an FTIR-based chemometric model for the qualitative and quantitative evaluation of cane sugar as an added sugar adulterant in apple fruit juices. Food Addit Contam Part A Chem Anal Control Expo Risk Assess. 2020;37(3):1-13. doi:10.1080/19440049.2020.1718774
CrossRef - Leopold LF, Leopold N, Diehl HA, Socaciu C. Quantification of carbohydrates in fruit juices using FTIR spectroscopy and multivariate analysis. Spectroscopy. 2011;26(2):93-104. doi:10.3233/SPE-2011-0529
CrossRef - Anita S, Mohan G, Guhankumar P, Santhiya N. Probiotication of fruit juices by Lactobacillus acidophilus. Int J Adv Biotechnol Res. 2013;4(1):935-940.
- Kort R, Westerik N, Serrano LM, et al. A novel consortium of Lactobacillus rhamnosus and Streptococcus thermophilus for increased access to functional fermented foods. Microb Cell Fact. 2015;14(1):195. doi:10.1186/s12934-015-0370-x
CrossRef - Tarrah A, Noal V, Giaretta S, et al. Effect of different initial pH on the growth of Streptococcus macedonicus and Streptococcus thermophilus strains. Int Dairy J. 2018;86:65-68. doi:10.1016/j.idairyj.2018.07.003
CrossRef - Jung JY, Lee SH, Lee HJ, Seo HY, Park WS, Jeon CO. Effects of Leuconostoc mesenteroides starter cultures on microbial communities and metabolites during kimchi fermentation. Int J Food Microbiol. 2012;153(3):378-387. doi:10.1016/j.ijfoodmicro.2011.11.030
CrossRef - Ogodo AC, Ugbogu OC, Ugbogu AE, Ezeonu CS. Production of mixed fruit (pawpaw, banana and watermelon) wine using Saccharomyces cerevisiae isolated from palm wine. Springerplus. 2015;4(1):683. doi:10.1186/s40064-015-1475-8
CrossRef - Tayo BA, Akpeji AS. Probiotic viability, physicochemical and sensory properties of probiotic pineapple juice. Fermentation. 2016;2(4):20. doi:10.3390/fermentation2040020
CrossRef - Hewajulige IG, Abeywickrama SAD. Papayas. In: Encyclopedia of Food and Health. Elsevier; 2016. doi:10.1016/B978-0-12-384947-2.00517-1
CrossRef
Abbreviations
FSSAI – Food Safety Standards Authority of India
FTIR – Fourier Transform Infrared Spectroscopy
HPLC – High Performance Liquid Chromatography
MTCC – Microbial Type Culture Collection
NCDC – National Collection of Dairy Cultures
NCIM – National Collection of Industrial Microorganisms
NDRI – National Dairy Research Institute
rpm – Revolutions per minute
Accepted on: 19 Dec 2025
Second Review by: Hadi Bello
Final Approval by: Dr. Angelo Maria Giuffrè


Web of Science Coverage
Emerging Sources Citation Index (ESCI)
2024 Journal Impact Factor: 1.1
Scopus Journal Metrics
CiteScore 2025: 2.6
CiteScore Details
Sustainable Nutrition: Food Systems, Nutrient Retention, and Public Health Impact
![]()
This journal is a member of, and subscribes to the principles of, the Committee on Publication Ethics (COPE)


