Lifestyle Factors and their Relation to Measures of Obesity Amongst Adults Living in Jeddah- Saudi Arabia: A Cross-Sectional Study
1Faculty of Medicine, Saudi Diabetes Research Group, King Abdulaziz University, P.O.Box: 42806 Jeddah 21551, Saudi Arabia
2Department of clinical biochemistry, King Abdulaziz University, P.O.Box: 4873- Jeddah 21412- Saudi Arabia.
Correspondence Email: sbahijri@gmail.com
DOI : http://dx.doi.org/10.12944/CRNFSJ.3.2.02
Download this article as:
![]()
Although the prevalence of obesity and overweight in Saudi Arabia is high, studies of associated factors are lacking. This study aimed to investigate the relationship between socio-demographic and lifestyles factors and different measures of obesity amongst adults living in Jeddah.
A cross sectional design was used employing a multi stage geographical cluster random sampling technique to select survey locations. Only families living in KSA for ≥ 5 years were included. Participants were interviewed about dietary and socio-demographic information, and their anthropometric measurements (weight, height, waist and hip circumference) were taken. Body mass index (BMI) and waist to hip ratio (WHR) were used as measures of general and abdominal obesity, respectively.
331 adults were included in the study; mean age ± SD was 37.12 ± 13.58. General and central obesity were both inversely related to educational level, fast food consumption, number of snacks consumed and the level of physical activity. Central obesity was more prevalent in frequent breakfast consumers and smokers. Males who consumed less snacks and were physically inactive had higher odds of being generally obese, while those with increasing breakfast intake and decreasing fast food consumption were prone to central obesity. Females with a greater number of meals consumption had higher odds of general obesity while those who consumed less snacks and were physically inactive were prone to central obesity.
The design of health programs and strategies to reduce the prevalence of obesity tailored to associated factors is a health priority.
Lifestyle factors; Obesity; Dietary habits; Eating behaviors; Smoking; Physical activity; Socio-demographic
Introduction
Obesity is considered a pandemic, and along with overweight are the fifth leading risk for global mortality.1,2 Obesity is defined as ranges of body weight that are greater than what is considered healthy for a given height.3
Overweight and obesity rates are high in the Arabian Gulf region and are the highest in the world among adolescents and during childhood.4 In Saudi Arabia (KSA), it was reported that the prevalence of obesity and overweight combined is 35.5% in adults > 30 years of age.5 Moreover, the rising trends in body mass index (BMI) in KSA are indicative of increasing rates of obesity that needs immediate preventive measures.6
Measurement of BMI is considered the most useful population-level measure of overweight and obesity.1 Waist to hip ratio (WHR) has also been suggested as a better index for predicting cardio-metabolic risk.7
In order to construct health- care programs that help to combat the increasing prevalence of obesity in our region, risk factors must be explored. Such risk factors include both non-modifiable factors like age, sex, ethnicity, and family history, as well as factors that are modifiable such as lifestyle habits.8 Previous research has shown that factors such as low level of physical activity,9 eating behaviors,10 food consumption,11 and socioeconomic conditions are all associated with the obesity.12 Therefore, the primary aim of this study is to evaluate the association between obesity and several lifestyle factors, using both BMI and WHR to measure the degree of obesity among adults in Jeddah.
Materials and Methods
A cross-sectional study was conducted on households in the city of Jeddah, KSA, throughout the summer season of 2011. Ethical approval was obtained from the Committee on the Ethics of Human Research at King Abdul-Aziz University, Jeddah, Saudi Arabia.
Experimental Design
Sampling method: A multi-stage geographical cluster random sampling technique was used to select the targeted sample, by enlisting the help of an experienced consultant in geographic information system (GIS) and ArcGIS mapping. The World Health Organization Expanded Program on Immunization (EPI) cluster survey design was adopted in sampling of the current study,13 using the digital geo-referenced map for Jeddah Governorate. (Figure 1)
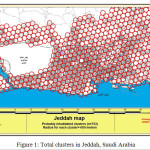 |
Figure 1: Total clusters in Jeddah, Saudi Arabia
|
Definitions of Terminologies that were Used in Previous Studies (14-17), and Summarized as follows
Big cluster: represented by a surface area within a circle with a radius of half a kilometer. Small cluster: represented by a surface area inside a circle with a radius of 50 meters. Centroid of a cluster: is a geometrically geo referenced central point of a cluster. Slum areas are identified when the architecture displayed in the map shows a profound irregularity. The cluster was categorized as being slum when a slum area occupied the whole or part of its surface area. ( Figures 2, 3, and 4).
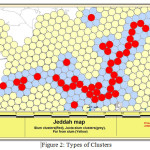 |
Figure 2: Types of Clusters
|
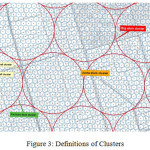 |
Figure 3: Definitions of Clusters
|
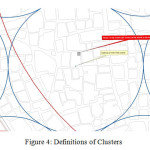 |
Figure 4: Definitions of Clusters
|
Assuming that there are distinct socio-demographic characteristics of the population within different districts according to its location in the north or south of Jeddah Governorate, therefore and in order to get representative sample from both groups, the sample was divided equally on both subgroups.
Technique of selection of the houses and individuals
Multistage sampling was pursued as follows
The First Stage
Thirty six big clusters were randomly selected (18 clusters from each of the North and South of Jeddah), and assigned as follows: North of Jeddah: Proportionate sampling was conducted to select weighted sample from each of the two types of clusters (slum and organized), so that samples from each type were selected by systematic random sampling from the list of clusters created in the ArcGIS program. Fifteen clusters were selected from organized districts, and three clusters were chosen from slum areas.
South of Jeddah
The same procedure was followed.
The Second Stage
Within each big cluster, two small clusters were selected randomly (simple random sampling from the list of small clusters within the big cluster). The centroid of the small cluster was considered as a landmark for choice of the selected house in which it was located by the side of the northeast corner of the block where the centroid was located was chosen.
The Third Stage
Choosing the family (those who fulfill the inclusion criteria) from the selected house.Villas: all the residents were included.
Traditional Style Houses
if it is occupied by more than one family, at that point the family residing behind the first right door from the entrance was enrolled.
Multi-Stored Buildings
The flat that was present on the right side from the entrance was selected first, then going counterclockwise direction in this floor and the next floor till completing the designated sample.
When the building present in the northeast corner of the block was not a residential building, then the adjacent one was selected going on a clockwise direction .
The Total Numbers of Selected Small Clusters were Seventy-two.
Five families were selected, from each small cluster, making a total of three hundred and sixty families. However, not all selected clusters were covered in this study.
Study Group (Inclusion Criteria)
Adults aged ≥ 18-70, living in Saudi Arabia for five years or more, and representing a member of a family (i.e. did not live alone) were included in this study.
Data Collection
Trained interviewers gathered information using a pretested questionnaire using a face-to-face interview. Information was collected with a distinct classification for each variable, including age, gender, ethnicity , educational level, working status, nationality, smoking habits, physical activity, dietary patterns (eating out, number of meals and snacks/day), as well as breakfast and fast food consumption (western type of fast food).
Assessment of Lifestyle Factors
Physical activity: Participants were asked about the frequency, time, and intensity of physical activity and were classified into four categories: inactive, mildly active, moderately active, and highly active.
Dietary Habits
Regarding eating out, participants were asked about the frequency. Then, they were classified according to the number of times per week into four groups: never, 1-2, 3-5 and more than 5 times.
Smoking: Participants were classified according to their smoking habits as active smoker, former smoker, passive smoker, or non-smoker.
Anthropometric Measurements
Body weight was measured through a digital scale while height was measured using a wall stadiometer. Measurements were taken while subject were minimally clothed and barefoot. Weight , hip and waist circumference was rounded to the adjacent 0.5 kg, centimeter respectively. Waist and hip circumferences were measured using a measuring tape while avoiding exertion of pressure on the tissues. BMI was calculated as weight in kilograms divided by the height in meters, squared, using standard cutoff points for classification.18 WHR is the ratio of the circumference of the waist to that of the hips. Abdominal obesity is defined as a waist–hip ratio above 0.95 for males and above 0.80 for females.19
Statistical Design
All the collected data were reviewed, coded, entered and studied by using the Statistical Package of Social Science (SPSS) software; version 20.0. Continuous variables were presented as mean values ± standard deviation, while qualitative variables were presented as absolute frequencies and relative frequencies (percentages). Contingency tables with calculation of the chi-square test were presented to evaluate the association between categorical variables to assess the significance in the differences between proportions. The significance in the differences between means was assessed using independent samples student t test for dichotomous nominal variables.
All presented P-values were two-tailed and taken at the 0.05 significance level and confidence interval of 95%.
Table 1: Socio-Demographic Characteristics of the Studied Population in Jeddah, Saudi Arabia, 2012
|
Socio-demographic Characteristics |
|
Total n(%) |
|
Males n=153(46.2%) |
Females n=178(53.8%) |
|||||
| Age Groups: | ||||||||||
|
18-34 |
154 (47.1%) |
64(41.6%) |
90(58.4%) |
|||||||
|
35-44 |
69 (21.1%) |
31(44.9%) |
38(55.1%) |
|||||||
|
45-54 |
59 (18.0%) |
28(47.5%) |
31(52.5%) |
|||||||
|
55-70 |
45 (13.8%) |
28(62.2%) |
17(37.8%) |
|||||||
|
Mean + SD |
37.12 ± 13.58 |
39.02 ± 14.48 |
35.47 ± 12.56 |
|||||||
| Education: | ||||||||||
|
Illiterate , read and write |
19 (5.8%) |
5(26.3%) |
14(73.7%) |
|||||||
|
Primary and preparatory |
50 (15.2%) |
19(38.0%) |
31(62.0%) |
|||||||
|
Secondary |
137 (41.6%) |
66(48.2%) |
71(51.8%) |
|||||||
|
University + |
123 (37.4%) |
62(50.4%) |
61(49.6%) |
|||||||
| Occupation: | ||||||||||
|
Not working |
191 (59.7%) |
55(28.8%) |
136(71.2%) |
|||||||
|
Working |
129 (40.3%) |
94(72.9%) |
35(27.1%) |
|||||||
| Jeddah Districts : | ||||||||||
|
North regular |
131 (39.6%) |
60(45.8%) |
71(54.2%) |
|||||||
|
North slum |
14 (4.2%) |
9(64.3%) |
5(35.7%) |
|||||||
|
South regular |
156 (47.1%) |
69(44.2%) |
87(55.8%) |
|||||||
|
South slum |
30 (9.1%) |
15(50.0%) |
15(50.0%) |
|||||||
| Household Income : | ||||||||||
|
Below 3,000 SAR |
31 (10.0%) |
13(41.9%) |
18(58.1%) |
|||||||
|
3,000 – 5,000 SAR |
74 (23.9%) |
34(45.9%) |
40(54.1%) |
|||||||
|
5,000 – 10,000 SAR |
115 (37.1%) |
57(49.6%) |
58(50.4%) |
|||||||
|
10,000 – 20,000 SAR |
48 (15.5%) |
23(47.9%) |
25(52.1%) |
|||||||
|
Over 20,000 SAR |
42 (13.5%) |
18(42.9%) |
24(57.1%) |
|||||||
| House ownership: | ||||||||||
|
Rent |
201 (63.0%) |
96(47.8%) |
105(52.2%) |
|||||||
|
Own |
118 (37.0%) |
56(47.5%) |
62(52.5%) |
|||||||
| Housing: | ||||||||||
|
Apartment |
258 (80.9%) |
121(46.9%) |
137(53.1%) |
|||||||
|
Villa |
49 (15.4%) |
24(49.0%) |
25(51.0%) |
|||||||
|
Public House |
12 (3.8%) |
7(58.3%) |
5(41.7%) |
|||||||
Results
Three hundred and thirty one adult subjects were included in this study. Sociodemographic characteristics of studied population presented in Table 1. The percentage of females slightly exceeded that of males with a ratio of 1:1.16. A large proportion of studied population was less than 35 years old (47.1%). Mean age of participants (Mean ± Standard deviation) was 37.12 ± 13.58. The unemployed participants (including house wives and students) constituted the majority (59.7%), and most of them were females (71.2%). Illiterate participants, and those with less than primary school certificate accounted for the lowest percentage (5.8%), with more than half being females (73.3%). The highest percentage of studied sample was holders of secondary school certificate (41.6 %). Studied lifestyle and dietary habits are presented in (Table 2). More than half of the studied sample always had their breakfast (51.4%). Fast food consumption was not common among the studied sample; with less than one fifth stating that they always ate fast food (17.6%). Eating out with varying frequencies was prevalent among studied subjects, with only (22.1%) of them reporting that they rarely or never ate out. Eating snacks between meals was also a common dietary practice among the majority of the subjects (74.1%), with only (26.0%) reporting that they rarely or never ate snacks. Thus, the calculated mean ± standard deviation for a number of snacks/day was 1.20 ± 1.01. Regarding the number of main meals; more than half of the sample were having three meals daily (50.5%), and the average mean number ± standard deviation was 2.49 ± 0.064. More than half of the sample were inactive (57.7%), with the majority being females (58.1%). On the other hand, only (13.0%) reported being highly active, with the majority being males (53.5%).
Table 2: Lifestyle factors of the Studied Population in Jeddah, Saudi Arabia, 2012.
|
Life style Factors |
Total n(%) |
Males n=153(46.2%) |
|
Females n=178(53.8%) |
|||||||
| Breakfast Consumption : | |||||||||||
|
Never |
50 (15.3%) |
15(30.0%) |
|
35(70.0%) |
|||||||
|
Sometime |
109 (33.3%) |
47(43.1%) |
62(56.9%) |
||||||||
|
Always |
168 (51.4 %) |
88(52.4%) |
80(47.6%) |
||||||||
| Fast Food Consumption: | |||||||||||
|
Never |
83 (25.2%) |
32(38.6%) |
|
51(61.4%) |
|||||||
|
Sometime |
188 (57.1%) |
90(47.9%) |
98(52.1%) |
||||||||
|
Always |
|
58 (17.6%) |
31(53.4%) |
27(46.6%) |
|||||||
| Eating Out: ( Frequency /week) | |||||||||||
|
Never |
|
73 (22.1%) |
30(41.1%) |
|
43(58.9%) |
||||||
|
1-2 |
151 (45.6%) |
69(45.7%) |
82(54.3%) |
||||||||
|
3-5 |
57 (17.2) |
29(50.9%) |
28(49.1%) |
||||||||
|
>5 |
50 (15.1) |
25(50.0%) |
25(50.0%) |
||||||||
| Eating Snacks: ( Frequency /day) | |||||||||||
|
Never |
86 (26.0%) |
48(55.8%) |
38(44.2%) |
||||||||
|
Once |
134 (40.5%) |
62(46.3%) |
72(53.7%) |
||||||||
|
Twice |
82 (24.8%) |
28(34.1%) |
54(65.9%) |
||||||||
|
Three or more |
29 (8.8%) |
15(51.7%) |
14(48.3%) |
||||||||
|
Mean + SD |
1.19 ± 1.01 |
1.09 ± 1.02 |
1.28 ± 0.99 |
||||||||
| Number of meals: ( Frequency /day) | |||||||||||
|
One |
20 (6%) |
5(25.0%) |
15(75.0%) |
||||||||
|
Two |
137 (41.4%) |
58(42.3%) |
79(57.7%) |
||||||||
|
Three |
167 (50.5%) |
87(52.1%) |
80(47.9%) |
||||||||
|
Four or more |
7 (2.1%) |
3(42.9%) |
4(57.1%) |
||||||||
|
Mean + SD |
2.48 ± 0.64 |
2.57 ± 0.59 |
|
2.41 ± 0.67
|
|||||||
| Physical Activity: | |||||||||||
|
Inactive |
191 (57.7%) |
80(41.9%) |
111(58.1%) |
||||||||
|
Low |
62 (18.7%) |
26(41.9%) |
36(58.1%) |
||||||||
|
Medium |
35 (10.6%) |
24(68.6%) |
11(31.4%) |
||||||||
|
High |
43 (13.0%) |
23(53.5%) |
20(46.5%) |
||||||||
|
Mean + SD |
132.61±317.26 |
150.00 ± 286.32 |
|
117.66± 341.72
|
|||||||
| Smoking Habits: | |||||||||||
|
Non smokers |
169 (51.1%) |
56(33.1%) |
|
113(66.9%) |
|||||||
|
Smokers |
72 (21.8%) |
53(73.6%) |
19(26.4%) |
||||||||
|
Former smokers |
21 (6.3) |
16(76.2%) |
5(23.8%) |
||||||||
|
Passive smokers |
69 (20.8%) |
28(40.6%) |
41(59.4%) |
||||||||
Socio-demographic characteristics of obese and non-obese subjects in relation to BMI and WHR are presented in Table 3. Gender did not have a significant difference on general obesity (P =0.46). However, when comparing the effect of gender on central obesity, the difference was statistically significant (P < 0.001). Results indicated that more than half of subjects who suffered from central obesity were females (67.2%), as compared to only (32.8%) amongst males. On the other hand, the majority of those who were not centrally obese were males (62.8%) in comparison to females (37.2%). The age group between 18 to 34 years old had the highest percentage of non-obese subjects when both general as well as central obesity were considered (61.1%, 67.6%, respectively). Statistically, the difference was significant with a P value < 0.001. In contrast, those in the age group of 35 years or older had a higher percentage of general and central obesity. Educational level had an impact on measurements of obesity, with statistical significance regarding both BMI (P =0.03) and WHR (P =0.01). Secondary school and university degree holders showed a lower degree of general and central obesity as compared to others (P=0.03 , 0,01 respectively). Occupational status, ethnicity, nationality, household income, house ownership, and type, have not appreciably shown a significant association with BMI or WHR.
Table 3: Socio-Demographic Characteristics of Obese and Non Obese Adults in Jeddah, Saudi Arabia According to their Body Mass Index (BMI) and Waist to Hip Ratio (WHR), 2012.
| Socio-Demographic Characteristics |
BMI |
WHR |
||||||||
|
Non-Obese |
Obese |
P-value |
Non-Obese |
Obese |
P-value | |||||
| n |
(%) |
n |
(%) |
n |
(%) |
n |
(%) |
|||
| Gender: |
0.46 |
|
<0.001 |
|||||||
| Males |
98 |
47.8 |
55 |
43.7 |
93 |
62.8 |
60 |
32.8 |
||
| Females |
107 |
52.2 |
71 |
56.3 |
55 |
37.2 |
123 |
67.2 |
||
| Age: a |
<0.001 |
|
<0.001 |
|||||||
| 18-34 |
124 |
61.1 |
30 |
24.2 |
98 |
67.6 |
56 |
30.8 |
||
| 35-44 |
31 |
15.3 |
38 |
30.6 |
24 |
16.6 |
45 |
24.7 |
||
| 45-54 |
26 |
12.8 |
33 |
26.6 |
15 |
10.3 |
44 |
24.2 |
||
| 55+ |
22 |
10.8 |
23 |
18.5 |
8 |
5.5 |
37 |
20.3 |
||
| Ethnicity: |
0.58 |
|
0.08 |
|||||||
| Arabic tribes |
149 |
72.7 |
95 |
75.4 |
116 |
78.4 |
128 |
69.9 |
||
| Non Arabic |
56 |
27.3 |
31 |
24.6 |
32 |
21.6 |
55 |
30.1 |
||
| Nationality: |
0.11 |
|
0.79 |
|||||||
| Saudis |
112 |
54.6 |
80 |
63.5 |
87 |
58.8 |
105 |
57.4 |
||
| Non Saudis |
93 |
45.4 |
46 |
36.5 |
61 |
41.2 |
78 |
42.6 |
||
| Education: a |
|
0.03 |
|
0.01 |
||||||
| Illiterate , write and read |
7 |
3.4 |
12 |
9.5 |
5 |
3.4 |
14 |
7.7 |
||
| Primary and preparatory |
27 |
13.3 |
23 |
18.3 |
14 |
9.6 |
36 |
19.7 |
||
| Secondary |
93 |
45.8 |
44 |
34.9 |
67 |
45.9 |
70 |
38.3 |
||
| University+ |
76 |
37.4 |
47 |
37.3 |
60 |
41.1 |
63 |
34.4 |
||
| Occupation: a |
|
0.96 |
|
0.44 |
||||||
| Not working |
118 |
59.6 |
73 |
59.8 |
82 |
57.3 |
109 |
61.6 |
||
| Working |
80 |
40.4 |
49 |
40.2 |
61 |
42.7 |
68 |
38.4 |
||
| Jeddah districts: |
|
0.001 |
|
0.84 |
||||||
| North regular |
86 |
42.0 |
45 |
35.7 |
60 |
40.5 |
71 |
38.8 |
||
| North slum |
2 |
1.0 |
12 |
9.5 |
5 |
3.4 |
9 |
4.9 |
||
| South regular |
94 |
45.9 |
62 |
49.2 |
71 |
48.0 |
85 |
46.4 |
||
| South slum |
23 |
11.2 |
7 |
5.6 |
12 |
8.1 |
18 |
9.8 |
||
| Household income: a |
|
0.33 |
|
0.34 |
||||||
| Below 3,000 SAR |
23 |
12.1 |
8 |
6.7 |
10 |
7.2 |
21 |
12.3 |
||
| 3,000 – 5,000 SAR |
44 |
23.2 |
30 |
25.0 |
32 |
23.0 |
42 |
24.6 |
||
| 5,000 – 10,000 SAR |
68 |
35.8 |
47 |
39.2 |
58 |
41.7 |
57 |
33.3 |
||
| 10,000 – 20,000 SAR |
26 |
13.7 |
22 |
18.3 |
23 |
16.5 |
25 |
14.6 |
||
| Over 20,000 SAR |
29 |
15.3 |
13 |
10.8 |
16 |
11.5 |
26 |
15.2 |
||
| House ownership: a |
|
0.40 |
|
0.33 |
||||||
| Rent |
127 |
64.8 |
74 |
60.2 |
86 |
60.1 |
115 |
65.3 |
||
| Own |
69 |
35.2 |
49 |
39.8 |
57 |
39.9 |
61 |
34.7 |
||
| Housing: a |
0.15 |
|
0.63 |
|||||||
| Apartment |
152 |
77.3 |
106 |
86.2 |
113 |
79.0 |
145 |
82.4 |
||
| Villa |
35 |
17.9 |
14 |
11.4 |
25 |
17.2 |
24 |
13.6 |
||
| Public House |
9 |
4.6 |
3 |
2.4 |
5 |
3.5 |
7 |
4.0 |
||
Total might be less than 331 due to missing
Lifestyle factors including dietary habits, physical activity and smoking habits of obese and non-obese males in relation to their BMI and WHR categories are showed in Table 4. Participants’ breakfast consumption habit was only significantly related to WHR as a measure of obesity. The highest percentage of central obesity was observed with those who reported that they always eat breakfast (69.5%). On the other hand, subjects who never ate fast food had a higher percentage of central obesity in comparison to those who always ate fast food (25.0% Vs 11.7%). The Difference was statistically significant only when WHR (not BMI) was used as an obesity index with a p value equal to 0.04. However, the relationship between eating out with BMI and WHR were significant with a p value =0.01, and 0.02, respectively, so that those who never ate out forming a greater percentages of those with general and central obesity compared to those who ate out more than five times/week, consequently, the former group constituted a lower percentages of non-obese subjects compared to the latter (17.3% Vs 20.4%). Snacking frequency was inversely associated with BMI (p =0.02). Individuals who never ate snacks constitute a higher percentage of general obesity (40.0%), compared to those who ate 3 or more snacks/day (3.6%). Number of main meals consumed per day, and participants’ smoking habits showed no significant differences among obese and non-obese subjects when BMI or WHR were used as measures of obesity.
Table 4: Lifestyle Factors of Obese and Non Obese Adults in Jeddah , Saudi Arabia in Relation to Their Body Mass Index (BMI) and Waist to Hip Ratio (WHR) Among the Male , 2012.
| Life style Factors |
BMI |
WHR |
||||||||
|
Non-Obese |
Obese |
P-value |
Non-Obese |
Obese |
P-value | |||||
| n |
(%) |
n |
(%) |
n |
(%) |
n |
(%) |
|||
| Breakfast consumption: b |
0.06 |
|
0.03 |
|||||||
| Never |
12 |
12.6 |
3 |
5.5 |
13 |
14.3 |
2 |
3.4 |
||
| Sometimes |
24 |
25.3 |
23 |
41.8 |
31 |
34.1 |
16 |
27.1 |
||
| Always |
59 |
62.1 |
29 |
52.7 |
47 |
51.6 |
41 |
69.5 |
||
| Fast food consumption: |
0.21 |
|
0.04 |
|||||||
| Never |
19 |
19.4 |
13 |
23.6 |
17 |
18.3 |
15 |
25.0 |
||
| Sometimes |
55 |
56.1 |
35 |
63.6 |
52 |
55.9 |
38 |
63.3 |
||
| Always |
24 |
24.5 |
7 |
12.7 |
24 |
25.8 |
7 |
11.7 |
||
| Eating out: (Per week) |
0.01 |
|
0.02 |
|||||||
| Never |
17 |
17.3 |
13 |
23.6 |
15 |
16.1 |
15 |
25.0 |
||
| 1-2 |
44 |
44.9 |
25 |
45.5 |
36 |
38.7 |
33 |
55.0 |
||
| 3-5 |
17 |
17.3 |
12 |
21.8 |
22 |
23.7 |
7 |
11.7 |
||
| >5 |
20 |
20.4 |
5 |
9.1 |
20 |
21.5 |
5 |
8.3 |
||
| Eating snacks: (Per day) |
0.02 |
|
0.33 |
|||||||
| Never |
26 |
26.5 |
22 |
40.0 |
26 |
28.0 |
22 |
36.7 |
||
| Once |
43 |
43.9 |
19 |
34.5 |
37 |
39.8 |
25 |
41.7 |
||
| Twice |
16 |
16.3 |
12 |
21.8 |
18 |
19.4 |
10 |
16.7 |
||
| Three or more |
13 |
13.3 |
2 |
3.6 |
12 |
12.9 |
3 |
5.0 |
||
| Number of meals: |
|
0.13 |
|
0.13 |
||||||
| One |
3 |
3.1 |
2 |
3.6 |
3 |
3.2 |
2 |
3.3 |
||
| Two |
39 |
39.8 |
19 |
34.5 |
42 |
45.2 |
16 |
26.7 |
||
| Three |
56 |
57.1 |
31 |
56.4 |
46 |
49.5 |
41 |
68.3 |
||
| Four or more |
0 |
0.0 |
3 |
5.5 |
2 |
2.2 |
1 |
1.7 |
||
| Level of physical activity: |
|
0.03 |
|
0.17 |
||||||
| Inactive |
47 |
48.0 |
33 |
60.0 |
50 |
53.8 |
30 |
50.0 |
||
| Low |
16 |
16.3 |
10 |
18.2 |
11 |
11.8 |
15 |
25.0 |
||
| Medium |
16 |
16.3 |
8 |
14.5 |
16 |
17.2 |
8 |
13.3 |
||
| High |
19 |
19.4 |
4 |
7.3 |
16 |
17.2 |
7 |
11.7 |
||
| Smoking habits: |
|
0.90 |
|
0.08 |
||||||
| Non smokers |
38 |
38.8 |
18 |
32.7 |
37 |
39.8 |
19 |
31.7 |
||
| Smokers |
33 |
33.7 |
20 |
36.4 |
34 |
36.6 |
19 |
31.7 |
||
| Former smokers |
10 |
10.2 |
6 |
10.9 |
5 |
5.4 |
11 |
18.3 |
||
| Passive smokers |
17 |
17.3 |
11 |
20.0 |
17 |
18.3 |
11 |
18.3 |
||
bTotal might be less than 153 due to missing
Lifestyle factors of obese and non-obese females in relation to obesity categories based on their BMI and WHR are showed in Table 5. The difference was statistically significant, regarding eating snacks, only when WHR was used to categorize obesity (P value =0.04). Subjects who never ate snacks constituted a higher percentage of centrally obese individuals (24.4%), compared to people who ate snacks 3 or more times/week (5.7%). In relation to main meals, subjects who ate 3 meals/day constitute the highest percentage of generally obese subjects (53.5%). In contrst, people who ate two meals/day showed the highest percentage of non-obese subjects. The difference was statistically significant when BMI not WHR was used to categorize obesity (P= 0.01). Regarding physical activity, inactive subjects formed a higher percentage of obese people (68.3%), compared to non-obese subjects (49.1%). Pertaining to breakfast and fast food consumption, eating out, and participants’ smoking habits, the differences among obese and non-obese subjects were statistically insignificant whether BMI or WHR were used to reflect obesity.
Table 5: Lifestyle Factors of Obese and Non Obese Adults in Jeddah , Saudi Arabia in Relation to Their Body Mass Index (BMI) and Waist to Hip Ratio (WHR) Among the Females , 2012.
| Life style Factors |
BMI |
WHR |
||||||||
|
Non-Obese |
Obese |
P-value |
Non-Obese |
Obese |
P-value | |||||
| n |
(%) |
n |
(%) |
n |
(%) |
n |
(%) |
|||
| Breakfast consumption: c |
0.30 |
|
0.19 |
|||||||
| Never |
22 |
20.8 |
13 |
18.3 |
15 |
27.8 |
20 |
16.3 |
||
| Sometimes |
41 |
38.7 |
21 |
29.6 |
18 |
33.3 |
44 |
35.8 |
||
| Always |
43 |
40.6 |
37 |
52.1 |
21 |
38.9 |
59 |
48.0 |
||
| Fast food consumption: c |
0.26 |
|
0.34 |
|||||||
| Never |
26 |
24.5 |
25 |
35.7 |
12 |
21.8 |
39 |
32.2 |
||
| Sometimes |
62 |
58.5 |
36 |
51.4 |
33 |
60.0 |
65 |
53.7 |
||
| Always |
18 |
17.0 |
9 |
12.9 |
10 |
18.2 |
17 |
14.0 |
||
| Eating out: (Per week) |
0.71 |
|
0.62 |
|||||||
| Never |
27 |
25.2 |
16 |
22.5 |
15 |
27.3 |
28 |
22.8 |
||
| 1-2 |
46 |
43.0 |
36 |
50.7 |
26 |
47.3 |
56 |
45.5 |
||
| 3-5 |
19 |
17.8 |
9 |
12.7 |
9 |
16.4 |
19 |
15.4 |
||
| >5 |
15 |
14.0 |
10 |
14.1 |
5 |
9.1 |
20 |
16.3 |
||
| Eating snacks: (Per day) |
0.70 |
|
0.04 |
|||||||
| Never |
21 |
19.6 |
17 |
23.9 |
8 |
14.5 |
30 |
24.4 |
||
| Once |
42 |
39.3 |
30 |
42.3 |
24 |
43.6 |
48 |
39.0 |
||
| Twice |
34 |
31.8 |
20 |
28.2 |
16 |
29.1 |
38 |
30.9 |
||
| Three or more |
10 |
3.9 |
4 |
5.6 |
7 |
12.7 |
7 |
5.7 |
||
| Number of meals: |
|
0.01 |
|
0.36 |
||||||
| One |
13 |
12.1 |
2 |
2.8 |
6 |
10.9 |
9 |
7.3 |
||
| Two |
50 |
46.7 |
29 |
40.8 |
27 |
49.1 |
52 |
42.3 |
||
| Three |
42 |
39.3 |
38 |
53.5 |
22 |
40.0 |
58 |
47.2 |
||
| Four or more |
2 |
1.9 |
2 |
2.8 |
0 |
0.0 |
4 |
3.3 |
||
| Level of physical activity: |
|
0.54 |
|
0.01 |
||||||
| Inactive |
65 |
60.7 |
46 |
64.8 |
27 |
49.1 |
84 |
68.3 |
||
| Low |
21 |
19.6 |
15 |
21.1 |
13 |
23.6 |
23 |
18.7 |
||
| Medium |
6 |
5.6 |
5 |
7.0 |
5 |
9.1 |
6 |
4.9 |
||
| High |
15 |
14.0 |
5 |
7.0 |
10 |
18.2 |
10 |
8.1 |
||
| Smoking habits: |
|
0.24 |
|
0.97 |
||||||
| Non smokers |
68 |
63.6 |
45 |
63.4 |
34 |
61.8 |
79 |
64.2 |
||
| Smokers |
15 |
14.0 |
4 |
5.6 |
6 |
10.9 |
13 |
10.6 |
||
| Former smokers |
3 |
2.8 |
2 |
2.8 |
2 |
3.6 |
3 |
2.4 |
||
| Passive smokers |
21 |
19.6 |
20 |
28.2 |
13 |
23.6 |
28 |
22.8 |
||
Discussion
The findings of this study showed a significant association between lifestyle factors and obesity. Males who consumed snacks less frequently and were physically inactive, as well as females with a greater number of meals consumption had higher odds of general obesity. Central obesity in males increased with increasing breakfast intake and decreasing fast food consumption, while females who consumed snacks less frequently and were physically inactive appeared to be prone to central obesity. It was found that, males who ate out less often were more likely to suffer from both general and central obesity.
Our results also indicated that participants who never ate snacks had more likelihood of being obese in both genders; which is comparable to another study done in Saudi Arabia reporting that female participants who skipped snacks were obese.20 Types of snacks consumed have were also reported to have a great impact on prevalence of obesity.21 However, WHO reported that the association between frequency of snack consumption and obesity remains inconclusive.22 Thus, further research should take different factors into consideration while controlling for confounders (i.e. type of snacks and frequency of snack consumption).
An earlier study showed that 30% of female participants who ate 3 or more meals every day were generally more obese,23 which is similar to our results. However, in the present study the size of the meal was not specified, and it was not known whether interviewed subjects were following a weight reduction diet or not, both issues should be addressed and evaluated in future studies.
Unexpectedly, in the present study male participants who rarely or never ate fast food had higher odds of being centrally obese, in contrast to a study done on adults in US.24 Several factors are suspected to affect fast food relation to obesity including type of food served.25 Higher fat, energy and salt content in the food increases the tendency to obesity.26 This is typical in our traditional foods more than western fast food. According to the continually updated electronic Jeddah director index (the official website for Saudi tourism authority),27 we found that out of 165 restaurants; 111 served traditional type of food, while only 54 served western type of food. However, in the present study only western fast foods were assessed, which could explain our results. However, further studies are needed to clarify the matter. It could also be suggested that efforts to improve fast food quality should be directed towards the most common type of fast foods consumed by the community.
A study done in Brazil reported that males who never ate out were generally and centrally more obese than their counterparts, which is consistent with our results.28 As mentioned above, consumption of calories dense traditional foods at home might explain our results. Furthermore, our result showed that breakfast skipping is a protective factor against central obesity. In contrast, studies showed a higher prevalence of obesity in breakfast skippers explained by either inadequate energy intake compensated for by consuming higher numbers of snacks29 or by adapting sedentary behaviors.30,31 However, our traditional breakfast consists of items having high caloric value, which may explain our result. In addition, breakfast skippers might have little overall intake and/or smaller less frequent meals, leading to decrease total energy intake. In the present study it was not known if participants were following weight reduction diet or not. Hence, further study should assess total energy intake of the day together with dietary pattern.
Our findings showed that being a female is highly associated with central obesity (67% compared to 37% not centrally obese). Similar results were seen in another earlier Saudi study.5 Moreover, similar findings were reported in other middle eastern countries.32,33 This could be attributed to the effect of multiple pregnancies as reported in a Saudi study.34 However, another explanation could be that societies require females to have a particular ideal body image.35 This notion exerted stress on them to gain weight as reported in a study indicating that 70% of sampled females deliberately attempted to gain weight.36 All are possible issues that need to be considered carefully, making females the first-line candidate for obesity combat programs.
Furthermore, in the present study a high percentage of subjects were found to be physically inactive, and this was highly associated with general and central obesity as reported in other studies,32 especially among females in all age groups.37 Different types of exercise could also have different effects on energy expenditure, and hence weight. In the present study, type of activity was not investigated.
In conclusion ,there are gender differences in response to various possible effecting variables. Physical inactivity and several eating behaviors associated with obesity are very common in the community, and our study could be of help to modify lifestyle factors and improve public health. As a result of having different dietary pattern and certain eating behaviors which showed various relations to obesity, guidelines should be tailored specifically to each community to modify lifestyle factors and to combat obesity. A limitation of this study that could not be avoided is recall bias, under and over-estimation. Another limitation is the study design. In our cross-sectional study, element of causality was not established. Thus, further prospective studies are needed. Missing data is also a limitation. Interviews were conducted in one room together with the whole family present, so that parts of the information; such as smoking, snacking or even income; could have been intentionally with held to avoid reprimand or embarrassment. However, we believe that missing data does not derogate the importance of the results. The strong points of our study is its representativeness with extensive geographical variations. Also, using two measurements of obesity is a point of strength consistent with our method. To the extent of our knowledge, this is the first study that evaluated the relation between lifestyle factors and measures of obesity in Jeddah -Saudi Arabia amongst adult.
Acknowldgments
This study was approved and granted by the deanship of research at King Abdul-Aziz University – Jeddah – Kingdom of Saudi Arabia under grant number (429/094) as part of a larger research project guided by “Saudi Diabetes Study Research Group”- King Fahd Medical Research Centre. A special note of appreciation goes to Prof. Ashwak Abdul-latif; Professor of community medicine, who helped in this study and statistical analysis, and to Dr. Rajaa Mohammad Al-Raddadi, Consultant of Community Medicine & Director of Chronic and hereditary diseases at PH Directorate- Ministry of Health for helping in the design and other aspects of this study.
References
- World Health Orgniazation. Obesity and Overweight 2014 [cited 2014 August 18]. Available from: http://www.who.int/mediacentre/fact sheets/fs311/en/.
- Kopelman PG. Obesity as a medical problem. Nature. 2000;404(6778):635-43. Epub 2000/04/15. doi: 10.1038/35007508. PubMed PMID: 10766250.
- Centers for Disease Control and Prevention Defining Overweight and Obesity 2012 [cited 2014 August 18 ]. Available from: http://www.cdc.gov/obesity/adult/defining.html.
- Ng SW, Zaghloul S, Ali HI, Harrison G, Popkin BM. The prevalence and trends of overweight, obesity and nutrition-related non-communicable diseases in the Arabian Gulf States. Obes Rev. 2011;12(1):1-13. Epub 2010/06/16. doi: 10.1111/j.1467-789X.2010.00750.x. PubMed PMID: 20546144.
CrossRef - Al-Nozha MM, Al-Mazrou YY, Al-Maatouq MA, Arafah MR, Khalil MZ, Khan NB, et al. Obesity in Saudi Arabia. Saudi medical journal. 2005;26(5):824-9. Epub 2005/06/14. PubMed PMID: 15951877.
- Al-Hazzaa HM. Rising trends in BMI of Saudi adolescents: evidence from three national cross sectional studies. Asia Pac J Clin Nutr. 2007;16(3):462-6. Epub 2007/08/21. PubMed PMID: 17704028.
- de Koning L, Merchant AT, Pogue J, Anand SS. Waist circumference and waist-to-hip ratio as predictors of cardiovascular events: meta-regression analysis of prospective studies. Eur Heart J. 2007;28(7):850-6. Epub 2007/04/04. doi: 10.1093/eurheartj/ehm026. PubMed PMID: 17403720.
CrossRef - Ainy E, Azizi F. Women, occupation and cardiovascular risk factors: findings from the Tehran Lipid and Glucose Study. Public Health. 2007;121(12):950-3. Epub 2007/07/25. doi: 10.1016/j.puhe.2006.12.016. PubMed PMID: 17645903.
CrossRef - Erlichman J, Kerbey AL, James WP. Physical activity and its impact on health outcomes. Paper 2: Prevention of unhealthy weight gain and obesity by physical activity: an analysis of the evidence. Obes Rev. 2002;3(4):273-87. Epub 2002/12/03. PubMed PMID: 12458973.
CrossRef - Abalkhail B. Overweight and obesity among Saudi Arabian children and adolescents between 1994 and 2000. East Mediterr Health J. 2002;8(4-5):470-9. Epub 2004/12/18. PubMed PMID: 15603027.
- Al Qauhiz NM. Obesity among Saudi Female University Students: Dietary Habits and Health Behaviors. J Egypt Public Health Assoc. 2010;85(1-2):45-59. Epub 2010/11/16. PubMed PMID: 21073847.
- Dupuy M, Godeau E, Vignes C, Ahluwalia N. Socio-demographic and lifestyle factors associated with overweight in a representative sample of 11-15 year olds in France: results from the WHO-Collaborative Health Behaviour in School-aged Children (HBSC) cross-sectional study. BMC Public Health. 2011;11:442. Epub 2011/06/09. doi: 10.1186/1471-2458-11-442. PubMed PMID: 21649892; PubMed Central PMCID: PMCPmc 3123212.
CrossRef - Grais RF, Rose AM, Guthmann JP. Don’t spin the pen: two alternative methods for second-stage sampling in urban cluster surveys. Emerging themes in epidemiology. 2007;4:8. Epub 2007/06/05. doi: 10.1186/1742-7622-4-8. PubMed PMID: 17543102; PubMed Central PMCID: PMCPMC 1894792.
CrossRef - Henderson RH, Sundaresan T. Cluster sampling to assess immunization coverage: a review of experience with a simplified sampling method. Bull World Health Organ. 1982;60(2):253-60. Epub 1982/01/01. PubMed PMID: 6980735; PubMed Central PMCID: PMCPMC 2535957 sampling method, based on the random selection of 210 children in 30 clusters of 7 children each, to estimate immunization coverage levels. This article analyzes the results of this method in actual and computer simulated surveys. Results from 60 actual surveys conducted in 25 countries were available for analysis, for a total of 446 sample estimations of immunization coverage. 83% of the sample results had 95% confidence limits within + or – 10%, and none of the surveys had 95% confidence limits exceeding + or – 13%. In addition, 12 hypothetical population strata with immunization coverage rates ranging from 10%-99% were established for the purposes of computer simulation, and 10 hypothetical communities were established by allocating to them various proportions of each of the strata. These simulated surveys also supported the validity of the EPI method: over 95% of the results were less than + or – 10% from the actual population mean. The precision of this method, as estimated from the results of both actual and simulated surveys, is considered satisfactory for the requirements of the EPI. Among the actual surveys, the proportion of results whose confidence limits exceeded + or – 10% was greatest (50%) when immunization coverage in the sample was 45%-54%.
- Wold Health Orgnization. The EPI coverage survey training for middle-level managers 1991. Available from: http://www.webcitation.org/query.php?url=http://whqlibdoc.who.int/hq/1991/WHO_EPI_MLM_91.10. pdf &ref doi=10.1186/1742-7622-4-8.
- Wold Health Orgnization. Expanded Programme on Immunisation -Immunization coverage cluster survey – Reference manual 2005. Available from: http://www.webcitation.org/query.php?url=http://www.who.int/vaccines-documents/DocsPDF05/www767.pdf&refdoi=10.1186/1742-7622-4-8.
- Wold Health Orgnization. Description and comparison of the methods of cluster sampling and lot quality assurance sampling to assess immunization coverage 2001. Available from: http://www.webcitation.org/query.php?url=http://www.who.int/vaccines-documents/DocsPDF01/www592.pdf&refdoi=10.1186/1742-7622-4-8.
- Wold Health Orgnization. Body Mass Index ( Global Database on Body Mass Index) 2006 [cited 2014 22 August ]. Available from: http://apps.who.int/bmi/index.jsp?introPage=intro_3.html.
- World Health Organization. Waist Circumference and Waist-Hip Ratio ratio: report of a WHO expert consultation. Geneva: December , 2008.
- Nguyen BT, Powell LM. The impact of restaurant consumption among US adults: effects on energy and nutrient intakes. Public Health Nutr. 2014:1-8. Epub 2014/07/31. doi: 10.1017/s1368980014001153. PubMed PMID: 25076113.
CrossRef - bin Zaal AA, Musaiger AO, D’Souza R. Dietary habits associated with obesity among adolescents in Dubai, United Arab Emirates. Nutr Hosp. 2009;24(4):437-44. Epub 2009/09/02. PubMed PMID: 19721923.
- Farshchi HR, Taylor MA, Macdonald IA. Beneficial metabolic effects of regular meal frequency on dietary thermogenesis, insulin sensitivity, and fasting lipid profiles in healthy obese women. Am J Clin Nutr. 2005;81(1):16-24. Epub 2005/01/11. PubMed PMID: 15640455.
- World Health Organization, Food and Agriculture Organization. Diet , Nutrition and the Prevention of Chronic Diseases Geneva: , 2003.
- A.Kerkadi. Evaluation of nutritional status of United Arab Emirates University female students. Emirates Journal of Agricultural Science. 2003;12(2):42-50.
CrossRef - S.El-Ghazali, J.M.Ibrahim, B.M.Kanari, N.A.Ismail. The relationship between lifestyle and body mass index among university students in Kuwait. Egyptian Journal of Community Medicine. 2010;28:69-76.
- Musaiger AO, D’Souza R. Nutritional Profile of Local and Western Fast Foods Consumed in Bahrain. Ecol Food Nutr. 2007;46(2):143-61. doi: 10.1080/03670240701328150.
CrossRef - Jeddah Municipality Jeddah Directories 2014 [cited 2014 19 August]. Available from: http://www.jeddah.gov.sa/directories/index.php.
- Bezerra IN, Sichieri R. Eating out of home and obesity: a Brazilian nationwide survey. Public Health Nutr. 2009;12(11):2037-43. Epub 2009/05/13. doi: 10.1017/s1368980009005710. PubMed PMID: 19433008.
CrossRef - Musaiger AO, Al-Ahdal E. Social and dietary factors associated with obesity among women in Saudi Arabia. In: A. O. Musaiger, editor. Obesity in the Arab World. Bahrain: Arab Center for Nutrition 2010.
- Song WO, Chun OK, Obayashi S, Cho S, Chung CE. Is consumption of breakfast associated with body mass index in US adults? J Am Diet Assoc. 2005;105(9):1373-82. Epub 2005/09/01. doi: 10.1016/j.jada.2005.06.002. PubMed PMID: 16129078.
CrossRef - Keski-Rahkonen A, Kaprio J, Rissanen A, Virkkunen M, Rose RJ. Breakfast skipping and health-compromising behaviors in adolescents and adults. Eur J Clin Nutr. 2003;57(7):842-53. Epub 2003/06/25. doi: 10.1038/sj.ejcn.1601618. PubMed PMID: 12821884.
CrossRef - Al-Nozha MM, Al-Hazzaa HM, Arafah MR, Al-Khadra A, Al-Mazrou YY, Al-Maatouq MA, et al. Prevalence of physical activity and inactivity among Saudis aged 30-70 years. A population-based cross-sectional study. Saudi medical journal. 2007;28(4):559-68. Epub 2007/04/26. PubMed PMID: 17457478.
- World Health Organization. Global Health Observatory Data. Available from: http://apps.who.int/ghodata/.
- Al-Hazzaa HM, Abahussain NA, Al-Sobayel HI, Qahwaji DM, Musaiger AO. Lifestyle factors associated with overweight and obesity among Saudi adolescents. BMC Public Health. 2012;12:354. Epub 2012/05/18. doi: 10.1186/1471-2458-12-354. PubMed PMID: 22591544; PubMed Central PMCID: PMCPmc3433359.
CrossRef - Musaiger AO, Shahbeek NE, Al-Mannai M. The role of social factors and weight status in ideal body-shape preferences as perceived by Arab women. J Biosoc Sci. 2004;36(6):699-707. Epub 2004/11/13. PubMed PMID: 15535459.
- Al-Hazzaa HM. Prevalence and trends in obesity among school boys in Central Saudi Arabia between 1988 and 2005. Saudi medical journal. 2007;28(10):1569-74. Epub 2007/10/05. PubMed PMID: 17914521.
- Al-Nuaim AA, Al-Nakeeb Y, Lyons M, Al-Hazzaa HM, Nevill A, Collins P, et al. The Prevalence of Physical Activity and Sedentary Behaviours Relative to Obesity among Adolescents from Al-Ahsa, Saudi Arabia: Rural versus Urban Variations. Journal of Nutrition and Metabolism. 2012;2012:9. doi: 10.1155/2012/417589.
CrossRef


Web of Science Coverage
Emerging Sources Citation Index (ESCI)
2024 Journal Impact Factor: 1.1
Scopus Journal Metrics
CiteScore 2025: 2.6
CiteScore Details
Sustainable Nutrition: Food Systems, Nutrient Retention, and Public Health Impact
![]()
This journal is a member of, and subscribes to the principles of, the Committee on Publication Ethics (COPE)


