

Introduction
One of the most popular drinks in the world is coffee. The rise of coffee consumption is mainly caused by its distinctive taste, health benefits, social and historical factors.1 Arabica (Coffea arabica) and Robusta (Coffea canephora) are well known as the most widely cultivated coffee species in the world. Compared to Robusta, Arabica is recognized has a higher quality with a less bitter taste, an intense aroma, and lower caffeine content.2
Indonesia is one of the largest coffee producers in the world. In Indonesia, coffee is cultivated in several islands, including in Sumatra, Java, Bali, Flores and Sulawesi. Although majority cultivated coffee in Indonesia is Robusta, however its Arabica is still well known as one of the famous coffees in the world. For instance, Gayo-Sumatra Arabica coffee recently accepted a Geographical Indication certification from European Union.3
Arana et al., listed reports concerning application of metabolomics for classifying coffees based on their origins.4 Some of those reports used Indonesian coffees as the samples. Indonesian coffees have been successfully discriminated from other coffee samples by MS-based metabolomics approaches.5-8 Moreover, Indonesian coffees also were discriminated from coffees obtained from other countries using NMR-based metabolomics.9-11 However, none of the studies we are aware of, ever reported the use of metabolomics to discriminate Indonesian coffees that cultivated in the different regions, whereas this country has various coffees with the different tastes.
Arabica coffee taste of each Indonesian region is unique. For instance, Gayo-Sumatra coffee has a strong body taste with low acidity and savory taste, meanwhile Toraja-Sulawesi coffee has a well-balanced taste with sensation of chocolaty, sweet and herb taste.12 In chemical point of view, the various tastes of coffee indicate their different metabolite profiles since the taste of coffee is strongly related to its chemical composition. However, to the best of our knowledge, chemical information of Indonesian coffees in literature is still limited.
This research aims to differentiate the metabolite profiles of roasted Arabica coffees obtained from various Indonesia regions, including Gayo-Sumatra, Preanger-Java, Bajawa-Flores and Toraja-Sulawasi, using 1H NMR-based metabolomics approach. OPLSDA technique has been applied for classifying the coffees based on their origins. Meanwhile, the characteristic metabolites for each coffee were investigated with S-plot of two-classes PLSDA models. This report exhibited the ability of 1H NMR-based metabolomics in the discrimination of roasted Arabica coffees from one country that cultivated in different regions. Moreover, it revealed the diversity of Indonesian Arabica coffees and might lead to a better understanding of Indonesian coffees.
Materials and Methods
Chemicals and Reagents
Deuterated water (D2O), sodium-3-(trimethylsilyl)-2,2,3,3-tetradeuteriopropionate (TSP), KH2PO4 and K2HPO4 were purchased from Merck (Darmstadt, Germany).
Sample Preparations
This experiment was carried out using roasted Arabica coffee beans obtained from different Indonesian islands. A total of 24 fresh medium roasted coffees from Gayo-Aceh-Sumatra (6 samples), Bandung(Preanger)-West Java (6 samples), Bajawa-Flores (6 samples) and Toraja-Sulawesi (6 samples) were obtained from some companies/suppliers of Indonesian coffees. The detail information of the coffee origins was shown in Table 1. The roasted beans were further ground into powders less than 1 mm in size using Encore mill (Baratza, Bellevue, United States). The samples were extracted based on Wei et al.13 with slight modifications. 200 mg of ground roasted coffee in a plastic tube were mixed with 1 mL of deuterated water containing TSP 1.00 mM and then sonicated for 20 minutes. Afterward, the samples were incubated at 90 °C for 30 minutes, cooled on water for 10 minutes and followed with centrifugation for 5 minutes at 12,000 rpm. 400 μL of the supernatant was transferred to a new tube containing 100 μL of phosphate buffer (pH 5). The samples were then moved into 5 mm NMR tubes.
Table 1: Origins of Arabica roasted coffees analyzed in this report.
| Sample code | Coffee origin | Company/Supplier |
| GS1 | Gayo, Aceh, Sumatra | Ottencoffee |
| GS2 | Gayo, Aceh, Sumatra | JPW Coffee |
| GS3 | Gayo, Aceh, Sumatra | Infokopi |
| GS4 | Gayo, Aceh, Sumatra | Fulcaf Coffee |
| GS5 | Gayo, Aceh, Sumatra | Mr. O Coffee |
| GS6 | Gayo, Aceh, Sumatra | Coffindo |
| PJ1 | Bandung/Preanger, West Java, Java | JPW Coffee |
| PJ2 | Bandung/Preanger, West Java, Java | Coffindo |
| PJ3 | Bandung/Preanger, West Java, Java | Kopi Florist |
| PJ4 | Bandung/Preanger, West Java, Java | Eastindischekoffie |
| PJ5 | Bandung/Preanger, West Java, Java | Eastindischekoffie |
| PJ6 | Bandung/Preanger, West Java, Java | Eastindischekoffie |
| TS1 | Sapan, Toraja, Sulawesi | Ottencoffee |
| TS2 | Sapan, Toraja, Sulawesi | JPW Coffee |
| TS3 | Sapan, Toraja, Sulawesi | Infokopi |
| TS4 | Sapan, Toraja, Sulawesi | Mr. O Coffee |
| TS5 | Sapan, Toraja, Sulawesi | Eastindischekoffie |
| TS6 | Sapan, Toraja, Sulawesi | Coffindo |
| BF1 | Bajawa, Ngada, Flores | Ottencoffee |
| BF2 | Bajawa, Ngada, Flores | JPW Coffee |
| BF3 | Bajawa, Ngada, Flores | Infokopi |
| BF4 | Bajawa, Ngada, Flores | Eastindischekoffie |
| BF5 | Bajawa, Ngada, Flores | Coffindo |
| BF6 | Bajawa, Ngada, Flores | Fry and Roast |
Measurements of 1H NMR spectra
1H NMR spectra of the roasted coffee samples were measured by a Varian Unity INOVA-500 spectrometer (Agilent Technologies, Santa Clara, United States) operating at 500 MHz. The 1H NMR spectra were recorded with a presaturation pulse program using following parameters: time of acquisition = 2.72 s, delay of relaxation = 2 s, number of data points = 64 K, width of spectra = 8012 Hz, and number of scans = 128.
1H NMR spectra processing
1H NMR spectra processing was performed using ACD/Labs 12.0 software (ACD/Labs, Toronto, Canada). The 1H NMR spectra processing comprised Fourier transformation of free-induction decay (FID) data, baseline correction, chemical shift scaling, alignment and bucketing. All 1H NMR spectra were scaled to TSP signal and then aligned. Bucketing was performed by dividing the spectra into integrated bins with the equal width (0.04 ppm) within δ 0.50 – 10.00 ppm. Intelligent bucketing mode was applied in this bucketing process. The residual signals of water (δ 4.73 – 5.22 ppm) were excluded from the analysis. The signals of caffeine at δ 3.22 – 3.49 ppm and δ 3.82 – 3.88 ppm were also removed for avoiding spurious principal components (PCs) since their signals shift.14 The extracted data were normalized to a total integral to avoid dilution effects of samples.
Multivariate data analysis
The obtained data sets were then transferred into SIMCA-P version 12.0 (Umetrics, Umeå, Sweden) for the statistical multivariate analysis. The data were scaled with the Pareto scaling type. At first, the principal component analysis (PCA) was carried out for examining intrinsic variation in the data. Partial least square discriminant analysis (PLSDA) and orthogonal projection to latent structure-discriminant analysis (OPLSDA) were applied as primary methods for obtaining maximum separation among samples. The data sets of the roasted coffee were classified into 4 groups according to their geographical origins (Gayo, Preanger, Bajawa, and Toraja) and then examined using PLSDA or OPLSDA models. The variation explained by the models (R2X and R2Y) and the variation predicted by the models based on cross validation (Q2) were computed. The PLSDA and OPLSDA models were validated with a permutation test applying 200 iterations.
Results and Discussion
Metabolite Identification
The collected 1H NMR spectra were analyzed for identifying metabolites in the Indonesian roasted Arabica coffees. Caffeine, trigonelline, acetic acid, formic acid and 3 isomers of chlorogenic acids (3-caffeoyl quinic acid, 4-caffeoyl quinic acid and 5-caffeoyl quinic acid) were found as the most abundant metabolites in the samples. Proton signals of caffeine were easily detected in the spectra. The intense signals belong to the 3 N-methyl of caffeine were detected at δ 3.26, 3.45 and 3.88 ppm, meanwhile the signal corresponding to its aromatic proton was found at δ 7.83 ppm. The signals belonging to the protons of trigonelline were explicitly detectable in the spectra, as described in Fig. 1. The proton signals of trigonelline were identified in the spectra at δ 4.43, 8.09, 8.82, 8.84 and 9.12 ppm. Proton resonances of acetic acid and formic acid were found easily as strong singlet signals in the spectra at δ 1.98 and 8.46 ppm, respectively. The signals correspond to protons of chlorogenic acids were detected in the aliphatic and aromatic regions of 1H NMR spectra as depicted in Fig. 1.
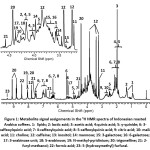 |
Figure 1: Metabolite signal assignments in the 1H NMR spectra of Indonesian roasted Arabica coffees. Click here to View figure |
Further investigation in the aliphatic region revealed the presence of other organic acids including lactic acid (δ 1.35 ppm), malic acid (δ 2.36 and 2.68 ppm), citric acid (δ 2.61 and 2.74 ppm) and quinic acid (δ 1.86, 1.96, 2.06, 3.56, 4.03 and 4.16 ppm). Broad signals belong to coffee lipids were also detected at δ 0.92 (methyl protons) and 1.30 ppm (methylene protons) as suggested by a previous report.10 Signals belong to ester cyclic of quinic acid, γ-quinide, were successfully detected at δ 1.95, 2.14, 2.41, 2.49, 3.89, 4.06 and 4.91 ppm. Inositol was also detected in the 1H NMR spectra (δ 3.28, 3.52, 3.62 and 4.06 ppm).
Other metabolites found in the aliphatic region were carbohydrates including α-(1-3)-L-arabino-furanose unit (3-arabinose), α-(1-5)-L-arabino-furanose unit (5-arabinose), β-(1-4)-D-manno-pyranose unit (mannose), β-(1-3)-D-galacto-pyranose unit (3-galactose), and β-(1-6)-D-galacto-pyranose unit (6-galactose). The signals corresponding to the carbohydrates were described in Fig. 1. Further analysis in the aromatic region of the 1H NMR spectra successfully identified several metabolites including N-methyl-pyridine (δ 4.37, 8.02, 8.52 and 8.77 ppm), choline (δ 3.20 ppm), 2-furyl-methanol (δ 4.56, 6.43 and 7.50 ppm) and 5-(hydroxymethyl)-furfural (δ 9.49 ppm). In this work, the characteristic signals of the identified metabolites were verified by comparing with corresponding reference spectra and further confirmed with NMR data of roasted and green bean coffees from the literature.10,13,15-19 The structures of some compounds identified in the coffee samples were documented in Fig. 2. Meanwhile, the characteristic signals of the identified metabolites in the 1H NMR spectra were depicted in Table 2.
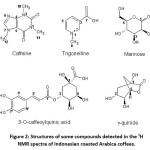 |
Figure 2: Structures of some compounds detected in the 1H NMR spectra of Indonesian roasted Arabica coffees. Click here to View figure |
Table 2: Characteristic signals of the identified metabolites in the 1H NMR spectra of Indonesian roasted Arabica coffees. GS: Gayo-Sumatera; PJ: Preanger-Java; BF: Bajawa-Flores; TS: Toraja-Sulawesi. + : detected.
| Metabolite | Chemical shift (ppm) | GS | PJ | BF | TS |
| 3-arabinose | 4.27 (br s), 5.25 (br s) | + | + | + | + |
| 5-arabinose | 4.21 (br s), 5.10 (br s) | + | + | + | + |
| 3-caffeoyl quinic acid | 2.04 (m), 2.16 (m), 5.40 (m), 6.35 (d), 6.82 (br s), 6.96 (m), 7.02 (m), 7. 51 (m) | + | + | + | + |
| 4-caffeoyl quinic acid | 2.04 (m), 2.16 (m), 4.92 (m), 6.35 (d), 6.82 (br s), 6.96 (m), 7.02 (m), 7.53 (m) | + | + | + | + |
| 5-caffeoyl quinic acid | 2.04 (m), 2.16 (m), 5.33 (m), 6.27 (d), 6.82 (br s), 6.96 (m), 7.02 (m), 7.48 (m) | + | + | + | + |
| 2-furyl-methanol | 4.58 (s), 6.43 (m), 7.57 (br s) | + | + | + | + |
| 5-(hydroxymethyl)-furfural | 9.49 (s) | + | + | + | + |
| 3-galactose | 3. 65 (m), 4.62 (d) | + | + | + | + |
| 6-galactose | 3.73 (m), 4.44 (br s) | + | + | + | + |
| Acetic acid | 1.98 (s) | + | + | + | + |
| Caffeine | 3.26 (s), 3.45 (s), 3.88 (s), 7.83(s) | + | + | + | + |
| Choline | 3.20 (s) | + | + | + | + |
| Citric acid | 2.61 (d), 2.74 (d) | + | + | + | + |
| Formic acid | 8.46 (s) | + | + | + | + |
| Lactic acid | 1.35 (d) | + | + | + | + |
| Lipids | 0.92 (m), 1.30 (m) | + | + | + | + |
| Malic acid | 2.36 (m), 2.68 (m) | + | + | + | + |
| Mannose | 3.55 (m), 3.82 (m), 3.93 (m), 5.17 (br s) | + | + | + | + |
| Inositol | 3.27 (t), 3.52 (m), 3.62 (m), 4.06 (m) | + | + | + | + |
| N-methyl-pyridine | 4.37 (s), 8.02 (m), 8.52 (t) and 8.77 (d) | + | + | + | + |
| Quinic acid | 1.89 (m), 1.96 (m), 2.06 (m), 3.56 (m), 4.03 (m), 4.16 (m) | + | + | + | + |
| γ-quinide | 1.95 (m), 2.14 (m), 2.41 (m), 2.49 (m), 3.89 (m), 4.06 (m), 4.91 (m) | + | + | + | + |
| trigonelline | 4.43 (s), 8.09 (t), 8.82 (m), 8.84 (m), 9.12 (s) | + | + | + | + |
Classification of the Indonesian roasted Arabica coffees
Metabolite profiles of Indonesian coffees from Gayo-Sumatra, Preanger-Java, Toraja-Sulawesi and Bajawa-Flores were investigated using chemometric approach. Data of the 1H NMR spectra were extracted and analyzed with multivariate statistical analysis. Since PCA (unsupervised method) did not give good classifications (data not shown), PLSDA and OPLSDA (supervised method) were chosen as the principal models. PLSDA applies a discrete class matrix and is based on the partial least squares (PLS) model, in which the dependent variable is selected to determine class identity.20 OPLSDA combines the strengths of PLSDA and soft independent modelling of class analogy (SIMCA) classification, thus enhance group separation and provide better explanation of variances among groups.21
PLSDA model of the roasted Indonesian coffees comprised 5 PLSDA components and explained 65.3% and 82.8% of total variations (R2X and R2Y, respectively). The model showed a weak predictive ability (Q2 = 33.4%), however the permutation test of the model showed the Q2 regression lines cut the y-axis at point below zero [Q2 = (0.00, -0.37); R2 = (0.00, 0.69)]. Therefore, the permutation test confirmed the statistical validity of the PLSDA model. The best class separation on score plot of the PLSDA model was obtained by combining PLS 2 and PLS 3 components as depicted in Fig. 3a. The score plot discriminated almost all roasted coffee samples based on their island origins. Moreover, Bajawa-Flores roasted coffees could be distinguished from the other coffee samples as documented in Fig. 3a.
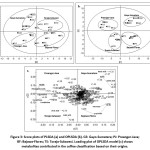 |
Figure 3: Score plots of PLSDA (a) and OPLSDA (b). GS: Gayo-Sumatera; PJ: Preanger-Java; BF: Bajawa-Flores; TS: Toraja-Sulawesi. Click here to View figure |
OPLSDA model of the roasted coffee samples was created for a better group separation. In total, the model had 5 OPLSDA components with R2X = 65.2%, R2Y = 82.2%, and Q2 = 37.1%. Score plot of the OPLSDA model showed 4 well-separated groups corresponding to their geographical origins as documented in Fig. 3b. The corresponding loading plot was investigated for identifying the discriminant metabolites in the classification. The loading plot (Fig. 3c) exhibited some identified metabolites giving important contributions to the classification, including chlorogenic acids, trigonelline, 3-arabinose, 5-arabinose, malic acid, citric acid, γ-quinide, mannose, N-methyl-pyridine, acetic acid, lactic acid and lipids.
Identifying characteristic metabolites for every coffee
In this work, metabolite profiles of the roasted coffees obtained from 4 regions including Gayo-Sumatra, Preanger-Java, Bajawa-Flores and Toraja-Sulawesi were investigated. The 4 coffees were chosen since each has a unique taste. Two-classes PLSDA models were created for evaluating characteristic metabolites for each Indonesian coffee. In total, 6 PLSDA models had been made and detail information of the models was summarized in Table 3.
Table 3: Information of two-classes PLSDA models of Arabica roasted coffee samples.
| No. | Samples | Number of PLSDA components | R2X (%) | R2Y (%) | Q2 (%) |
| 1. | Gayo-Sumatera and Preanger-Java | 3 | 68.1 | 95.4 | 74.7 |
| 2. | Gayo-Sumatera and Bajawa-Flores | 4 | 68.6 | 99.6 | 58.3 |
| 3. | Gayo-Sumatera and Toraja-Sulawesi | 3 | 59.8 | 98.7 | 70.8 |
| 4. | Preanger-Java and Bajawa-Flores | 3 | 58.3 | 98.5 | 80.8 |
| 5. | Preanger-Java and Toraja-Sulawesi | 4 | 60.4 | 99.6 | 67.4 |
| 6. | Bajawa-Flores and Toraja-Sulawesi | 4 | 64.1 | 99.6 | 78.7 |
To obtain a better evaluation of signals affecting the coffee differentiation, the S-plots of two-classes PLSDA models were investigated. Based on the corresponding S-plots, Gayo-Sumatra coffees were marked with acetic acid (bucket at δ 1.95 ppm), lactic acid (bucket at δ 1.33 ppm), lipids (buckets at δ 0.89 and 1.27 ppm), mannose (bucket at δ 3.93 ppm) and γ-quinide (bucket at δ 2.38 ppm) as depicted in Fig. 4a, 4b and 4c. Among them, buckets belong to acetic acid, lactic acid and lipids were always found as the discriminant metabolites in the differentiation of Gayo-Sumatra coffee from others. These results indicated that acetic acid, lactic acid and lipids were the characteristic metabolites of Gayo-Sumatra coffee. These characteristic compounds probably could be the candidate compounds contributing to the taste of coffee Gayo-Sumatra that possessing a strong body sensation and a savory taste. Lipids were correlated with the formation of coffee body.18,22 Besides that, lipids are surface-active agents contributing on the foam and emulsion formations of coffee brew and giving creamy sensation as well.19 Thus, it seems reasonable to suppose that abundant amounts of lipids in the Gayo-Sumatra coffee contribute significantly on the strong body sensation and savory taste of the coffee.
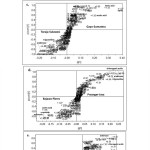 |
Figure 4: S-plots of two-classes PLSDA models of Indonesian Arabica roasted coffees: Gayo-Sumatera and Java-Preanger (a), Gayo-Sumatera and Bajawa-Flores (b), Gayo-Sumatera and Toraja-Sulawesi (c), Java-Preanger and Bajawa-Flores (d), Java-Preanger and Toraja-Sulawesi (e), Bajawa-Flores and Toraja-Sulawesi (f). Click here to View figure |
According to the corresponding S-plots (Fig. 4a, 4d and 4e), Preanger-Java coffees were characterized with chlorogenic acids (buckets at δ 6.32, 6.79, and 6.95 ppm), trigonelline (buckets at δ 4.40 and 8.79 ppm), 3-arabinose (bucket at δ 4.24 ppm) and 5-arabinose (bucket at δ 4.18 ppm). Interestingly, these compounds always were detected as the discriminant compounds in all corresponding S-plots indicating they were important markers for Preanger-Java coffees. The characteristic taste of Preanger-Java coffees is more sourness compared to the other coffees. Previous report depicted that chlorogenic acids are positively correlated with the sour taste of coffee.19 The finding chlorogenic acids as the marker of Preanger-Java coffees proposed that these compounds are possibly responsible compounds for the characteristic acidity taste of Preanger-Java coffees.
Corresponding S-plots of Bajawa-Flores coffees (Fig. 4b, 4d and 4f) were identified by quinic acid (buckets at δ 3.99 and 4.05 ppm), γ-quinide (buckets at δ 2.38 and 4.12 ppm), mannose (bucket at δ 3.93 ppm), malic acid (bucket at δ 2.60 ppm), citric acid (bucket at δ 2.74 ppm), lactic acid (bucket at δ 1.33 ppm) and lipids (buckets at δ 0.89 and 1.27 ppm). Among them, γ-quinide was found as the most important marker for Bajawa-Flores coffees, since the compound was detected giving significant contributions in all corresponding S-plot. Moreover, one of characteristic tastes of Bajawa-Flores coffee is the sensation of citrus aftertaste.12 Identification of citric acid as one of the characteristic compounds of Bajawa-Flores coffee might confirm its citrus aftertaste.
In the corresponding S-plots (Fig. 4c, 4e and 4f), the Toraja-Sulawesi coffees were attributed with trigonelline (buckets at δ 4.40 and 8.79 ppm), chlorogenic acids (buckets at δ 6.32, 6.79, and 6.95 ppm), malic acid (bucket at δ 2.60 ppm), acetic acid (bucket at δ 1.95 ppm), γ-quinide (buckets at δ 2.38 and 4.12 ppm) and mannose (bucket at δ 3.93 ppm). However, none of them was discovered as the discriminant compound in all corresponding S-plots. For instance, trigonelline was discriminant compound for Toraja-Sulawesi coffees when compared with Gayo-Sumatra and Bajawa-Flores coffees (Fig. 4c and 4f). However, this compound was not the discriminant compound when comparing Toraja-Sulawesi coffees with Preanger-Java samples (Fig. 4e), indicating the amounts of trigonelline in both coffees were similar. These results indicated that the coffees had a balance chemical composition which probably explains the well-balanced taste of the Toraja-Sulawesi coffees.
Conclusions
In this work, 1H NMR-based metabolomics, relying on OPLSDA modeling, successfully discriminated roasted Arabica coffees that cultivated in the different regions of Indonesia. Investigation on the S-plots of two classes PLSDA models revealed the characteristic compounds for each roasted Indonesian coffee. This study also provided scientific data for confirming the diversity of Indonesian Arabica coffees. Overall, our present study confirmed that 1H NMR-based metabolomics is a promising tool for discriminating roasted coffee metabolomes based on their origins.
Acknowledgments
We are grateful to East Indische Koffie for kindly supplying some coffee samples.
Funding
This study was funded by Institute for Research and Community Services (LPPM), Bandung Institute of Technology via RISET ITB 2017 Grant under research contract No. 108q/I1.C01/PL/2017.
Conflict of Interest
The authors declare no conflict of interest with any person or organization in publishing this article.
References
- Ayelign A., Sabally K. Determination of chlorogenic acids (CGA) in coffee beans using HPLC. Am J Res Commun. 2013;1(2):78-91.
- Lashermes P., Anthony F. Coffee. In: Kole, C. (Ed.). technical crops: genome mapping and molecular breeding in plants. Berlin. Springer, 2007;109-118.
- KOPI ARABIKA GAYO EU No: PGI-ID-02115 – 26.1.2016. Official Journal of the European Union. 2016; C 403.
- Arana V. A., Medina J., Esseiva P., Pazos D., Wist J. Classification of coffee beans by GC-C-IRMS, GC-MS, and 1H NMR. J Anal Methods Chem. 2016;2016(564584):01-11.
- Rodrigues C., Maguas C., Prohaska T. Strontium and oxygen isotope fingerprinting of green coffee beans and its potential to proof authenticity of coffee. Eur Food Res Technol. 2011; 232:361-373
- Rodrigues C., Maia R., Miranda M., Ribeirinho M., Nogueira J. M. F., Máguas C. Stable isotope analysis for green coffee bean: A possible method for geographic origin discrimination. J Food Compost Anal. 2009;22(5):463-471
- Santato A., Bertoldi D., Perini M., Camin F., Larcher R. Using elemental profiles and stable isotopes to trace the origin of green coffee beans on the global market. J Mass Spectrom. 2012;47(9):1132-1140.
- Valentin J. A, Watling R. J. Provenance establishment of coffee using solution ICP-MS and ICP-AES. Food chem. 2013;141(1):98-104.
- Arana V. A., Medina J., Alarcon R., Moreno E., Schaefer H., Wist J. Coffee’s country of origin determined by NMR: The Colombian case. Food chem. 2015;175:500-506.
- Consonni R., Cagliani L. R., Cogliati C. NMR based geographical characterization of roasted coffee. Talanta. 2012;88:420-426.
- Wei F., Furihata K., Koda M., Hu F., Kato R., Miyakawa T., Tanokura M. 13C NMR-based metabolomics for the classification of green coffee beans according to variety and origin. J Agric Food Chem. 2012;60(40):10118-10125.
- Wahyudi T., Jati W. Challenges of sustainable coffee certification in Indonesia. Seminar on the economic, social and environmental impact of certification on the coffee supply chain. International Coffee Council 109th 2012; London.
- Wei F., Furihata K., Hu F., Miyakawa T., Tanokura M. Complex mixture analysis of organic compounds in green coffee bean extract by two-dimensional NMR spectroscopy. Magn Reson Chem. 2010;48(11:857-865.
- D’Amelio N., Fontanive L., Uggeri F., Suggi-Liverani F., Navarini L. NMR reinvestigation of the caffeine–chlorogenate complex in aqueous solution and in coffee brews. Food Biophys. 2009;4(4):321–330.
- Alonso-Salces RM, Serra F, Reniero F, Heberger K. Botanical and geographical characterization of green coffee (coffea arabica and coffea canephora): chemometric evaluation of phenolic and methylxanthine contents. J Agric Food Chem. 2009;57(10):4224-4235.
- del Champo G., Berregi I., Caracena R., Zuriarrain J. Quantitative determination of caffeine, formic acid, trigonelline and 5-(hydroxymethyl)furfural in soluble coffees by 1H NMR spectrometry. Talanta 2010;81(1-2):367-371.
- Wei F., Furihata K., Hu F., Miyakawa T., Tanokura M. Two-dimensional 1H-13C Nuclear Magnetic Resonance (NMR)-based comprehensive analysis of roasted coffee bean extract. J Agric Food Chem. 2011;59(17):9065–9073.
- Wei F., Furihata K., Koda M., Hu F., Miyakawa T., Tanokura M. Roasting process of coffee beans as studied by nuclear magnetic resonance: time course of changes in composition. J Agric Food Chem. 2012;60(4):1005-1012.
- Wei F., Furihata K., Miyakawa T., Tanokura M. A pilot study of NMR-based sensory prediction of roasted coffee bean extracts. Food chem. 2014;152:363–369.
- Westerhuis J. A., Hoefsloot H. C. J., Smit S., Vis D. J., Smilde A. K., van Velzen E. J. J., van Duijnhoven J. P. M., van Dorsten F. A. Assessment of PLSDA cross validation. Metabolomics. 2008;4(1):81-89.
- Bylesjo M., Rantalainen M., Cloarec O., Nicholson J. K., Holmes E., Trygg J. OPLS discriminant analysis: combining the strengths of PLS-DA and SIMCA classification. Chemom. 2006;20(8-10):341-351.
- Buffo R. A., Cardelli-Freire C. Coffee flavour: an overview. Flavour and Fragr J. 2004;19(2):99-104.

This work is licensed under a Creative Commons Attribution 4.0 International License.


