Resistant Starch Content of Traditional Indian Legume Preparations
Madhuri Rajeev Nigudkar1* and Jagmeet Gurminder Madan2
1Department of Food and Nutrition , Sir Vithaldas Thackersey College of Home Science (Autonomous) SNDT Women’s University, Mumbai, India, 400049
2Department of Food and Nutrition , Sir Vithaldas Thackersey College of Home Science (Autonomous) SNDT Women’s University, Mumbai, India.
Corresponding Author Email: rvnigud@gmail.com
DOI : http://dx.doi.org/10.12944/CRNFSJ.5.3.08
Download this article as:
![]()
Foods rich in resistant starch RS can play an important role in the management of chronic diseases. Legumes contain higher amount of RS than cereals, roots and tubers. Therefore the current study was undertaken to estimate RS content of some commonly consumed Indian legume preparations. 26 cooked legume based products including 6 readymade traditional snacks were tested for their RS content using Megazyme Assay Kit for Resistant Starch. RS content was estimated for 100 g cooked food and for the cooked portion obtained by using 30 g of major ingredient. One way ANOVA with post hoc Tukey’s test was used to compare the mean RS content in one portion of different categories of legume preparations. Level of significance was set at p<0.05. RS content of four types of plain pressure cooked dhal, common to Indian cooking, was in the range of 1.21 g% to 2.16 g% whereas aamti, a thinner preparation of dhal contained RS in the range of 0.42 g% to 0.69 g%. In both types of dhal preparations, red gram dhal showed highest RS content followed by bengal gram dhal. Usal made using bengal gram kabuli contained 2.38 g% RS followed by 1.42 g% RS in bengal gram brown usal. RS in bengal gram flour based traditional recipes like zunka, dhirda and pithle was 1.23 g%, 1.48 g% and 0.09 g% respectively. When mean RS content of one portion of different categories of legume preparations was compared, there was no significant difference p≥0.05 found among any of the categories. The results of the study generated useful data with respect to RS content in 100 g as well as RS in one portion of legume preparations and identified preparations with red gram dhal, bengal gram kabuli and brown variety and lentil as relatively higher in RS content.
KEYWORDS:Estimation; Indian preparations; Legume; Resistant starch
Introduction
Resistant starch (RS) is the sum of starch and products of starch degradation that are not absorbed in the small intestine of healthy individuals.1,2 It is fermented in the large intestine of humans, with the production of short-chain fatty acids.3 Different types of RS ranging from RS1 to RS5 have been discussed in literature.1,2,4,5,6,7 The potential health benefits of consumption of RS have been highlighted in many studies. Its role in improving bowel health,1,8,9,10 decreasing food and energy intake,11,12 improving blood lipids13, 14, 15 and improving glucose and insulin responses16,17,18,19,20 in animals and humans have been demonstrated by many researchers.
Foods rich in RS, thus, can play an important role in the management of chronic diseases. Studies indicate that legumes can contribute significantly to the RS content of the diet as they contain higher amount of RS than cereals, roots and tubers.21 RS content in the legume products varies depending on the variety, type of processing and thermal treatment given.22 In Indian diet, variety of legumes is used as whole grains, as decorticated split legumes (dhals) or in the form of legume flour, in different preparations and there is a need to generate the data base with respect to their RS content. The data so generated, should have practical applicability so that these RS values can be used while analysing diet data in large food consumption studies to estimate RS intake by the study population or for the purpose of planning RS rich diets. Therefore, the current study was undertaken to estimate RS content of some commonly consumed Indian legume preparations and to identify the preparation with relatively higher RS content.
Materials and Methods
Sample
Preparations made from four types of dhal, seven types of whole grain legumes as well as bengal gram flour preparations, which are consumed in a typical Indian diet, were included in the study. In all, 26 cooked products including 6 readymade traditional snacks were tested for their RS content. Samples of each of the dhal, legumes, bengal gram flour as well as readymade snacks were procured from three market places located in Mumbai, which were then mixed in equal proportions to obtain a homogenous mixture. This was then used in the preparation of dhal and legume products which were prepared using the regular cooking methods commonly used in Indian cooking.
Plain pressure cooked dhal: decorticated split legumes were cooked in the pressure cooker after adding water in 1:2 (w/v) ratios. Salt was added to the cooked dhal and it was mashed to obtain a plain dhal with thick consistency. In case of bengal gram dhal with spinach, pressure cooked bengal gram dhal was added to spinach after sautéing spinach using oil and Indian spices.
Aamti: The traditional preparation of aamti was made using dhal that was first pressure cooked adding water in 1:2 (w/v) ratios. The cooked dhal was then seasoned with oil and Indian spices, and the desired consistency was obtained by adding extra water. Onions and/or tomato were used as per the requirement of the recipe.
Usal: Seven types of whole legumes, either sprouted or without sprouting, were used to prepare usal which is a treditional Indian preparation. Two varieties of green gram usal were prepared, one using sprouted green gram and the other using green gram without soaking and sprouting. Moth beans and field beans were soaked and sprouted before preparing usal, where as the rest of the legumes were just soaked and used in usal. In general the legumes were soaked for 8 to 10 hours and used or were allowed to sprout for 24 hrs after soaking. After pressure cooking, the processed legumes were seasoned using oil and Indian spices. Onions and/or tomato were added as per the requirement of the recipe.
Zunka, dhirda and pithle were prepared using bengal gram flour, following the traditional method of cooking these products and the rest of the products included in the study were purchased readymade from the market.
The amount of raw ingredients used and the final cooked weight of the preparation were recorded carefully.
Determination of Resistant starch
Resistant starch content was determined by using Megazyme Assay Kit for Resistant starch. The procedure was based on AOAC method 2002.02.23 Assay kit was purchased from Megazyme International Limited, Ireland. Cooked samples were ground into a paste after cooling them to room temperature and were then subjected to the procedure of estimating RS.
Food samples, weighing approximately 500 mg, were incubated in a shaking water bath with pancreatic α-amylase and amyloglucosidase (AMG) for 16 hrs at 37ºC. Equal volume of ethanol was then added and the RS was recovered as a pellet on centrifugation. This was then washed twice by suspension in ethanol (50%v/v), followed by centrifugation. Free liquid was removed by decantation. RS in the pellet was dissolved in 2M KOH by vigorously stirring in an ice water bath over a magnetic stirrer. This solution was neutralised with acetate buffer and the starch was quantitatively hydrolysed to glucose with AMG. D-Glucose was measured with glucose oxidase / peroxidise reagent (GOPOD). RS (g% in the sample ‘as eaten’) was calculated.
RS (g) per 100 g cooked food = glucose concentration in food sample (as obtained from standard curve) ×0.9×volume correction×1/1000×100/sample weight
Statistical Analysis
The RS content in grams per 100 g cooked food ‘as eaten’ was expressed as mean ± SD. 30 g of most of the legumes would be equivalent to approximately one 100 kcal exchange, which, in the current study was considered as one portion. Therefore, the RS content in the portion of food prepared using 30 g of major (raw) ingredient was also computed. One way ANOVA with post hoc Tukey’s test was used to compare the mean RS content in one portion of different categories of legume preparations. Level of significance was set at p<0.05.
Results
RS content of dhal, legume and bengal gram flour based preparations was estimated in the current study. Table 1 shows RS content of dhal preparations. This included plain, pressure cooked dhal with thick consistency and dhal aamti with relatively thinner consistency. The RS values are given as mean±SD. The table also gives the amount of dhal required to prepare 100 g cooked product. RS content in the table is expressed as RS g /100 g cooked food ‘as eaten’.
Table 1: Resistant starch content of dhal preparations
Food product and descriptionAmount of raw dhal per 100 g cooked product(g)RS in 100 g cooked product (g)
| Plain pressure cooked dhal | *** | *** | ||
| Red gram dhal – thick consistency | 33 | 2.16 ± 0.06 | ||
| Green gram dhal- thick consistency | 33 | 1.43 ± 0.02 | ||
| Bengal gram dhal– cooked but not mashed | 43 | 1.57 ± 0.02 | ||
| Bengal gram dhal with spinach- dhal not mashed | 21 | 0.79 ± 0.02 | ||
| Black gram dhal – thick consistency | 38 | 1.21 ± 0.03 | ||
| Aamti | ||||
| Red gram dhal aamti– medium thick | 20 | 0.69 ± 0.02 | ||
| Green gram dhal aamti – medium thick | 16 | 0.42 ± 0.02 | ||
| Bengal gram dhal aamti – medium thick | 19 | 0.63 ± 0.03 | ||
| Black gram dhal aamti– medium thick | 17 | 0.50 ± 0.03 | ||
| RS value presented as Mean ± SD | ||||
RS in plain pressure cooked dhal varied from 1.21± 0.03 g% in black gram dhal to 2.16± 0.06 g% in red gram dhal with green gram and bengal gram dhal having intermediate values of 1.43± 0.02 g% and 1.57± 0.02 g% respectively. Bengal gram dhal was also combined with spinach and it contained 0.79± 0.02 g% RS. The same dhals were also used to prepare aamti and the RS in aamti ranged from 0.42± 0.02 g% in green gram dhal aamti to 0.69± 0.02 g% in red gram dhal aamti with bengal gram dhal and black gram dhal aamti having 0.63± 0.03 g% and 0.50± 0.03 g% RS respectively.
Table 2 shows RS content of legume preparations. This includes usal prepared using whole legumes and some traditional preparations made using bengal gram flour. The RS values are given as mean±SD. The table also gives the amount of legumes or bengal gram flour required to prepare 100 g cooked product. RS content in the table is expressed as RS g / 100 g cooked food ‘as eaten’.
Table 2: Resistant starch content of legume preparations
| Food product and description | Amount of raw ingredient per 100g cooked product (g) | RS in 100g cooked product(g) |
| Usal made with whole legumes | ||
| Moth bean- sprouted, pressure cooked, sautéed | 24 | 0.94 ± 0.00 |
| Green gram- sprouted, pressure cooked, sautéed | 23 | 0.89 ± 0.04 |
| Green gram- pressure cooked, sautéed | 19 | 0.70 ± 0.02 |
| Lentil- soaked, pressure cooked, sautéed | 21 | 1.23 ± 0.03 |
| Cowpea – soaked, pressure cooked, sautéed | 31 | 0.82 ± 0.06 |
| Bengal gram (brown) – soaked, pressure cooked, sautéed | 35 | 1.42 ± 0.03 |
| Field beans- sprouted, pressure cooked, sautéed | 24 | 0.74 ± 0.02 |
| Bengal gram (kabuli)- soaked, pressure cooked, sautéed | 30 | 2.38 ± 0.3 |
| Ethnic food made using Bengal gram flour | ||
| Zunka– cooked with moist heat | 30 | 1.23 ± 0.03 |
| Dhirda– batter shallow fried | 38 | 1.48 ± 0.04 |
| Pithle– cooked with moist heat (medium thick) | 10 | 0.09 ± 0.01 |
RS value presented as Mean ± SD
With an exception of bengal gram (kabuli) usal which contained 2.38± 0.3 g% RS, the RS in the rest of the usal varities was found to be in the range of 0.70± 0.02 g% in green gram usal (not germinated) to 1.42± 0.03 g% in bengal gram (brown) usal. As seen in the table, bengal gram (kabuli and brown) usal and lentil usal showed higher RS values as compared to usal made from other legumes. RS content of zunka, dhirda and pithle was 1.23± 0.03 g%, 1.48±0.04 g% and 0.09± 0.01 g% respectively.
As seen in Table 1 and Table 2, the quantity of dhal / legume (major ingredient) required in the raw form to obtain 100 g cooked product varied depending on the type of food preparation. This poses difficulty in comparing different legumes for their RS content. Therefore, RS content in portions of cooked food prepared from same quantity of raw dhal or legume was computed.
Fig 1 shows the RS in a portion of cooked food prepared using 30 g of raw dhal / legumes. These RS values were derived from the values indicated in Table1 and Table 2.
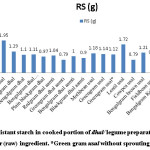 |
Figure 1: Resistant starch in cooked portion of dhal/ legume preparations prepared using 30g of major (raw) ingredient. *Green gram usal without sprouting Click here to View figure |
As seen in Figure 1, RS in one portion of different types of plain pressure cooked dhal ranged from 0.97 g in black gram dhal to 1.95 g in red gram dhal, with the values of 1.10 g and 1.11 g for bengal gram dhal and for vegetable prepared using ‘bengal gram dhal and spinach’ combination, respectively. RS in one portion of different aamti was between 0.79 g in green gram dhal aamti to 1.04 g in red gram dhal aamti whereas RS content of one portion of usal varied from 0.79 g in cowpea usal to 2.38 g in bengal gram (kabuli) usal. The two types of green gram usal showed similar RS content per portion, the values being 1.14 g and 1.12 g RS for ‘sprouted’ and for ‘not sprouted’ usal respectively. The RS values for one portion of zunka and dhirda, were very close, 1.23 g and 1.18 g respectively, which were also close to RS in one portion of plain pressure cooked bengal gram dhal as well as usal (brown).
Fig 2 gives the RS content of 100 g (which was considered as one portion in this study) of some traditional snacks that were bought from the market.
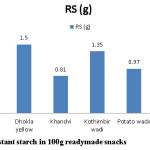 |
Figure 2: Resistant starch in 100g readymade snacks Click here to View figure |
Except for medu vada and potato vada the rest of the snacks contained bengal gram flour as the major ingredient and they were steamed products. The RS content in these products varied from 0.81 g% in khandvi to 1.50 g% in yellow dhokla. Potato vada with two RS sources (potato and bengal gram flour) also contained RS in the similar range (0.97 g%) whereas medu vada contained 0.42 g% RS.
Table 3: Comparison of mean RS content in one portion of different categories of legume preparations
| Category(preparation type) | RS (g)Mean ± SD |
| Plain pressure cooked dhal# | 1.284±0.39 |
| Aamti# | 0.933±0.11 |
| Usal# | 1.309±0.51 |
| Bengal gram flour products# | 1.205±0.04 |
| Readymade Bengal gram based snacks* | 1.168±0.28 |
# Mean RS in cooked portion made using 30g raw dhal/legume; *mean RS in 100g cooked snacks
Table 3 shows different categories of legume preparations. One way ANOVA with post hoc Tukey’s test was used to compare the mean RS content of these categories of legume preparations. Except for the category of readymade snacks, for all other categories, the mean RS value indicated in the table was computed by considering the RS in one portion of each of the foods in the category, (values indicated in Figure 1). In case of readymade snacks mean RS was computed considering the RS in 100 g snacks (values indicated in Figure 2). Pithle and Medu vada were excluded from this comparison as pithle showed exceptionally low RS content and medu vada did not fit in any of the categories.
Discussion
Traditional Indian diet includes variety of legumes in different forms. Plain pressure cooked red gram dhal (Sadha varan) with cooked rice is an integral part of traditional Maharashtrian meal. There are many vegetable preparations in which cooked dhal are added to enhance the palatability. Though data on RS content of some legumes is available in literature, there are not many studies that have estimated RS in dhal preparations. RS content of pressure cooked red gram dhal and green gram dhal reported in one study was 8.4±2.36 g and 8.6±0.06 g / 100g respectively.22 In the current study, among plain pressure cooked dhal, red gram dhal showed highest RS content (2.16 ± 0.06 g %) followed by bengal gram dhal. But RS in the vegetable preparation ‘bengal gram dhal with spinach’ was found to be 0.79±0.02 g% (Table1) which was almost half of the RS content of plain pressure cooked bengal gram dhal. This was expected, as the amount of dhal in100 g vegetable preparation was approximately half the amount that was required to make 100 g plain pressure cooked dhal (Table 1).
The observed range of RS for aamti was much lower than the range observed for plain pressure cooked dhal (Table 1), but similar to plain pressure cooked dhal, among the four types of aamti, red gram dhal aamti showed highest RS followed by bengal gram dhal aamti. In order to achieve the desired, thinner consistency of aamti, extra water was added in aamti which resulted in lesser amount of dhal in 100 g aamti as compared to the amount in plain cooked dhal. Thus the concentration of starch in aamti was less than starch in plain cooked dhal. Literature suggests that concentration of starch in a preparation can be an importent factor affecting RS 3 formation, higher starch concentration leading to more RS formation.3,24
With respect to legume preparations, RS values reported for cooked beans in the database by Murphy et al.,25 were in the similar range as observed for usal in the current study with cooked/canned chickpeas in the database showing 2.6 g% RS, the value close to 2.38± 0.3 g% RS in bengal gram (kabuli) usal (Table 2) in the current study. Chen et al.,26 reported RS content of boiled soyabean, common cowpea and garden pea, consumed in Chinese diet, to be 1.27 g, 3.72 g and 3.84 g respectively in 100 g esculent. In contrast, much higher values have been reported for commonly consumed cooked legume products in Swedish diet.27
Among all types of usal in the current study, bengal gram (kabuli and brown) usal and lentil usal showed higher RS content (Table 2). A study by Yadav et al.,21 on Indian legumes also reported higher RS in lentil and bengal gram as compared to RS in other legumes used in their study. Thus bengal gram and lentil may be identified as legumes with relatively higher RS content. Germination appears to reduce RS content of legumes to various extent.22,28 Unlike green gram and moth beans which are generally germinated before preparing usal, bengal gram and lentil, most often, are used without germination, which could be one of the reasons for the higher RS values observed for these usal.
RS content of bengal gram flour based preparations, with the exception of pithle was also found to be similar to bengal gram usal. Very low RS content of pithle could be attributed to the high amount of water added in the recipe to achieve the desired semi-solid consistency which led to dilution of starch in the recipe.
When RS in one portion of various dhal and legume preparations was computed (Figure 1), pressure cooked red gram dhal showed highest (1.95 g) RS content. Interestingly, RS in the portion of bengal gram dhal and in the portion of vegetable with ‘bengal gram dhal and spinach’ combination, prepared using 30 g bengal gram dhal, was similar (1.10 g and 1.11 g respectively) suggesting that RS content of a food used in different recipes may be similar if the amount used and the heat treatment given is the same.
RS in one portion of aamti prepared using different types of dhal was between 0.79 g to 1.04 g, the observed range being lower than the range for one portion of plain pressure cooked dhal (Figure 1). In spite of using same quantity of raw dhal (30 g) there was a difference in the RS range of these two types of preparations suggesting that there could be some other factors, other than the amount of dhal used, that may influence the RS content of the product. Aamti is much thinner than plain cooked dhal in which starch is not densely packed. Therefore it may be easier for the enzymes to act on starch and cause its hydrolysis, reducing the RS content. In contrast, densely packed food like pasta is considered to be a source of RS13 suggesting that densely packed foods may contain higher RS.
Though there was a difference in the RS content (per 100 g) of the two types of green gram usal (Table 2), both showed similar RS content in the portion that was prepared using 30 g whole (raw) green gram (Figure 1), once again suggesting that the amount of starchy ingredient in a preparation would be one of the major factors affecting RS content of the recipe.
Snacks prepared using bengal gram flour are an integral part of the Indian traditional diet. The RS content in these products varied from 0.81 g% in khandvi to 1.50 g% in yellow dhokla (Figure 2) and these values were very close to the RS values obtained for one portion of zunka and dhirda (Figure 1). Thus RS content of different products made from the same basic ingredient may be similar if the amount of ingredient used in the preparation is same and the processing treatment is similar.
In this study, potato vada showed RS content similar to the RS in bengal gram flour based products. Surprisingly RS in 100 g of medu vada prepared from black gram dhal was much lower (Figure 2) as compared to RS in one portion of plain pressure cooked black gram dhal (Figure 1). Medu vada is a fried snack and studies have reported decreasing effect of both, deep and shallow frying, on RS content.29,30 Fermentation process may also have a decreasing effect on RS content of foods.31 Batter for medu vada is usually made by partially fermenting soaked and ground black gram dhal which might have improved the digestibility of starch and reduced the RS content in medu vada.
In the current study, legume preparations were categorised (Table 3) as plain pressure cooked dhal category which included four types of dhal and ‘bengal gram with spinach’ preparation, category of aamti which included four types of aamti, usal category which included eight usal preparations, category of bengal gram flour products which included zunka and dhirde and a category of readymade snacks. The foods, in this study, were categorised based on the type of preparation rather than based on types of legumes, considering that an individual, over a period of time, would consume a variety of dhal or legumes as aamti or as usal, rather than a single legume type.
There was no significant difference (p≥0.05) in the mean RS content of one portion of any of the categories of legume preparations. Though, as discussed earlier, the RS range for aamti was lower than the RS range for plain pressure cooked dhal, the mean RS per portion of these two categories was not significantly different (Table 3). This could be because both these categories included same varieties of dhal and the quantity of dhal per portion was also same (30 g). When categories of bengal gram flour preparations were compared, the mean RS content (1.205±0.04 g) in one portion of bengal gram flour preparation was not significantly different from mean RS (1.168±0.28 g) in one portion of readymade bengal gram flour based snacks. Similarly, presence of green gram and bengal gram in all the three categories i. e. plain pressure cooked dhal, aamti and usal may be responsible for not finding significant differences among the mean RS content of these categories. Thus the result once again suggested that the type and the quantity of raw ingredient used in a preparation could be major factors affecting the RS content of any preparation.
Conclusion
The results of the study generated useful data with respect to RS content in 100 g legume preparations which was in the range of 1.21 g to 2.16 g for pressure cooked dhals, 0.42 g to 0.69 g for aamti, and 0.70 g to 2.38 g for different usal preparations. Based on the RS content of one portion, red gram dhal, Bengal gram (kabuli and brown) and lentil preparations were identified as preparations with relatively higher RS content. The results also suggested that the RS content of different types of preparations may be similar if the type and quantity of legumes used in these preparations is same.
Acknowledgments
The authors wish to thank the authorities of NFB Laboratory, Wadala, Mumbai, India, for permitting the researchers to use the facility for the analytical work.
References
- Brown I. Complex Carbohydrates and Resistant Starch. Nutrition Reviews. 1996;54(11):S115-S119.
CrossRef - Sajilata M. G, Singhal R. S, Kulkarni P. R. Resistant Starch – A Review.Comprehensive Reviews in Food Science and Food Safety; 5(1): 01-17: (2006)
- Nugent A. P. Health Properties of Resistant Starch. Nutrition Bulletin. 2005;30(1):27-54.
CrossRef - Englyst H. N, Kingman S. M, Cummings J. H. Classification of Nutritionally Important Starch Fractions. European Journal of Clinical Nutrition. 1992;46(2):S33-S50
- Storey D, Lee A, Bornet F, Brouns F. Gastrointestinal Responses Following Acute and Medium Term Intake of Retrograded Resistant Maltodextrines, Classified as Type 3 Resistant Starch. European Journal of Clinical Nutrition. 2007;61:1262-1270.
CrossRef - Wac3aw Leszczynski. Resistant Starch- Classification, Structure, Production. Polish Journal of Food and Nutrition Sciences. 2004;13(54):37-50.
- Birt D. F, Boylston T, Hendrich S, Jane J. L, Hollis J, Li L, McClelland J, Moore S, Phillips G. J, Rowling M, Schalinske K, Scott M. P, Whitley E. M. Resistant Starch: Promise for Improving Human Health. Advances in Nutrition. 2013;4(6):587-601.
CrossRef - Topping D. L, Fukushima M, Bird A. R. Resistant Starch as Prebiotic and Synbiotic: State of the Art.Proceedings of the Nutrition Society. 2003;62(1):171-176.
CrossRef - Martinez I, Kim J, Duffy P. R, Schlegel V. L, Walter J. Resistant Starches Types 2 and 4 Have Differential Effects On the Composition of the Fecal Microbiota in Human Subjects. PLoS One. 2010;5(11):e15046.
CrossRef - Walker A. W, Ince J, Duncan S. H, Webster L. M, Holtrop G, Ze X, Brown D, Stares M. D, Scott P, Bergerat A, Louis P, McIntosh F, Johnstone A. M, Lobley G. E, Parkhill J, Flint H. J. Dominant and Diet-Responsive Groups of Bacteria Within the Human Colonic Microbiota. The ISME Journal. 2011;5(2):220–230.
CrossRef - Zhou J, Hegsted M, McCutcheon K. L, Keenan M. J, Xi X, Raggio A. M, Martin R. J. Peptide YY and Proglucagon mRNA Expression Patterns and Regulation in the Gut.Obesity. 2006;14(4):683-689.
CrossRef - Bodinham C. L, Frost G. S, Robertson M. D. Acute Ingestion of Resistant Starch Reduces Food Intake in Healthy Adults. British Journal of Nutrition. 2010;103(6):917–922.
CrossRef - De Deckere E. A. M, Kloots W. J, Van Amelsvoort J. M. M. Resistant Starch Decreases Serum Total Cholesterol and Triacylglycerol Concentrations in Rats.Journal of Nutrition. 1993;123(12): 2142-2151.
- Lopez H. W, Lebrat-Verny M. A, Coudray C, Besson C, Krespine V, Messager A, Demigne C, Remesy C. Class 2 Resistant Starches Lower Plasma and Liver Lipids and Improve Mineral Retention in Rats.Journal of Nutrition. 2001;131(4):1283-1289.
- False Liu X, Ogawa H. Hypolipidaemic Effect of Maize Starch With Different Amylose Content in Ovariectomized Rats Depends on Intake Amount of Resistant Starch. British Journal of Nutrition. 2009;101(3):328-339.
CrossRef - Behall K. M, Hallfrisch J. Plasma Glucose and Insulin Reduction after Consumption of Breads Varying in Amylose Content.European Journal of Clinical Nutrition. 2002;56(9):913-920.
CrossRef - Aziz A. A, Kenney L. S, Goulet B, Abdel-Aal E. S. Dietary Starch Type Affects Body Weight and Glycemic Control in Freely Fed but Not Energy-Restricted Obese Rats.Journal of Nutrition. 2009;139(10):1881-1889.
CrossRef - Li M, Piao J. H, Tian Y, Li W. D, Li K. J, Wang X. G. Postprandial Glycaemic and Insulinaemic Responses to GM-Resistant Starch-Enriched Rice and the Production of Fermentation-Related H2 in Healthy Chinese Adults.British Journal of Nutrition. 2010;103:1029-1034.
CrossRef - Behall K. M, Scholfield D. J, Hallfrisch J. G, Elmstahl L. H. G. Consumption of Both Resistant Starch and Beta-Glucan Improves Postprandial Plasma Glucose and Insulin in Women. Diabetes Care. 2006;29(5):976-981.
CrossRef - Robertson M. D, Currie J. M, Morgan L. M, Jewell D. P, Frayn K. N. Prior Short-Term Consumption of Resistant Starch Enhances Ppostprandial Insulin Sensitivity in Healthy Subjects. Diabetologia. 2003;46(5):659-665.
CrossRef - Yadav B. S, Sharma A, Yadav R. B. Resistant Starch Content of Conventionally Boiled and Pressure Cooked Cereals, Legume and Tubers. Journal of Food Science and Technology. 2010;47(1):84-88.
CrossRef - Katyal D, Ghugre P. S, Udipi S. Resistant Starch in Selected Raw and Processed Legumes. Journal of Food Science and Technology. 2005;42(6):506-510.
- McCleary B. V, Monagham D. A. Measurement of Resistant Starch. Journal of AOAC International. 2002;85:665-675.
- Evans A. Resistant Starch and Health. Encyclopedia of Food Grains, second edition. 2016;(2):230-235.
CrossRef - Murphy M. M, Douglass J. S, Birkett A. Resistant Starch Intakes in the United States. Journal of American Dietetic Association. 2008;108(1):67-78.
CrossRef - Chen L, Niu R, Qin C, Meng Y, Zhang J, Wang Y, Xu G. Sources and Intake of Resistant Starch in the Chinese Diet.Asia Pacific Journal of Clinical Nutrition. 2010;19(2):274-282.
- Elmstahl H. L. Resistant Starch Content in a Selection of Starchy Foods on the Swedish Diet. European Journal of Clinical Nutrition. 2002;56(6):500-505.
CrossRef - Kavita V, Verghses S, Chitra G. R, Prakash J. Effect of Processing, Storage Time and Temperature on the Resistant Starch of Food. Journal of Food Science and Technology. 1998;35(4):299-304.
- Mahmood I, Ghugre P. S, Udipi S. A. Resistant Starch in Raw and Processed Roots and Tubers. Journal of Food Science and Technology. 2006;43(3):282-285.
- Yadav B. S. Effect of Frying, Baking and Storage Conditions on Resistant Starch Content of Foods. British Food Journal. 2011;113(6):710-719.
CrossRef - Yadav B. S, Sharma A, Yadav R. B. Study of Effect of Natural Fermentation on the Resistant Starch Content of Legume Based Fermented Foods. Journal of Agricultural Technology. 2007;3(1):21-27.
Accepted on: 20-12-2017
Final Approval by: Prof. Min-Hsiung Pan


Web of Science Coverage
Emerging Sources Citation Index (ESCI)
2024 Journal Impact Factor: 1.1
Scopus Journal Metrics
CiteScore 2025: 2.6
CiteScore Details
Sustainable Nutrition: Food Systems, Nutrient Retention, and Public Health Impact
![]()
This journal is a member of, and subscribes to the principles of, the Committee on Publication Ethics (COPE)


