Functional Properties of Yellowfin Tuna (Thunnus albacares) Skin Collagen Hydrolysate Fraction obtained by Ultrafiltration Purification
 , Hong Minh Xuan Nguyen1, Kha Hoang Nam Nguyen3 and Tuyen Chan Kha1*
 1Faculty of Chemical Engineering and Food Technology, Nong Lam University Ho Chi Minh City, Vietnam.
2Faculty of Fisheries, Ho Chi Minh City University of Food Industry, Vietnam.
3Faculty of Fisheries, Nong Lam University Ho Chi Minh City, Vietnam.
Corresponding Author Email: khachantuyen@hcmuaf.edu.vn
DOI : http://dx.doi.org/10.12944/CRNFSJ.9.3.12
Download this article as:
![]()
Hydrolyzed collagen with different fractions is broadly applied in various industries due to its functional properties. The study aimed to purify and fractionate the hydrolyzed collagen from yellowfin tuna skin by ultrafiltration and evaluate the functional properties of its fractions. The effect of temperature, pH, and pressure on membrane flux, nitrogen recovery efficiency, and degree of separation was investigated. Afterward, several functional properties of hydrolyzed collagen fractions including solubility, emulsification, foaming, and antioxidant properties were evaluated. The optimum ultrafiltration conditions for hydrolyzed collagen were temperature 25 °C, pH 6.5 and pressure 12 psi provided optimum membrane flux (3.4 L/m2.h) and nitrogen recovery efficiency (80.81%), and the smallest degree of separation (27.45%). The products after ultrafiltration were separated into two fractions, F1 (less than 3 kDa), and F2 (3-5 kDa), with the volume of 10% and 90%, respectively. Both hydrolyzed collagen fractions were more than 96% soluble at pH below 8.0, where the F2 fraction dissolved better than F1. As pH was higher than 8.0, both fractions were almost completely dissolved. In addition, the emulsifying and foaming abilities of the F1 fraction were better than the F2. However, the F2 fraction was more resistant to oxidation with higher antioxidant activity. In conclusion, this research indicates that different fractions from hydrolyzed collagen from yellowfin tuna skin have various functional properties that could be applied in food, cosmetic and pharmaceutical industries.
KEYWORDS:Collagen Hydrolysate; Functional Properties; UFP-1-C-6 Membrane; Ultrafiltration; Yellowfin Tuna Skin
Introduction
The collagen extraction from fish skin and its composition, structure, and properties have been reported all over the world.1–4 However, there have been just a few publications describing the properties of hydrolyzed collagen from fish skin, especially about the purification and fractionation of hydrolyzed collagen under a pilot or industrial scale. Most studies used gel filtration chromatography1 or precipitation method5 for hydrolyzed collagen purification, which is only applicable on small-scale. Simultaneously, the precipitation method is not effective with hydrolyzed collagen because there are different peptide segments in hydrolyzed collagen. Enzymatic proteolysis was investigated as an alternative to improve productivity and obtain bioactive peptides with nutritional composition and functional properties.6
After proteolysis, it is desirable to fractionate bioactive peptides for further applications. It is well-known that ultrafiltration membrane is one of the most effective techniques to separate peptide fractions. Ultrafiltration membranes, that have pore sizes in the range of 1 to 100 nm, are used to separate peptide fractions with molecular weights from 1 to 100 kDa and bioactive compounds efficiently.7 The collagen hydrolysate usually has a molecular weight of less than 20 kDa. In order to obtain collagen peptide fractions with the target molecular weights, it is important to investigate ultrafiltration conditions.
It is reported that membrane flux, degree of separation, and efficiency of the recovery of peptide fractions are the most important parameters of ultrafiltration conditions.7 However, those parameters are influenced by several factors such as temperature, pressure, and pH. Temperature affects the viscosity and micelle formation of the filtrate. As the temperature increases, the viscosity decreases, and the membrane flux increases. If the temperature is too high, the micelle formation increases, increasing the degree of separation of the membrane,8 denaturing the protein, and reducing its biological activity. The filter pressure for tangential flow provides a scouring dynamic that limits the accumulation of non-permeable components on the membrane surface, and thus the permeability flux is maintained at a constant level. pH value is also one of the key parameters affecting the membrane flux and degree of separation of the membrane due to the change of electrically charged capacity, structure, and shape of peptides.9 Therefore, it is necessary to investigate ultrafiltration conditions during purification and fractionation of bioactive peptides from collagen hydrolysate with target composition and functional properties.
For applications, hydrolyzed collagen is applied widely in the production of functional foods, cosmetics, and pharmaceuticals.10-12 For example, hydrolyzed collagen combined with chitosan has been successfully reported improving the property of the resultant film that prevents water absorption from surroundings. Hydrolyzed collagen can prevent dehydration in cheese production. In dairy products, hydrolyzed collagen can be used to enhance the smoothness and viscosity of the product.13 In addition, small molecular weight hydrolyzed collagen, expresses good solubility and some functional activities such as antioxidant, anticoagulant,14 and antibacterial abilities.15 It can also stimulate certain hormones to heal wounds and arthritis.16 As such, it is important to determine the functional properties of the obtained hydrolyzed collagen for a specific application.
Together with the above-mentioned background, yellowfin tuna (Thunnus albacares) was selected for this study due to its significant market-share in the fishery industry, which releases a considerable amount of skin.17 It is highly recommended to utilize yellowfin tuna skin from fishery processing to produce bioactive peptides with determined functional properties for ease of application. Therefore, this study aimed to purify and fractionate the hydrolyzed collagen from yellowfin tuna skin by ultrafiltration method and evaluate the functional properties of its fractions.
Materials and Methods
Materials
Yellowfin tuna skin (Thunnus albacares) was provided by JK Fish company, Ltd (Khanh Hoa Province, Vietnam). Alcalase® 2.5L PF was purchased from Novozymes (Denmark). The UFP-1-C-6 membrane (GE, USA) and QuixStand Benchtop System (GE, USA) were used for ultrafiltration and fractionation. Other chemicals were of analytical grade and obtained from Merck (Germany) and Sigma-Aldrich (USA).
Extraction of Collagen Hydrolysate from Yellowfin Tuna Skin
The yellowfin tuna skin was pretreated by removing leftover meats and scales, cutting into 1 × 1 cm pieces, washing with cold water (10 °C), and letting drained. Next, the fish skin was removed non-collagen component by treating in 0.93 N NaOH solution with a 1:5 ratio (w/v) at 4 °C during 28 hours and then neutralized by washing with distilled water.18 After draining, the sample was minced by a screw blender with a 0.5-cm hole diameter. The fish skin was hydrolyzed with 0.034 AU/g enzyme alcalase at 54.7 °C, pH 7.9, in a 1:1 (v/w) ratio of water/skin for 5.2 hours.19 After that, the mixture was heated at 95 °C for 15 min to inactivate the enzyme. The solution obtained after inactivating enzyme was cooled down to 4 °C, then vacuum filtered using Whatman filter paper 4 and centrifuged (Hermle, Germany) at 5000 rpm, 4 °C for 20 min. The obtained supernatant was called collagen hydrolysate (CH) and stored at 4 °C prior to using in this study.
Purification and Fractionation of Collagen Hydrolysate by Ultrafiltration
The effect of temperature, pH, and pressure during ultrafiltration (QuixStand Benchtop System, GE, USA) was investigated by three individual randomized one-factorial experiments and in triplicate. The volume of CH samples for each treatment was 3000 mL. The input flow rate of 1.5 L/min and the filtration time of 30 min (from film stabilization) were applied in these experiments. The effect of investigated factors on the membrane flux, degree of separation, and nitrogen recovery efficiency was evaluated. After ultrafiltration, several functional properties of hydrolyzed collagen fractions including solubility, emulsification, foaming, and antioxidant properties were evaluated.
Effect of Temperature
The investigated factor in this experiment was temperature with 7 levels (5; 10; 15; 20; 25; 30 and 35 °C). Other ultrafiltration parameters were fixed, including pH 7.0, the input pressure of 10 psi, and transmembrane pressure (TMP) of 9 psi.
Effect of Pressure
The investigated factor in this experiment was pressure with 5 levels (6, 8, 10, 12, and 14 psi). The fixed factors were temperature (selected from experiment effect of temperature), and pH 7.0.
Effect of pH
Different pH values of 6.0, 6.5, 7.0, 7.5, and 8.0 were investigated. The fixed factors were temperature (selected from experiment effect of temperature), and pressure (selected from experiment effect of pressure).
Methods for Analysis
Proximate Analysis
Protein, lipid, moisture, and ash contents were determined by method AOAC 2011.04 : 2011,20 AOAC 960.39: 2012,21 AOAC 950.46: 2000,22 and AOAC 920.153: 2007,23 respectively.
Molecular Weight Distribution
Gel permeation chromatography (GPC) (HPLC system, Agilent 1200, USA) was used to determine the molecular weight of collagen hydrolysate. The system employed Ultrahydrogel column (WatersTM), RID sensor, and polyethylene glycol for standard.24 The mobile phase containing 0.1% trifluoroacetic acid in water was run at a 1 mL/min flow rate.
Degree of Separation
The degree of separation was determined according to Shishegaran et al.8 with some modifications. The degree of separation is a quantity representing the ability to separate molecules with different molecular masses dissolved in a liquid phase or small solid constituents from the liquid or gas phase.7 The degree of separation was determined using Formula 1.
Where R was the degree of separation (the percentage rejection) of the solute elements (%); Cp was the solute concentration in the permeate (g/L); and Cf was the solute concentration in the feed (g/L).
Membrane Flux
Membrane flux was determined using a method of Shishegaran et al.8 with some modifications. The membrane flux is the volume of membrane permeability per unit time per unit area of the membrane.7 The membrane flux was calculated by Formula 2.
Where J was the membrane flux (L/m2.h); t was the filtration time (hour); V was the membrane flow volume obtained during time t (L); A was membrane filter surface area (m2).
Nitrogen recovery efficiency
Nitrogen recovery efficiency was determined based on a method described by Gifuni et al. 25 with slight modifications. The nitrogen recovery efficiency, which was calculated by Formula 3, is the percentage of nitrogen concentration in the permeate with nitrogen concentration in the feed.
Where H was nitrogen recovery efficiency (%); Co was nitrogen concentration in the feed (g/L); C1 was nitrogen concentration in the permeate (g/L); Vo was the volume of the feed (L); V1 was the volume of the permeate (L).
Solubility
The solubility of collagen hydrolysate was determined by dissolving 200 mg of hydrolyzed collagen in 20 mL of distilled water, then adjusting to a range of pH from 4.0 to 9.0 by 1 N HCl or 1 N NaOH and stirring for 30 min at 25±1°C (Tsumura, 2005).26 After centrifugation (10,000 rpm, 15 min), the supernatant was collected and determined its protein content by Lowry’s method. The solubility of collagen hydrolysates was the percentage of protein content in the supernatant compared to the total protein content in the collagen sample.
Emulsifying Property
The emulsifying property of hydrolyzed collagen was evaluated through the emulsifying activity index (EAI) and the emulsifying stability index (ESI) according to a method of Pearce and Kinsella.27 Soybean oil (10 mL) and hydrolyzed collagen solution (30 mL, 0.1% and adjusted pH to 4.0 to 9.0 with 1 N HCl or 1 N NaOH) were assimilated at a rate of 20,000 rpm. Emulsion (50 μL), that was aspirated from the bottom of the emulsion device at 0 and 10 min after homogenization, was diluted 100 times with 0.1% SDS (Sodium dodecyl sulfate) solution. The following formula calculates the diluent at 500 nm. The absorbance, determined immediately (A0) and 10 min (A10) after emulsion formation, the emulsifying capacity, and the emulsion stability:
EAI (m2/g) = (2 × 2.303 × A0 x DF) / (0.25 × C) (Formula 4)
Where DF was dilution factor; C was the concentration of hydrolyzed collagen.
ESI (min) = A0 × △t/△A (Formula 5)
Where △A = A0 – A10, △t = 10 min.
Foaming Capacity
Foaming capacity (FC) and foaming stability (FS) of hydrolyzed collagen were determined based on the method of Shahidi et al. (1995)28 with minor modifications. The hydrolyzed collagen solution (20 mL, 0.5% adjusted pH to 4.0 to 9.0 with 1 N HCl or 1 N NaOH) was homogenized at 16,000 rpm for 2 min (PT 1300D homogenizer, Switzerland), then quickly transferred into a 50 mL graduated cylinder to determine the foam volume and had the total volume read at 0 and 10 min after transferring. The FC was defined as the foam expansion at 0 min, and FS was defined as foam expansion over 10 min. Foam expansion was calculated following Formula 6.
Foam expansion (%) = [(A-B) / B] × 100% (Formula 6)
Where A was the volume after homogenization (mL) at different times and B was the volume before homogenization (mL).
Antioxidant Properties
The antioxidant properties of hydrolyzed collagen were determined based on the DPPH radical scavenging (Hui-Yin, 2002).29 Collagen stock solution (1 mg/mL hydrolyzed collagen solution) was added to 6 test tubes with 100, 200, 300, 400, 500, and 600 µL, respectively, and total up to 3 mL by distilled water. After that, each test tube was mixed with 1 mL of 0.2 mM DPPH, incubated for 30 min in the dark, and read the absorbance at 517 nm by spectrophotometer (Lamomed 2550, USA). The blank used distilled water to replace the collagen sample. The positive control was 200 µg/mL vitamin C solution.
DPPH radical scavenging activity (DPPH, %) 
Where ACT was the absorbance of the blank; Asp was the absorbance of collagen solution.
The antioxidant capacity of hydrolyzed collagen was evaluated based on the IC50 value, which is the collagen concentration that can scavenge 50% of DPPH free radicals. The higher IC50 value indicates the lower antioxidant properties.
Hydroxyl radicals scavenging activity was measured following the method of Wang et al.30 Hydrolyzed collagen (1 mg/mL) was added to 6 test tubes in different volumes (120, 240, 360, 480, 600, and 720 µL) and total up to 3 mL by distilled water. After that, 1 mL of 2 mM FeSO4 and 1 mL of 2 mM 1,10-phenanthroline was added to each test tube, vortexed (ZX3, Velp, Italy), then added with 1 mL of 0.03% H2O2 (v/v) and incubated at 37 °C for 60. The 536-nm absorbance was read by spectrophotometer (Lamomed 2550, USA). A test tube without a sample was used as a negative control, and test tubes without H2O2 were used as blank.
The hydroxyl radical scavenging activity (HRSA, %) ![]()
Where As was the absorbance of solution with sample; An was the absorbance of negative control; Ab was the absorbance of blank.
The Antioxidant Activity of Collagen Hydrolysate in Oil-in-Water Emulsion System
The oil-in-water emulsion was prepared following the method of Zhao et al.31 The mixtures including 85 mL of distilled water, 0.5 mL of Tween 40, and 10 mL of soybean oil were homogenized at 10000 rpm for 5 min (IKA, T18B, Ultra – Turax, Germany), then added to 3 test tubes containing 10 mL of the oil-in-water emulsion with different volumes (0.5, 1, and 2 mL) of 50 mg/mL collagen hydrolysates, shaken well, and incubated at 50 °C (IN55 Memmert, Germany). The final concentrations of collagen hydrolysate were 25, 50, and 100 mg/mL of soybean oil. The peroxide value was determined by following the method of Richards and Hultin32 by monitoring the change of peroxide index of oil-in-water emulsion system daily. Fat extraction for hydroperoxide determination followed the method of Bligh and Dyer.33 Cumene hydroperoxide at 0 to 8 mM concentrations were used for the standard curve. The hydroperoxide value was defined as milliequivalents (mEq) of cumene hydroperoxide per kilogram sample. The control sample was a sample without collagen hydrolysates.
Statistical Analysis
All experiments and subsequent analytical measurements were done in triplicate. The measurements on each experiment run were performed in triplicate, and the mean was used as a value in the subsequent statistical analysis for each set of three experimental runs. The results were presented as mean values with standard deviation (±SD), using the Microsoft Excel software version 2016. When comparing means for significant differences at p <0.05, the one-way analysis of variance (ANOVA) and the least significant difference (LSD) post hoc test were used, using the SPSS software version 25.0. Graphing was done with the Microsoft Excel version 2016.
Results and Discussion
Chemical Composition and Molecular Weight Distribution in Yellowfin Tuna Collagen Solution
The pretreated solution of hydrolyzed yellowfin tuna skin collagen (CH) contained 9.69 ± 0.15% dry matter with 14.60 ± 0.32 (mg/mL) nitrogen, 0.09 ± 0.01% lipid, and 0.17 ± 0.01% ash. The results from GPC chromatography (Figure 1) show that the molecular weight distribution of peptides in the CH solution was less than 5 kDa. The hydrolysate product consisted of 3 fractions, of which 10% of the peptides have a molecular weight less than 416 Da (A), 40% from 416 Da to 1 kDa (B), and 50% from 1 kDa to 5 kDa (C).
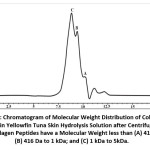 |
Figure 1: Chromatogram of molecular weight distribution of collagen peptides in yellowfin tuna skin hydrolysis solution after centrifugation. The collagen peptides have a molecular weight less than (A) 416 Da; (B) 416 Da to 1 kDa; and (C) 1 kDa to 5kDa |
Purification of Collagen Hydrolysate by Ultrafiltration
Effect of Temperature on Ultrafiltration Efficiency
The effect of temperature on membrane filtration is shown in Figure 2A. When the temperature increased from 5 °C to 25 °C, the degree of separation only slightly decreased, while the membrane flux and the nitrogen recovery efficiency highly increased. The viscosity of collagen hydrolysate decreased together with the increase of temperature, resulting in better separation of fractions in the hydrolyzed collagen. When filtering at 25 °C, the membrane flux and nitrogen recovery efficiency were the highest, at 2.83 L/m2.h and 69.43%, respectively, and 31.16% the degree of separation was obtained.
When the temperature continued to increase from 25 °C to 35 °C, the membrane flux increased insignificantly, while nitrogen recovery efficiency decreased, and the degree of separation increased. When the temperature increased, the micelle’s possibility increased, making the degree of separation increases.8 Therefore, the appropriate hydrolyzed collagen membrane filtration temperature was 25 °C.
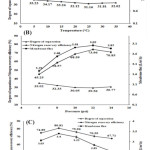 |
Figure 2: Effect of Purification Conditions on Ultrafiltration Efficiency (A) Temperature (n=21); (B) Pressure (n=15); (C) pH (n=15); n is Sample Size. |
Effect of Pressure on Ultrafiltration Efficiency
When the transmembrane pressure increases from 6 to 12 psi during ultrafiltration, the membrane flux, and nitrogen recovery efficiency increased, while the degree of separation decreased (Figure 2B). When the transmembrane pressure increased from 12 to 14 psi, the flux decreased while the degree of separation increased, resulting in reduced nitrogen recovery efficiency. In tangential filtration, the transmembrane pressure is the driving force for collagen peptides to penetrate the membrane. However, when the membrane pressure increases to a specific limit, a gel layer is formed on the membrane surface, resulting in reduced flux.34 Thus, the ultrafiltration of hydrolyzed collagen solution at a pressure of 12 psi had the highest membrane flux and nitrogen recovery efficiency, at 3.02 L/m2.h and 74.96%, respectively, and the degree of separation of 29.56%.
Effect of pH on Ultrafiltration Efficiency
When the pH increased from 6.0 to 6.5, the flux of the membrane and the nitrogen recovery efficiency increased, while the degree of separation decreased (Figure 2C). The highest flux and nitrogen recovery rates were 3.4 L/m2.h and 80.81%, respectively. However, when the pH increased from 6.5 to 8.0, the flux of the membrane and nitrogen recovery efficiency decreased, while the degree of separation increases. This could be explained that pH was one of the parameters affecting the charge capacity, structure, and shape of collagen peptides. Therefore, when filtering the membrane, it affected the throughput of the membrane and the membrane’s specific resolution. At isoelectric pH, the peptides precipitate, and the permeability of the membrane decreases, reducing the throughput of the membrane. If the pH is greater or less than the isoelectric pH, the peptides will have a charge and change their permeability, affecting the throughput of the membrane.9 In this study, at pH 6.5, the membrane flux and nitrogen recovery efficiency were the highest.
The chemical composition, the ratio of volume, and molecular mass of the collagen peptide fractions after ultrafiltration are shown in Table 1. The lipid and dry matter contents of F1 were lower than F2. The volume of F2 and F1 was 89.95% and 10.05%, respectively.
Table 1: Chemical Composition and Molecular Mass Distribution of Hydrolyzed Collagen Fractions After Ultrafiltration.
| Fraction | Nitrogen (mg/mL) | Lipid (%) | Ash (%) | Dry matter (%) | Volume ratio (%) | Molecular weight cut off (MWCO) |
| F1 | 18.63a±0.35 | 0.40a±0.04 | 0.139a±0.02 | 15.41a±0.26 | 10.05a±1.06 | > 3kDa |
| F2 | 14.14b±0.40 | 0.05b±0.01 | 0.175b±0.02 | 9.04b±0.33 | 89.95b±1.13 | £ 3kDa |
Data are means ± SD; the values in the same column followed by different superscripts (a-b) were significantly different (P < 0.05)
Properties of Hydrolyzed Collagen Fractions
Solubility
All collagen peptide fractions were soluble over a wide pH range, with the solubility higher than 96% (Figure 3A). The solubility of F2 increased with increasing pH from 4.0 to 5.5, but was almost unchanged in pH ranging from 5.5 to 9.0. At pH < 8, the solubility of F2 was higher than that of F1. The F1 fraction had lower solubility in an acidic solution than in an alkaline solution.
In similar researches, the solubility of hydrolyzed collagen obtained from the skin of Spanish mackerel (Scomberomorous niphonius) was 89.70%,1 and from the skin of Ornate threadfin bream fish (Nemipterus hexodon) was 99.30%.35 In general, protein hydrolysis produces smaller molecular-weight peptides with variant solubility.36 Enzymatic hydrolysis can influence the molecular size, hydrophobicity, polar, and ionizable group of hydrolyzed proteins.37 Peptides from myofibrillar fiber proteins often have more polar groups which can create hydrogen bonds with water more efficiently, resulting in the increasing solubility.38
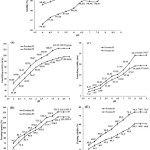 |
Figure 3: Effect of pH on Properties of Hydrolyzed Collagen Fractions. |
Solulility; (B) Emulsifying ability; (C) Emulsifying stability; (D) Foaming ability; (E) Foaming stability; n = 33 (sample size)
Emulsifying Activity
The emulsifying activity index (EAI) and emulsifying stability index (ESI) of collagen hydrolysates from yellowfin tuna skin are shown in Figures 3B and 3C. Both EAI and ESI of F1 and F2 fractions increased with increasing pH. Figure 3B indicates that the EAI of F1 was higher than that of F2 (p < 0.05) and the EAI did not change significantly when pH higher 8.0 for F1 and pH higher 8.5 for F2. The highest EAI was 112.33 (m2/g) and 97.80 (m2/g) of the F1 and F2 fractions, respectively (p < 0.05). This result was similar to other researches about hydrolyzed collagen from Spanish mackerel skin (Scomberomorous niphonius) and from fish skin Ornate threadfin bream (Nemipterus hexodon), which had the EAI of 97.44 (m2/g) and 116.00 (m2/g), respectively.35 It was reported that at a high degree of hydrolysis, peptides with low molecular weight lose their emulsifying properties.36 Klompong et al.36 suggested that low molecular weight peptides may not be sufficient amphiphilic to exhibit good emulsifying activity.
The ESI of fraction F1 was higher than fraction F2, and it increased with increasing pH (Figure 3C). The ESI did not change significantly when pH > 8.0 of both fractions (p>0.05). Similar results were obtained by Nalinanon et al.,35 which showed that ESI of hydrolyzed collagen from fish skin Ornate threadfin bream (Nemipterus hexodon) was 25.80 (min).35 Mutilangi et al.37 recognized that peptides with higher molecular weight contributed to the emulsion stability.37
Foaming Capacity
Foaming capacity (FC) and foam stability (FS) of two hydrolyzed collagen fractions, F1 and F2, are shown in Figures 3D and 3E. Both FC and FS index increased when the pH increased from 4.0 to 8.0, while there was an insignificant difference when pH ³ 8.0 (p> 0.05). The FC and FS indexes of F2 were greater than that of F1. This result is similar to hydrolyzed collagen from fish skin Ornate threadfin bream (Nemipterus hexodon) with FC and FS of 131.0% and 78%, respectively.35 It could be explained due to the weaker binding of small peptides in the air-water surface interface.39 The foaming was affected by three main factors such as transport, penetration, and reorganization of molecules at the air and water interface.36 Proteins that are rapidly absorbed in the generated air-liquid interface during the foaming process and rearranged at the interface exhibit better foaming ability than the slow-absorbing proteins.40 Similar result was also reported in yellow striped bamboo (Selaroides leptolepis) protein hydrolysate products prepared by Alcalase and Flavourzyme with 5 – 25% degree of hydrolysis.36 The low MW peptides could not maintain an orderly orientation of the interface’s molecule.
Antioxidant Properties
Different reaction mechanisms complicate the oxidation processes that occur in food or biological system. Therefore, in this study, the antioxidant activity of hydrolyzed collagen solution and F1 and F2 fractions was determined through the DPPH and hydroxyl free radical reduction, and their antioxidant capacity in the oil-water emulsion.
DPPH (2,2-Diphenyl-1-picrylhydrazyl) Radical Scavenging Activity
DPPH free radical activities of initial hydrolyzed collagen solution, F1, and F2 fractions are shown in Figure 4A. DPPH is a purple compound that can be identified at the wavelength of 517 nm. When interacting with compounds containing free electrons, it will accept electrons to become a magnetic molecule and lose its purple color.41 Figure 4A indicates that the DPPH radical scavenging activity of F2 fraction was the highest, followed by the initial hydrolyzed collagen solution and F1 at 25-150 µg/mL concentrations. From those results, the IC50 of DPPH radical scavenging activity of the initial hydrolyzed collagen, F1, and F2 fractions were 77.04 µg/mL, 142.98 µg/mL, and 48.51 µg/mL, respectively, which were rather high when compared with vitamin C, a potent antioxidant, which had IC50 of 5.29 µg/mL. This result showed that hydrolyzed collagen with a small molecular weight would have a higher antioxidant capacity, and this is also consistent with the previous study reported by Asaduzzaman et al.3
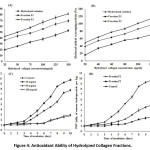 |
Figure 4: Antioxidant Ability of Hydrolyzed Collagen Fractions. |
(A) DPPH radical scavenging activity (n = 18) ; (B) Hydroxyl radical scavenging activity (n = 18); (C) Effect of collagen concentration on antioxidant capacity in oil-in-water emulsion (n =33); (D) The antioxidant capacity of different collagen fractions in oil-in-water emulsion (n=33); n is sample size.
The results of this study were similar to the study of Nurilmala et al.,42 in which the peptide fraction of 3-10 kDa from the yellowfin tuna (Thunnus albacares) had the IC50 value of 75.94 µg/mL. Their antioxidant activities were higher than collagen hydrolysate from Spanish mackerel skin (IC50 = 1570 µg/mL).1 Hydrolyzed collagen from salmon skin had the strongest antioxidant activity in the fraction less than 3 kDa.43 Acidic amino acids in low molecular weight collagen peptides had high DPPH radical scavenging activity due to the presence of carboxyl groups in the molecule. Amino acids, such as glutamic acid and arginine, can affect low molecular weight collagen peptides’ antioxidant capacity.44
Hydroxyl Radical Scavenging Activity
Figure 4B indicates that the hydroxyl radical scavenging activities of hydrolyzed collagen solution, and F1 and F2 fractions after ultrafiltration were similar to the DPPH radical scavenging activity. The IC50 values, of hydrolyzed collagen solution, F1, and F2 were 36.59 µg/mL, 75.66 µg/mL, and 19.74 µg/mL, respectively. The hydroxyl radical scavenging activity is proportional to the collagen peptide concentration in the solution (Figure 4B). This result was higher than some peptides isolated from other aquatic species such as ACH-P3 from the scales of croceine croaker (IC50 = 170 µg/mL), PSYV (IC50 = 2640 µg/mL) from loach fish hydrolyzed protein,30 LKQELEDLLEKQE (IC50 46 µg/mL) oyster protein hydrolysate.45 However, it was lower than MQIFVKTLTG (IC50 = 5 µg/mL) and DLSDGEQGVL (IC50 = 7 µg/mL) protein hydrolyzed from venison.46
This study has shown that hydrolyzed collagen from yellowfin tuna skin had considerably high DPPH and hydroxyl free radical scavenging activity. Therefore, it can be used as a scavenger to protect food or living organisms against free radicals’ damage.
Antioxidation Activity of Collagen Hydrolysate In Oil-Water Environments
Oxidation of oil-in-water emulsion is a common problem that causes rancid odors and loss of nutrients in many food products such as sauces, soups, and beverages.47 Therefore, the antioxidant activity of hydrolyzed collagen from yellowfin tuna skin was assessed through its ability to inhibit lipid oxidation by decreasing the peroxide (POV) value of the emulsion (Figure 4C and 4D).
As shown in Figure 4C, during ten days of incubation at 50 °C, POV of the emulsion with the addition of 50 mg/mL of hydrolyzed collagen and the control sample on day 8 of incubation were 2.25 mEq and 8.5 mEq, respectively. The average POV of samples with 50 mg/mL of hydrolyzed collagen and control sample after ten days of incubation were 1.64 mEq and 4.66 mEq, respectively. Thus, POV inhibition (day 8) of the sample with 50 mg/mL of hydrolyzed collagen added up to 73.53% compared to the control sample and POV inhibition an average of 57.95% for ten days of incubation. POV of the emulsion with the addition of 50 mg/mL of hydrolyzed collagen was similar to the sample with 100 mg/mL hydrolyzed collagen, but higher than the sample with 25 mg/mL hydrolyzed collagen. This result was equivalent to the previously reported inhibition rates of POV values of hydrolyzed sorghum, and potato hydrolyzed protein, being 55.38% and 62.80%, respectively, for ten days incubation at a 20 mg/mL.48
In this study, the antioxidant activity of the collagen fractions F1 and F2 was different from inhibitory oxidizing activity (Figure 4D). Emulsion samples with the addition of 50 mg/mL hydrolyzed collagen each F1, and F2 segments showed inhibition rates of POV of 52.94% and 73.53% (day 8), respectively, and had mean inhibition levels of 39.44% and 57.95% (after ten days). Thus, the F2 fraction can inhibit the oxidation of the emulsion system compared with the F1 fraction. The results demonstrated the antioxidant activity of collagen hydrolysate in inhibiting lipid oxidation, thereby stabilizing and slowing the emulsion’s oxidation.
Previous studies have proved that peptides obtained from enzymatic hydrolysis of fish protein have shown significant antioxidant activities in various oxidation systems.35,49 According to Vignesh et al.,49 the antioxidant activity depends on the level and composition of both free amino acids and peptides. Also, Lassoued et al.50 mentioned that antioxidant activity is related to amino acid composition, sequence, and hydrophobicity. Most of the identified antioxidant peptides were short (between 5-16 amino acids) and contain hydrophobic amino acids (Val and Leu) at the N-end of the peptide chain and Pro, His, or Tyr in the sequence of them. Besides, the antioxidant activity of hydrolyzed collagen was attributed by a variety of mechanisms, in which the amino acid composition of the peptide chain is essential because the hydrophobic amino acids of Val, Ile, Leu, Met, Phe, and Trp. and Cys have higher uptake of hydroxyl radicals than hydrophilic amino acids.51 The collagen composition from fish skin contains many hydrophobic amino acids such as glycine, alanine, proline, and methionine; thus, collagen hydrolysate from fish skin has a high antioxidant capacity.52
Conclusions
The UFP-1-C-6 filter was used to purify and separate the hydrolyzed collagen into two fractions, F1 (< 3 kDa), and F2 (3-5 kDa), with the volume of 10% and 90%, respectively. The study had determined the temperature, pressure, and pH of the input stream to the membrane filtration process. Both hydrolyzed collagen fractions had excellent solubility at pH below 8.0 where the F2 fraction dissolved better than F1. As pH was higher than 8.0, both fractions were almost completely dissolved. In addition, the emulsifying and foaming of the F1 fraction was better than the F2. However, the F2 fraction was more resistant to oxidation with higher antioxidant activity. Therefore, these two fractions can be applied in different industries depending on the aim of usage. Further researches should be conducted using different types of membranes to purify and fractionate hydrolyzed collagen for a comparison of product efficacy and quality.
Acknowledgments
The authors would like to thank Nong Lam University, Ho Chi Minh city and Ho Chi Minh city University of Food Industry, Vietnam for their support. We greatly appreciate the help of laboratory technicians who participated in this research.
Funding Source
This study was funded by Ho Chi Minh City University of Food Industry, Vietnam (51/HĐ-ĐCT).
Conflict of Interest
The authors declare no conflict of interest.
References
- Chi CF, Cao ZH, Wang B, Hu FY, Li ZR, Zhang B. Antioxidant and functional properties of collagen hydrolysates from Spanish mackerel skin as influenced by average molecular weight. Molecules. 2014;19(8):11211-11230.
CrossRef - Ahmed R, Haq M, Chun BS. Characterization of marine derived collagen extracted from the by-products of bigeye tuna (Thunnus obesus). Int J Biol Macromol. 2019;135:668-676.
CrossRef - Asaduzzaman AKM, Getachew AT, Cho YJ, Park JS, Haq M, Chun BS. Characterization of pepsin-solubilised collagen recovered from mackerel (Scomber japonicus) bone and skin using subcritical water hydrolysis. Int J Biol Macromol. 2020;148:1290-1297.
CrossRef - Haq M, Ho TC, Ahmed R. Biofunctional properties of bacterial collagenolytic protease-extracted collagen hydrolysates obtained using catalysts-assisted subcritical water hydrolysis. J Ind Eng Chem. 2020;81:332-339.
CrossRef - Benjakul S, Thiansilakul Y, Visessanguan W, et al. Extraction and characterisation of pepsin-solubilised collagens from the skin of bigeye snapper (Priacanthus tayenus and Priacanthus macracanthus). J Sci Food Agric. 2010;90(1):132-138.
CrossRef - Chalamaiah M, Dinesh Kumar B, Hemalatha R, Jyothirmayi T. Fish protein hydrolysates: Proximate composition, amino acid composition, antioxidant activities and applications: A review. Food Chem. 2012;135(4):3025-3038.
CrossRef - Field R, Lipnizki F. Membrane separation processes an overview. In: Robert Field, Erika Bekassy-Molnar, Frank Lipnizki and GV, ed. Engineering Aspects of Membrane Separation and Application in Food Processing. Florida: CRC Press; 2017:3-40.
CrossRef - Shishegaran A, Boushehri AN, Ismail AF. Gene expression programming for process parameter optimization during ultrafiltration of surfactant wastewater using hydrophilic polyethersulfone membrane. J Environ Manage. 2020;264:110444.
CrossRef - Burns DB, Zydney AL. Effect of solution pH on protein transport through ultrafiltration membranes. Biotechnol Bioeng. 1999;64(1):27-37.
CrossRef - Sato K. The presence of food-derived collagen peptides in human body-structure and biological activity. Food Funct. 2017;8(12):4325-4330.
CrossRef - Inoue N, Sugihara F, Wang X. Ingestion of bioactive collagen hydrolysates enhance facial skin moisture and elasticity and reduce facial ageing signs in arandomised double-blindplacebo-controlled clinical study. J Sci Food Agric. 2016;96(12):4077-4081.
CrossRef - Langmaier F, Mokrejs P, Kolomaznik K, Mladek M. Biodegradable packing materials from hydrolysates of collagen waste proteins. Waste Manag. 2008;28(3):549-556.
CrossRef - Ocak B. Film-forming ability of collagen hydrolysate extracted from leather solid wastes with chitosan. Environ Sci Pollut Res. 2018;25(5):4643-4655.
CrossRef - Razali AN, Amin AM, Sarbon NM. Antioxidant activity and functional properties of fractionated cobia skin gelatin hydrolysate at different molecular weight. Int Food Res J. 2015;22(2):651-660.
- Imjongjirak C, Amphaiphan P, Charoensapsri W, Amparyup P. Characterization and antimicrobial evaluation of Sp PR-AMP1, a proline-rich antimicrobial peptide from the mud crab Scylla paramamosain. Dev Comp Immunol. 2017;74:209-216.
CrossRef - Boonmaleerat K, Wanachewin O, Phitak T, Pothacharoen P, Kongtawelert P. Fish Collagen Hydrolysates Modulate Cartilage Metabolism. Cell Biochem Biophys. 2018;76(1):279-292.
CrossRef - Nurilmala M, Fauzi S, Mayasari D, Batubar I. Collagen extraction from yellowfin tuna (Thunnus albacares) skin and its antioxidant activity. J Teknol. 2019;81(2):141-149.
CrossRef - Binh NC, Hong NMX, Kha NHN, Tuyen KC. Optimization of Treatment Conditions for Non-collagen Removal from Yellowfin Tuna Skin (Thunnus albacares). Chiang Mai Univ J Nat Sci. 2020;19(3):548-562.
- Nguyen BC, Kha TC, Nguyen KHN, Nguyen HMX. Optimization of enzymatic hydrolysis of collagen from yellowfin tuna skin (Thunnus albacares) by response surface methodology and properties of hydrolyzed collagen. J Food Process Preserv. 2021;45(4).
CrossRef - AOAC official method 2011. 04. Protein in Raw and Processed Meats. In: Official Methods of Analysis of AOAC International. ; 2011.
- AOAC official method 960. 39. Fat (crude) or ether extract in meat. In: Official Methods of Analysis of AOAC International. 19th ed. AOAC international Gaibersburg, MD, USA; 2012.
- AOAC official method 950. 46. Moisture in Raw and Processed Meats. In: Official Methods of Analysis of AOAC International. AOAC international Gaibersburg, MD, USA.; 2000.
- AOAC official method 920. 153. Ash in meat and meat product. In: Official Methods Ofanalysis of AOAC International. AOAC international Gaibersburg, MD, USA.; 2007.
- Spellman D, O’Cuinn G, FitzGerald RJ. Bitterness in Bacillus proteinase hydrolysates of whey proteins. Food Chem. 2009;114(2):440-446.
CrossRef - Gifuni I, Lavenant L, Pruvost J, Masse A. Recovery of microalgal protein by three-steps membrane filtration: Advancements and feasibility. Algal Res. 2020;51:102082.
CrossRef - Tsumura K, Saito T, Tsuge K, Ashida H, Kugimiya W, Inouye K. Functional properties of soy protein hydrolysates obtained by selective proteolysis. LWT – Food Sci Technol. 2005;38(3):255-261.
CrossRef - Pearce KN, Kinsella JE. Emulsifying Properties of Proteins: Evaluation of a Turbidimetric Technique. J Agric Food Chem. 1978;26(3):716-723.
CrossRef - Shahidi F, Han XQ, Synowiecki J. Production and characteristics of protein hydrolysates from capelin (Mallotus villosus). Food Chem. 1995;53(3):285-293.
CrossRef - Hui-Yin F. Antioxidant and free radical scavenging activities of edible mushrooms. J Food Lipid. 2002;9(1):35-43.
CrossRef - Wang B, Li ZR, Chi CF, Zhang QH, Luo HY. Preparation and evaluation of antioxidant peptides from ethanol-soluble proteins hydrolysate of Sphyrna lewini muscle. Peptides. 2012;36(2):240-250.
CrossRef - Zhao Q, Selomulya C, Wang S. Enhancing the oxidative stability of food emulsions with rice dreg protein hydrolysate. Food Res Int. 2012;48(2):876-884.
CrossRef - Richards MP, Hultin HO. Contributions of blood and blood components to lipid oxidation in fish muscle. J Agric Food Chem. 2002;50(3):555-564.
CrossRef - Bligh EG, Dyer WJ. A Rapid method of total lipid extraction and purification. Can J Biochem Physiol. 1959;37(8):911-917.
CrossRef - Fallis A. Cross Flow Filtration Method Handbook. J Chem Inf Model. 2013;53(9):1689-1699.
CrossRef - Nalinanon S, Benjakul S, Kishimura H, Shahidi F. Functionalities and antioxidant properties of protein hydrolysates from the muscle of ornate threadfin bream treated with pepsin from skipjack tuna. Food Chem. 2011;124(4):1354-1362.
CrossRef - Klompong V, Benjakul S, Kantachote D, Shahidi F. Antioxidative activity and functional properties of protein hydrolysate of yellow stripe trevally (Selaroides leptolepis) as influenced by the degree of hydrolysis and enzyme type. Food Chem. 2007;102(4):1317-1327.
CrossRef - Mutilangi WAM, Panyam D, Kilara A. Functional properties of hydrolysates from proteolysis of heat-denatured whey protein isolate. J Food Sci. 1996;61(2):270-303.
CrossRef - Gbogouri GA, Linder M, Fanni J, Parmentier M. Influence of hydrolysis degree on the functional properties of salmon by products hydrolysates. J Food Sci. 2004;69(8):615-622.
CrossRef - Nalinanon S, Benjakul S, Visessanguan W, Kishimura H. Improvement of gelatin extraction from bigeye snapper skin using pepsin-aided process in combination with protease inhibitor. Food Hydrocoll. 2008;22(4):615-622.
CrossRef - Damodaran S. Damodaran. In: Protein-Stabilized Foams and Emulsions. New York: Marcel Dekker.; 1997:57-110.
CrossRef - Bougatef A, Nedjar-Arroume N, Manni L, et al. Purification and identification of novel antioxidant peptides from enzymatic hydrolysates of sardinelle (Sardinella aurita) by-products proteins. Food Chem. 2010;118(3):559-565.
CrossRef - Nurilmala M, Hizbullah HH, Karnia E, Kusumaningtyas E, Ochiai Y. Characterization and Antioxidant Activity of Collagen, Gelatin, and the Derived Peptides from Yellowfin Tuna (Thunnus albacares) Skin. Mar Drugs. 2020;18(2):98-110.
CrossRef - Wu RB, Wu CL, Liu D, et al. Antioxidant and anti-freezing peptides from salmon collagen hydrolysate prepared by bacterial extracellular protease. Food Chem. 2018;248:346-352.
CrossRef - Sarmadi BH, Ismail A. Antioxidative peptides from food proteins: A review. Peptides. 2010;31(10):19491956.
CrossRef - Qian ZJ, Jung WK, Byun HG, Kim SK. Protective effect of an antioxidative peptide purified from gastrointestinal digests of oyster, Crassostrea gigas against free radical induced DNA damage. Bioresour Technol. 2008;99(9):3365-3371.
CrossRef - Kim EK, Lee SJ, Jeon BT, et al. Purification and characterisation of antioxidative peptides from enzymatic hydrolysates of venison protein. Food Chem. 2009;114(4):1365-1370.
CrossRef - Cheng Y, Xiong YL, Chen J. Antioxidant and emulsifying properties of potato protein hydrolysate in soybean oil-in-water emulsions. Food Chem. 2010;120(1):101-108.
CrossRef - Xu S, Shen Y, Li Y. Antioxidant activities of sorghum kafirin alcalase hydrolysates and membrane/gel filtrated fractions. Antioxidants. 2019;8(5):131.
CrossRef - Vignesh R, Haq MAB, Devanathan K, Srinivasan M. Pharmacological potential of fish extracts. Arch Appl Sci Res. 2011;3(5):52-58.
- Lassoued I, Mora L, Nasri R. Characterization and comparative assessment of antioxidant and ACE inhibitory activities of thornback ray gelatin hydrolysates. J Funct Foods. 2015;13:225-238.
CrossRef - Betts MJ, Russell RB. Amino-Acid Properties and Consequences of Substitutions. In: Bioinformatics for Geneticists: A Bioinformatics Primer for the Analysis of Genetic Data: Second Ed.; 2007:311-342.
CrossRef - Matilla B, Mauriz J, Culebras J, González-Gallego J, González P. La glicina: un nutriente antioxidante protector celular. Nutr Hosp. 2002;1(17):2-9.
Accepted on: 09 Sep 2021
Second Review by: Levent Bat Turkey and Rucha V Joshi California
Final Approval by: Dr. Vikas Kumar


Web of Science Coverage
Emerging Sources Citation Index (ESCI)
2024 Journal Impact Factor: 1.1
Scopus Journal Metrics
CiteScore 2025: 2.6
CiteScore Details
Sustainable Nutrition: Food Systems, Nutrient Retention, and Public Health Impact
![]()
This journal is a member of, and subscribes to the principles of, the Committee on Publication Ethics (COPE)


