
Introduction
Gelatin is a high molecular weight protein, a heterogeneous mixture of the water-soluble molecule (biopolymer) and derived from collagen by thermal denaturation. It was used as an ingredient in increasing the viscosity of the aqueous system and forming an aqueous gel. Gelatin is widely applied in the pharmaceutical products and food industries.1,2,3 It has various of functions in each food industry such as chewiness, creamy mouthfeel, texturization, emulsification and water-binding.4 Pig skin, bovine hide and pork and cattle bone were currently used as the major sources of the commercial gelatin.3 In terms of health and safety, it was found that bovine spongiform encephalopathy and foot/mouth diseases were the major problem in bovine which would have a negative impact on consumer confidence. Therefore, gelatin from mammalian by-products is limited as a food ingredient. Fish skin and bone (by-products) from fishery processing as the alternative sources have been gained to increase the value of raw materials.5,6 Many researchers have reported about extraction conditions and physicochemical properties from various fish sources such as black tilapia (Oreochromis mossambicus) and red tilapia (Oreochromis nilotica) skin,7 Nile perch (Lates niloticus),8 skate (Raja Kenojei),9 yellowfin tuna (Thunnus albacares),10 bigeye snapper and brown stripe snapper,5 sin croaker (Johnius dussumieri) and shortfin scad (Decapterus macrosoma)11 channel catfish (Ictalurus punctaus)12 and tuna (Thunnus thynnus)13 and tiger toothed croaker (Otolithes ruber) and pink pearch (Nemipterus japonicus).14
Seabass (Lates calcarifer) is one of the economically important species of Thailand and other countries in the Southeast Asia. It has been widely used for fillet production and had by-products (skin, bone, etc.) about 75% of the total catch weight. Approximately 30% of fish fillet processing wastes was skin and bone which can serve as a source of collagen and gelatin.15,16
Nile tilapia (Oreochromis nilotica) and Red tilapia (Oreochromis nilotica-mossambicus) are popular in freshwater aquaculture. In the global market, the demand for tilapia in all forms is rapidly increasing.17 More fish wastes have been produced from the expansion of the tilapia processing industry. More than 60 % of these by-products, including skin, head, fins and bones, are considered as waste.18 However, a significant amount of protein still remains in these by-products. Fish skin, in particular, is a rich source of collagen and gelatin.19
The quality of gelatin depends on several functional properties such as its physicochemical properties, processing method and parameters. In the process of gelatin extraction, factors affecting of the yield of gelatin were treatment concentration, treatment time and temperature, extraction time and temperature. The aim of this research is to determine the optimal condition the gelatin extraction from Seabass, Nile tilapia and Red tilapia skin and bone. The most suitable fish gelatin extract was used as an food ingredient in the Panna Cotta recipes.
Material and Methods
Raw material and sample preparation
Sea Bass, Nile tilapia and Red tilapia skin and bone fish were bought from Bangrak market (Bangkok province), Saphan Mai market (Bangkok province) and Mahachai market (Samutsakorn province), respectively, except Nile tilapia bone fish was obtained from Grobest Corporation Ltd., Nakorn Phanom province, Thailand. The fish skins and bone were stored in the refrigerator for up to 1-3 day before extraction begins. The sample of fish skin and bone were removed by a slicing knife and a blender, respectively. The residual meat of three different fish was manually removed and washed fish skin with tap water. The skin was cut into small pieces (1.0 cm x 1.0 cm). Bones samples were removed the attached flesh by scraping with a knife and degreased by soaking in warm water (35°C for 20 min), before the break into small pieces. The prepared fish skin and bone were packed in polyethylene bags and stored at -20°C for not longer than 3 months prior to the gelatin extraction. Commercial bovine gelatin was used as control group. All other analytical grade reagents were used in this study.
Pre-treatment and gelatin extraction
Gelatin extraction was carried out according to Jongjareonrak et al., (2006)5 method with some modification. Before gelatin extraction, the skins/bones were immersed in 0.025 N NaOH solution in a ratio of 1:10 (w/v) to remove any non-collagenous proteins and pigments for 2 h under continuous stirring at room temperature (28– 30°C). The alkaline solution was changed twice every hour. The residues were washed with running water until a neutral pH (6.5 to 7.0). The residues were then mixed with 2 M H2SO4 solution in a ratio of 1:10 (w/v) to swell the collagenous material in the fish skin matrix for 2 h under continuous stirring at room temperature. The skins/bones were washed with running water to an approximately neutral pH or faintly acidic pH (6.0 to 7.0) by a digital pH meter measuring. Pretreated fish skin/bone was extracted with distilled water at a skin or bone/water ratio of 1:10 (w/v) at 80 and 90°C in the water bath (Memmert, Germany) for 1.0, 1.5, 2.0, 2.5 and 3.0 h with continuous stirring. The extracts were filtered using two layers of cheese cloths in due time. The filtrate was removed the water content by using rotary evaporator and dried in a hot air-oven at 60oC for 36 h. The fish gelatin powders were stored in a desiccator for further study. The gelatin from fish bones was repeated the above steps. Then, the filtrates were freeze-dried by using a freeze-dryer (WJ20, SIBATA, Japan). The yield of gelatin extracted can be calculated by using equation (1)
% yield = (mass of dried gelatin / mass of clean skins or bones) x 100 (1)
Effect of sodium chloride and activated carbon solution on gelatin resistance
After pre-treatment of gelatin extraction, pretreated fish skins/bones were immersed in 250 ml of 0, 0.25, 0.50, 0.75 and 1.0% (w/v) of NaOH solution. The NaOH solution was changed every 5 min for a total of 4 times. Then, the gelatin was extracted with distilled water in a skin or bone/water ratio of 1:10 (w/v) at 90oC (skins) and 80°C (bones) in the water bath (Memmert, Germany) for 2.5 h at room temperature under continuous stirring.
Effect of activated carbon solution on gelatin color
The gelatin solution from extraction was added 0, 0.5 and 1.0% (w/v) activated carbon and continuously stirred for 1 h at room temperature. The extracts were filtered through 2 layers of cheese cloths and were prepared the same previous method.
Proximate Composition
The extracted gelatins were analyzed the proximate compositions according to AOAC official methods (2005),20 including moisture (gravimetry), ash (organic composites incineration), protein and fat contents. The pH meter was used for measuring the pH of raw material and extracted gelatin. Gelatin extracted from fish skins and bones was chopped and blended in distilled water for 5 min to create suspension (1% (w/v) skin/bone). Biuret method was used determination of total protein concentration in the gelatin solution. The protein concentration of samples was calculated by using a standard curve of between concentrations and absorbance of a standard bovine serum albumin.21
Hydroxyproline Content
The method developed by Bergman and Loxley (1963)22 was used for analyzing the hydroxyproline quantification with some modification. The extracted gelatins were hydrolyzed with 10M HCl solution at 110°C for 24 h under the reflux condenser and then filtrated through Whatman No.4 filter paper. The pH of filtrates was adjusted to an approximately neutral pH (6.0-6.5) with 1M NaOH. 0.1 ml of samples and 0.2 ml of isopropanol was mixed into a tested tube. Next, an oxidant solution (1.0 ml; 7% (w/v) chloramine T and acetate/citrate buffer (pH 6.0) in a ratio of 1:4 (v/v))) and 1.3 ml of Ehrlich’s reagent solution (2 g of 4-dimethylamino-benzaldehyde in mixture of perchloric acid and isopropanol at a ratio of 3:13) was added. The solutions were mixed and heated at 60°C for 25 min in a water bath and then immersed in water for 2-3 min for cooling. Next, 5 ml of isopropanol solution was added to dilute. Absorbance was measured against water at 540 nm by using a spectrophotometer (Hanon instruments, Japan). Hydroxyproline as a standard solution was prepared different concentration (10 to 60 mg/ml). Quantification of hydroxyproline was calculated by using a standard curve of between concentrations and absorbance of a standard solution and expressed as mg/g sample.
Foaming Properties
Foaming capacity (FC) and foaming stability (FS) were evaluated. 50 mM of potassium phosphate buffer (pH 7.5) was added in gelatin samples until the final concentration of 0.3% (w/v) gelatin sample. Each sample (5 ml) was then homogenized and centrifuged for 1 min.23 Percentage of the amount of protein dispersion increasing during mixing was calculated as foaming capacity (equation (2)). Determination of the percentage of the foam remaining after 15 min was as foam stability (equation (3)).
Foam capacity = Volume of foam / Volume of total solution (2)
Foam stability = Volume of foam at 15 min / Volume of foam at 0 min (3)
Gel strength
The gelatin gel was prepared for gel strength (bloom value) measuring. The method developed by British standard BS 757:1975 (BSI 1975)24 was used to determine with some modification. The gel solutions (6.67% (w/v)) was prepared with distilled water at 60°C in bloom jar (150 ml capacity), cooled for 15 min at room temperature and then placed at 8-9°C for 18 h for maturation. Gel strength was investigated on TA-ZT2i texture analysis (Stable Micro System, UK) using a 1.27 cm diameter of the Flat-faced cylindrical Teflon®plunger, a load cell of 5 KN and cross-head speed 1 mm/s. The maximum force (g) at the probe penetration depth of 4 mm as the bloom strength was calculated.
Emulsifying Capacity
The emulsifying capacity was analyzed according to Kittiphattanabawon (2004) method25 with some modification. An emulsion of each sample (1, 2 and 3%) was prepared in distilled water to form a gelatin solution. The solution was homogenized with soybean oil in the ratio of 3:1 for 30 min and then centrifuged at 2,500 x g for 15 min. The height of emulsified layer was a percentage of the total height of material in the tubes as emulsifying capacity which was calculated by using equation (4)

Gelatin color and clarity
The color and clarity of gelatin gel were measured using a Hunter Lab color meter (Konica Minolta, Japan), based on CIE L*(lightness), a* (redness/greenness) and b* (yellowness/ blueness) color system.26 Turbidity of gelatin solution
Gelatin turbidity
The gelatin solution was prepared according to Kittiphattanabawon (2004)25 method with some modification. 6.67% (w/v) concentration of gelatin solution was prepared in distilled water at 60°C until completely solubilized. The turbidity of gelatin solution was measured by using a spectrophotometer (Hanon instruments, Japan) at an absorbance of 620 nm.
Development of Panna Cotta product
The suitable gelatin extract from fish samples was applied in Panna Cotta product in 5 recipes including fresh milk, sweet milk (mixed strawberry, chocolate) and fermented milk (mixed berries and orange), compared with commercial gelatin. All Panna Cotta products were tested customer satisfaction in 5-point Hedonic Scale.
Customer Satisfaction Survey
The gelatin extract from fish skin and bone and its application in Panna Cotta product were surveyed the consumer satisfaction by using 5-point Hedonic Scale (rate quality from dislike extremely to like extremely).
Statistical analysis
All data collected were analyzed using ANOVA followed with t-tests at 95% confidence interval (p£0.05). All experiment results were expressed as the mean ± standard deviation (SD) of triplicate (n= 3 determinations).
Results and Discussions
% gelatin yield
The % yield of gelatin extracted from skin and bone of three fishes; Sea Bass, Nile tilapia and Red tilapia at temperatures (80 and 90°C) were given in Table 1. The suitable temperature for gelatin extraction was 80 and 90oC at 2.5 h for fish bones (44.87±1.77 – 60.08±2.42%) and skins (64.73±2.15 -74.37±1.90%), respectively. Gelatin yield was found high in Nile tilapia (74.37±1.90% for skin and 60.08±2.42% for bone) when compared with Sea Bass and Red tilapia (p£0.05) and it was showed higher than the Red tilapia and Nile tilapia gelatins yield of 7.81% and 5.39% by Jamilah and Harvinder (2002),7 respectively. Moreover, the gelatin yield of fish skin had higher than that of fish bone. The difference in % gelatin yield will vary among the fish species, depending on protein content (collagen), the skin/bone compositions and pre-treatment of extraction that have also been many reports due to the differences in the extraction methods.5,7,8,16
Table 1: % gelatin yield of fish skins and bones
| Source of raw materials | Temperature (°C) | Gelatin Yield (%±SD)a | |||||
| 1.0 hr | 1.5 hr | 2.0 hr | 2.5 hr | 3.0 hr | |||
| Skin | Sea Bass | 80 | 12.13 ±1.50 | 46.26 ±1.50 | 54.61 ±0.91 | 64.36 ±2.09 | 65.61 ±4.30 |
| 90 | 8.15 ±1.50 | 43.74 ±0.91 | 52.29 ±1.50 | 64.73 ±2.15 | 62.55 ±1.50 | ||
| Nile tilapia | 80 | 35.74 ±2.48 | 42.42 ±0.83 | 47.11 ±1.62 | 51.62 ±0.83 | 54.51 ±0.31 | |
| 90 | 44.04 ±2.98 | 60.65 ±1.08 | 62.63 ±1.13 | 74.37±1.90* | 69.67 ±3.48 | ||
| Red tilapia | 80 | 40.69 ±0.54 | 48.46 ±1.74 | 39.24 ±1.13 | 44.12 ±1.66 | 47.07 ±1.37 | |
| 90 | 40.32 ±2.05 | 44.66 ±1.13 | 53.34 ±1.37 | 69.62 ±3.61 | 62.39 ±1.96 | ||
| Bone | Sea Bass | 80 | 8.45 ±1.81 | 9.86 ±2.85 | 15.09 ±1.60 | 51.71 ±0.92 | 41.45 ±7.76 |
| 90 | 16.90 ±1.21 | 22.94 ±1.21 | 25.75 ±1.39 | 37.62 ±0.70 | 23.14 ±1.52 | ||
| Nile tilapia | 80 | 37.79 ±1.74 | 42.83 ±2.20 | 47.48 ±1.68 | 60.08±2.42* | 54.46 ±1.46 | |
| 90 | 38.57 ±3.31 | 33.53 ±3.41 | 43.99 ±2.87 | 49.23 ±0.67 | 50.39 ±1.34 | ||
| Red tilapia | 80 | 38.68 ±1.46 | 39.46 ±1.16 | 43.33 ±2.42 | 44.87 ±1.77 | 47.58 ±1.16 | |
| 90 | 10.44 ±1.16 | 20.70 ±0.67 | 43.91 ±0.89 | 54.74 ±2.74 | 48.35 ±1.77 | ||
a mean values of three replicates ± SD; * mean values in the same column and temperature with different superscripts differ significantly (p£0.05).
The quantity of the gelatin yield can be lower due to the collagen leaching during extraction, washing and pre-treatments of fish skin and bone. Inability to cause collagen melting is another reason for declining % gelatin yield. Thus, based on the need to focus on the process of pre-treatment and gelatin extraction, respectively. The opening up of cross-links during the swelling of the skin and bones of fish during pretreatment with alkali and acid was associated with improved productivity. And alkali helps improve the color in the beginning process.27
Hydroxyproline content
Hydroxyproline is used as an indicator to determine the amount of collagen or gelatin. Hydroxyproline quantification of the extracted gelatin were in the range of 26.84±1.92–45.38±1.32% (90°C) and 12.14±0.83-23.28±1.12% (80°C) for skin and bone, respectively (Table 2), which were more than the gelatin extracted from Nile tilapia skin by (18.5%) by Zeng et al. (2010).28 Based on customer satisfaction survey, skin and bone gelatin from Nile tilapia fish had the highest point of %satisfaction and were selected for determining the physical and chemical properties for application in the food product. Although Sea Bass skin gelatin has higher hydroxyproline content than other fish gelatin and not significantly different in bone gelatin between Sea Bass and Nile tilapia, higher prices of Sea Bass fish were not worth the cost of gelatin extraction when comparing with Nile tilapia.
Table 2: Hydroxyproline content (%) of fish skin and bone gelatins
| Source of raw materials | Temperature (°C) | Hydroxyproline content (%±SD) | Satisfaction (%±SD) | |
| Skin | Sea Bass | 90 | 45.38±1.32* | 42.00±0.55 |
| Nile tilapia | 90 | 30.91±2.89 | 61.33±0.94* | |
| Red tilapia | 90 | 26.84±1.92 | 30.00±0.68 | |
| Bone | Sea Bass | 80 | 23.28±1.12 | 32.67±0.67 |
| Nile tilapia | 80 | 21.45±0.81 | 56.00±0.76 | |
| Red tilapia | 80 | 12.14±0.83 | 29.33±0.51 | |
% Satisfaction of Control (Skin) = 24.67±0.68; % Satisfaction of Control (Bone) = 28.67±0.32; * mean values in the same column and temperature with different superscripts differ significantly (p£0.05).
For sensory evaluation on the clarity and odor of extracted gelatins (Table 3), Nile tilapia skin gelatin solutions at 0.50% NaCl and 0.50% activated carbon had accepted the most consumers (93.33±0.48; p˂0.05) and followed by 1.0% NaCl and 0.5% activated carbon (86.67±0.66%) and 1.0% NaCl and 0.75% activated carbon (85.33±0.69%), respectively. But Nile tilapia bone gelatin solutions at 0.25% NaCl and 0.50% activated carbon had the most accepted by consumers (85.33±0.52%; p£0.05) and followed by 0% NaCl and 0.5% activated carbon (74.67±0.78%) and 0.5% NaCl and 0.5% activated carbon (70.00±0.63%), respectively.
Table 3: Sensory tests on the clarity and odor of Nile tilapia skin gelatins
| NaCl (%) | Activated Carbon (%) | Clarity of colora (±SD) | Odor (Fishy smell; ±SD) | |||
| Skin | Bone | Skin | Bone | |||
| Control (no washing) | 38.00±0.80 | 32.00±0.50 | 35.33±0.57 | 29.33±0.51 | ||
| 0.00 | 0.0 | 60.00±0.98 | 38.00±0.31 | 38.67±0.57 | 33.33±0.71 | |
| 0.5 | 46.00±0.75 | 74.67±0.78 | 66.66±0.57 | 72.00±0.72 | ||
| 1.0 | 40.00±0.79 | 53.33±0.48 | 65.33±0.57 | 60.67±0.85 | ||
| 0.25 | 0.0 | 64.67±0.82 | 34.67±0.45 | 42.67±0.57 | 39.00±0.67 | |
| 0.5 | 42.67±0.78 | 85.33±0.52* | 67.33±0.57 | 74.00±0.79* | ||
| 1.0 | 42.00±0.80 | 62.67±0.78 | 68.00±0.57 | 63.33±0.70 | ||
| 0.50 | 0.0 | 66.00±0.53 | 36.00±0.41 | 43.33±0.57 | 40.00±0.61 | |
| 0.5 | 93.33±0.48* | 70.00±0.63 | 66.67±0.57 | 67.33±0.67* | ||
| 1.0 | 40.67±0.81 | 48.00±0.62 | 65.33±0.57 | 60.67±0.76 | ||
| 0.75 | 0.0 | 80.00±0.64 | 35.33±0.43 | 40.67±0.57 | 39.33±0.56 | |
| 0.5 | 85.33±0.69 | 46.67±0.48 | 68.67±0.57 | 66.66±0.88 | ||
| 1.0 | 41.33±0.83 | 47.33±0.49 | 70.00±0.57* | 56.00±0.76 | ||
| 1.00 | 0.0 | 73.33±0.66 | 33.33±0.48 | 46.00±0.57 | 40.00±0.64 | |
| 0.5 | 86.67±0.66 | 42.67±0.68 | 70.00±0.57* | 61.33±0.64 | ||
| 1.0 | 35.33±0.57 | 36.00±0.48 | 70.00±0.57* | 60.67±0.72 | ||
* mean values in the same column and NaCl (%) with different superscripts differ significantly (p£0.05).
Based on odor sensory tests (Table 3), Nile tilapia skin gelatin solutions at 0.75-1.00% NaCl and 0.50-1.00% activated carbon had the most accepted by consumers (68.67±0.57%-70.00±0.57%; p£0.05). But Nile tilapia bone gelatin solutions at 0.0-0.5% NaCl and 0.50% activated carbon had the most accepted by consumers (67.33±0.67%-74.00±0.79%; p˂0.05). But control group of the gelatin was not acceptable to consumers (<30.00%). Using of sodium chloride (NaCl) at different concentrations alone did not affect the odor of the gelatin extraction. Bringing gelatin extracted from fish to use as an ingredient in food or applied in other industries. The unsuitable smell and color of gelatins are eliminated to avoid adverse effects on products and customers. From the previous result, the addition of both sodium chloride and activated carbon for treatment, the consumer acceptance scores significantly increased (p£0.05).
Proximate composition
The proximate analysis of Nile tilapia skin gelatin was given in Table 4. The result represented the high the protein, lipid, ash content but low value for moisture and carbohydrate content in skin gelatin when compared with bone gelatin. Nile tilapia skin and bone gelatin contained high protein content of 83.87±0.14% and 81.78±0.16%, respectively, which had higher protein content than Nile tilapia skin as 82.53% by Ratnasari et al., (2013)29. The extracted gelatin from Nile tilapia skin and bone had the moisture content of 4.28±0.89% and 6.75±0.08%, respectively, which was lower than under the terms of GME (2005)30 stated that the edible gelatin must be moisture up to 15%. Gelatin with a moisture content of 6-8% makes it difficult to study the physical and chemical characteristics because it absorbs and retains water easily.30-31 Ash content in the Nile tilapia bone and skin was in the range of 1.44±0.01–2.40±0.03% which is not exceeded the maximum limit of 2.6%32 and should not exceed 2% for the edible gelatin.30 However, the ash content in the fish skin is higher than the recommended maximum limits, which indicates the Nile tilapia skin gelatin inappropriateness for using as a food ingredient but can be applied in other industries. In order to make edible gelatin, the ash content should be improved prior to product development.
Gelatin color/clarity
The color in gelatin extracts from Nile tilapia bone and skin was expressed in terms of L*, a* and b*. A significant difference in the color of the Nile tilapia bone and skin gelatins were presented in Table 4. Nile tilapia bone and skin gelatin had brownish-gray and light brown color, respectively. Several key factors like fish species, raw materials and extraction conditions have influenced the color of the extracted gelatins from fish. The color and clarity of a gelatin gel are important aesthetic properties which depended on the application. But Nile tilapia bone gelatin solution was showed high transmittance (%T), the skin gelatin solutions of Nile tilapia represented very poor %T (Table 4). Inorganic compounds, proteins and from chemicals and microorganism contaminants that are present or not removed during its extraction had a great effect on turbidity and dark color of the extracted gelatins.33
Table 4: Proximal composition and Characteristics of Nile tilapia fish skin and bone gelatins
| Properties of gelatin | Fish skin gelatin | Fish Bone gelatin |
| Proximal composition (%) | ||
| Protein | 83.87±0.14 | 81.78±0.16 |
| Moisture | 4.28±0.89 | 6.75±0.08 |
| Lipid | 1.49±0.08 | 0.54±0.07 |
| Ash | 2.40±0.03 | 1.44±0.01 |
| Carbohydrate | 7.96±0.00 | 9.49±0.00 |
| Color | ||
| L* | 45.05±0.41 | 56.72±1.66 |
| a* | -1.98±0.05 | -2.22±0.22 |
| b* | -1.57±0.17 | 8.30±1.67 |
| % Transmittance | 49.40±0.88% | 68.20±0.73% |
| pH | 6.19±0.26 | 10.53±0.19 |
| Bloom gel strength (g) | 860.50±14.14 | 295.40±10.98 |
| Emulsifying Capacity (%)1% gelatin | 26.80±0.92 | 24.30±1.97 |
| 2% gelatin | 29.40±0.92 | 32.13±0.50 |
| 3% gelatin | 33.00±1.78* | 35.67±0.70* |
* mean values in the same column and % gelatin with different superscripts differ significantly (p£0.05)
Gel strength
Gelatin has a high ability to form hydrogen bonds with water molecules to create a stable three-dimensional gel. Characteristic evaluation of the gel will focus on the strength of the gel, which is known as bloom value. Gel strengths of the Nile tilapia skin and bone gelatins were given in Table 4. The gel strengths of the bone gelatins (295.40±10.98 g) were significantly lower than that of skin gelatins (860.50±140.14 g) (p£0.05). The gel strengths of Nile tilapia in this study were higher than that of Ratnasari et al., (2013) (191.20 g).29 The extracted gelatin with the ability to weak gel is suitable for refrigerated products (frozen products) and low gelling temperatures products, but that with the ability to hard gel, it is suitable for various food products like confections for improvement the chewiness, texture, and foam stabilization. Karim and Bhat (2009)1 reported that the strength of fish gelatin is in the range of 124-426 g. While, Jamilah and Harvinder (2002)7 revealed that red and black tilapia gelatin had the gel strengths of 128.1 g and 180.8 g, respectively which is lower than that of gelatin from Nile tilapia skin and bones in this study. The difference in strength of the gel in various species based on the extraction process and the intrinsic properties of the collagen from various fish species. The isoelectric point is the factor to the strength of the gel and was controlled by pH adjustment.34 The pH values of Nile tilapia skin and bone gelatin were 6.19±0.26 and 10.53±0.19, respectively.
Emulsifying capacity
Emulsifier is the surface active agent that can adsorb to interfaced and produce the small droplets by reducing the interfacial tension during homogenization35 which occur from the hydrophobic region of the peptide chain.35,36 It was used in production of low-fat margarine and whipped cream.36 The emulsifying capacity of fish gelatin is shown in Table 6. Gelatin extracted from Nile tilapia skin and bone had the emulsifying capacity of 33.00±1.78% and 35.67±0.70% (3% of gelatin) (Table 4). Nowadays, demanding of natural emulsifiers to replace synthetic emulsifiers is likely to increase in the food industry due to adds security and adds value to the product. By protein extracted from various natural sources had a great ability to help the formation, improve the stability and produce desirable physico-chemical properties of the food products.37
Foaming capacity/stability
Foaming capacity and stability from fish gelatins were determined. Figure 1 shows that the foaming capacity of Nile tilapia skin gelatin (1.08±0.02 – 1.31±0.01 and 0.64±0.03 – 0.91±0.00, respectively) was higher than that from Nile tilapia bone (0.80±0.01 – 1.16±0.01 and 0.64±0.01 – 0.86±0.02, respectively). Foam formation is dependent on transportation, penetration and structural modification of the protein molecules at the interface between air and water.38 By good foaming abilities, proteins must be able to remove quickly into the air-water interface, unfold and rearrange at the interface.38 Townsend and Nakai (1983)39 reported that the foaming characteristic is positively correlated with the hydrophobicity of unfolded proteins. The controller of foam stability will cause by the interaction of proteins within the matrix of the film gelatin.40
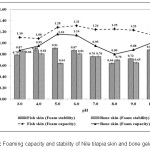 |
Figure 1: Foaming capacity and stability of Nile tilapia skin and bone gelatins Click here to View figure |
Development of Panna Cotta product
After fish gelatin extraction, the Nile tilapia gelatin bone is suitable ingredients for applying in Panna Cotta recipe and surveying satisfaction of customer by 5 points hedonic scale with 30 persons comparing with commercial gelatin. Figure 2 shows that Panna Cotta fermented milk mix berries and fresh milk have Fish bone gelatin as the food ingredient in the formula. It was found that the maximum satisfaction of female and male group was Panna Cotta fermented milk mix berries (Level 4: like vey much and Level 5: like extremely) and fresh milk (Fig. 2A-B), respectively. The Panna Cotta by commercial gelatin had satisfaction points approximately 3 to 4 (like moderately to like very much) . For the cost of production, the average cost was approximately 14.78-23.30 Baht/cup (200 g).
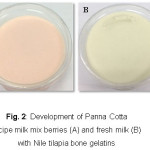 |
Figure 2: Development of Panna Cotta recipe milk mix berries (A) and fresh milk (B)with Nile tilapia bone gelatins Click here to View figure |
Conclusion
From this study, it can be concluded that fish skin and bone, especially Nile tilapia can be used to produce gelatin. The results clearly show that fish skins and bones represented the high gelatin yield and also have better functional properties when compared with commercial gelatin (bovine gelatin). Furthermore, extracted gelatin of the Nile tilapia bone, which are renewable sources of gelatin, can also be further exploited in food, pharmaceutical and cosmetic industries. It can be compared to mammalian gelatins available in the market.
Acknowledgements
We would like to thank the research funding of Applied Sciences Faculty, King Mongkut’s University of Technology North Bangkok (No. 6047101) financial support in this research. And we also thank the Department of Biotechnology, Faculty of Applied Science, KMUTNB for supplying all of the chemicals and equipment in this work.
References
- Karim A. A and Bhat R. Fish gelatins: properties, challenges and prospects as alternative to mammalian gelatins; Food Hydrocolloids. 2009;23(3):563-576.
CrossRef - Shahiri T.H, Maghsoudlou Y., Motamedzadegan A. and Sadeghi M. A. R. Optimization of physico-chemical properties of gelatin extracted from fish skin of rainbow trout (Onchorhynchus mykiss); Bioresource Technology. 2010;101(15):6207-6214.
CrossRef - Gómez-Guillén M. C., Gilménez B., López-Caballero M. E., Montero M. P. Functional and bioactive properties of collagen and gelatin from alternative sources: a review; Food Hydrocolloids. 2011;25(8):1813–1827.
CrossRef - Schrieber R. and Gareis H. Gelatine Handbook. Weinheim, Wiley-VCH, GmbH and Co, United states. 2007.
CrossRef - Jongjareonrak A, Benjakul S, Visessanguan W and Tanaka M. Skin gelatin from bigeye snapper and brown stripe red snapper: chemical compositions and effect of microbial transglutaminase on gel properties. Food Hydrocolloids. 2006;20:1216–1222.
CrossRef - Gudmundsson M. Rheological properties of fish gelatin; Journal of Food Science. 2002;67(6):2172–2176.
CrossRef - Jamilah B. and Harvinder K. G. Properties of gelatins from skins of fish–black tilapia (Oreochromis mossambicus) and red tilapia (Oreochromis nilotica); Food Chemistry. 2002;77(1):81–84.
CrossRef - Muyonga J. H, Colec C. G. B, Duodub K. G. Extraction and physico-chemical characterisation of Nile perch (Lates niloticus) skin and bone gelatin; Food Hydrocolloids. 2004;18(4):581–592.
CrossRef - Cho S, Jahncke ML, Chin K and Eun J The effect of processing conditions on the properties of gelatin from skate (Raja Kenojei) skins; Food Hydrocolloids. 2006;20(6):810-816.
CrossRef - Panayotis D. K, Soumela E. C, Anastasios Z. Extraction of Gelatin and Lipids from Yellowfin Tuna (Thunnus albacares) Skins: Physicochemical Characterization, Process Simulation and Economic Analysis; Journal of food processing and preservation. 2015;39(6):2361–2370.
CrossRef - Cheow C. S, Norizah M. S, Kyaw Z. Y and Howell N. K. Preperation and characterisation of gelatins from the skins of sin croaker (Johnius dussumieri) and shortfin scad (Decapterus macrosoma); Food Chemistry. 2007;101(1):386–391.
CrossRef - Liu H, Li D and Guo S. D. Rheological properties of channel catfish (Ictalurus punctaus) gelatin from fish skins preserved by different methods; LWT – Food Science and Technology. 2008;41(8): 414–419.
CrossRef - Anissa H, Ali B, Rafik B, Nabil S, Wael K and Moncef N. physicochemical and functional properties of gelatin from tuna (Thunnus thynnus) head bones; Journal of Food and Nutrition Research. 2011;50(3):150–159.
- Koli J. M, Basu S, Nayak B. B, Patange S. B, Pagarkar A. U and Venkateshwarlu G. Functional characteristics of gelatin extracted from skin and bone Tiger Toothed croaker (Otolithes ruber) and Pink pearch (Nemipterus japonicus); Food and Bioproducts processing. 2011;90(3):555–562.
CrossRef - Sinthusamran S, Benjakul S and Kishimura H. Characteristics and gel properties of gelatin from skin of seabass (Lates calcarifer) as influenced by extraction conditions; Food Chemistry. 2014;152:276-284.
- Gomez-Guillen M. C, Turnay J, Fernandez-Diaz F. M. D, Ulmo N, Lizarbe M. A and Montero P. Structural and physical properties of gelatin extracted from different marine species: a comparative study; Food Hydrocolloids. 2002;16(1):25-34.
CrossRef - Fitzsimmons K. Harvest, Handling, and Processing. In: Lim C and Webster C (eds) Tilapia: Biology, Culture, and Nutrition. Haworth Press, Binghamton. New York. 2006;607-616.
- Dekkers E, Raghavan S, Kristinsson H. G and Marshall M. R. Oxidative stability of Mahi mahi red muscle dipped in tilapia protein hydrolysates; Food Chemistry. 2011;124(2):640–645.
CrossRef - Hsu K. Purification of antioxidative peptides prepared from enzymatic hydrolysates of tuna dark muscle by-product; Food Chemistry. 2010;122(1):42–48.
CrossRef - Official methods of analysis of the Association of Official Analytical Chemists International, 18th ed. In Association of Official Analytical Chemists, Washington (D.C.). 2005.
- Robinson H. Wand Hodgen C. G. The biuret reaction in the determination of serum protein. I. A study of the condition necessary for the production of the stable color which bears a quantitative relationship to the protein concentration; The Journal of Biological Chemistry. 1940;135:707–725.
- Bergman I and Loxley R. Two improved and simplified methods for the spectrophotometric determination of hydroxyproline; Analytical Chemistry. 1963;35(12):1961–1965.
CrossRef - Marinova K. G, Basheva E. S, Nenova B, Temelska M, Mirarefi A. Y, Campbell B and Ivanov I. B. Physico-chemical factors controlling the foamability and foam stability of milk proteins: Sodium caseinate and whey protein concentrates; Food Hydrocolloids. 2009;23(7):1864–1876.
CrossRef - Wainewright W. Physical tests for gelatin and gelatin products. In: Ward AG and Courts A (eds) The Science and Technology of Gelatins, Academic Press Inc., London. 508–531.
- Kittiphattanabawon P, Benjakul S, Visessanguan W and Shahidi F. Gelatin hydrolysate from blacktip shark skin prepared using papaya latex enzyme: antioxidant activity and its potential in model systems; Food Chemistry. 2012;135(3):1118–1126.
CrossRef - Avena-Bustillos J, Olsen C. W, Olson D.A, Chiou B., Yee E., Bechtel P. J and McHugh T.H. Water vapor permeability of mammalian and fish gelatin films; Journal of Food Science. 2006;71(4): 202–207.
CrossRef - Foegeding E. A, Lanier T. C and Hultin H. O. Characteristics of edible muscle tissues. In: Fennema OR (ed) Food Chemistry. Marcel Dekker, New York. 1996;880–942.
- Zeng S, Yan X, Cao w, Hong P, Zhang C and Li Optimisation of extraction conditions and characteristics of skin gelatin from Nile tilapia (Oreochromis niloticus); International Journal of Food Science & Technology. 2010;45(9):1807–1813.
CrossRef - Ratnasari I., Yuwono S. S, Nusyam H. and Widjanarko S. B. Extraction and characterization of gelatin from different fresh water fishes as alternative sources of gelatin; International Food Research Journal. 2013;20(6):3085-3091.
- Monograph Standard method for the testing of edible gelatin. Gelatin monograph version 4 June 2005. Gelatin Manufactures of Europe. 2005.
- Cole C. G. B. Gelatin. In: Frederick J. F (ed) Encyclopedia of Food Science and Technology, 2nd (eds). Wiley, New York. 2000;1183-1188.
- Jones N. R. Uses of gelatin in edible products. In: Ward AG and Courts A (eds) The Science and Technology of Gelatin. Academic Press, London. 1977;336–394.
- Eastoe J. E and Leach A. A. Chemical constitution of gelatin. In: Ward AG and Courts A. (eds) The Science and Technology of Gelatin, Academic Press, London. 1977;73–107.
- Gudmundsson M and Hafsteinsson H. Gelatin from cod skins as affected by chemical treatments; Journal of Food Science. 1997;62(1):37–47.
CrossRef - Walstra P. Physical Chemistry of Marcel Dekker Inc., New York. 2003.
- Baziwane D and He Q. Gelatin: the paramount food additive; Food Reviews International. 2003;19(4):423–435.
CrosRef - Dickinson E. Hydrocolloids at interfaces and the influence on the properties of dispersed systems; Food Hydrocolloid. 2003;17(1):25–39.
CrossRef - Halling P. J. Protein stabilized foams and emulsions; CRC Critical Reviews in Food Science and Nutrition. 1981;15(2):155–203.
CrossRef - Townsend A. A and Nakai S. Relationships between hydrophobicity and foaming characteristics of food proteins; Journal of Food Science. 1983;48(2):588–594.
CrossRef - Mutilangi W. A. M, Panyam D and Kilara A. Functional properties of properties of hydrolysates from proteolysis of heat-denatured whey protein isolate; Journal of Food Science. 1996;61(2):270–274.
CrossRef

This work is licensed under a Creative Commons Attribution 4.0 International License.


