The Status of B Vitamin in Saudi Adults: A Review
Abeer M. Aljaadi1
, Maha Abdulrahim3, Najlaa H. Almehmadi1 and Abeer Salman Alzaben 2* 1Clinical Nutrition Department, Faculty of Applied Medical Sciences, Umm Al-Qura University, Makkah, Saudi Arabia.
2Department of Health Sciences, College of Health and rehabilitation sciences, Princess Nourah bint Abdulrahman University, Riyadh, Saudi Arabia.
3Research and Academic Accreditation Compliance, King Abdullah Bin Abdulaziz University Hospital, Princess Nourah Bint Abdulrahman University, Riyadh, Saudi Arabia.
Corresponding Author E-mail: asalzaben@pnu.edu.sa
DOI : http://dx.doi.org/10.12944/CRNFSJ.11.3.01
Download this article as:
![]()
Background and Objective: B vitamins are essential for maintaining several body functions. Assessing micronutrient status in a population is crucial for evaluating the individual or the population’s levels of nutrient sufficiency, deficiency, or toxicity; examining the relationship between a nutrient’s status and adverse health outcomes; and determining nutrient needs to establish reference values. There is lack of periodical national surveys in Saudi Arabia that assess the status of the B vitamins. Therefore, this review summarizes and critique the literature of B vitamin status in Saudi adults age of ≥18 years. Methods and Study Design: Databases (PubMed, Medline and Google Scholar) were searched for articles published between January 1980 to December 2022 using combinations of the terms “Saudi Arabia”, “status”, “level” along with all the corresponding vitamin B keywords and metabolites. Results: Forty three studies were obtained. Only 28 studies were included to the current review. Several studies conducted in Saudi adults measured folate and vitamin B12 status. Fewer studies assessed thiamine, riboflavin, and pyridoxine status. No relevant studies were found on the status of niacin, pantothenic acid, and biotin. Studies on thiamin status have not reported rates of deficiency except for one study reporting a prevalence of 3%. Conflicting findings were observed for riboflavin status, but the most recent evidence suggests a prevalence of 36.9% deficiency among Saudi adults. Folate deficiency appears to be low, whereas vitamin B12 might be of concern among Saudi adults. Conclusions: There were discrepancies in the results of some vitamin status in Saudi adults mainly attributed to differences in biomarkers used, methodologies, regional differences, and/or age group/population.
KEYWORDS:Adults; Micronutrients status; Saudi Arabia; Vitamin B
Introduction
The B vitamins are essential water-soluble nutrients that include vitamin B1 (thiamine), vitamin B2 (riboflavin), vitamin B3 (niacin), vitamin B5 (pantothenic acid), vitamin B6 (pyridoxine), vitamin B7 (biotin), vitamin B9 (folate) and vitamin B12 (cobalamin). These vitamins play important roles in energy production, nutrient metabolism, hematopoiesis, and gene expression.1 They also have benefits for the nervous system and gut microbiota regulation, and their deficiencies have been associated with a variety of neurodegenerative disorders and dysbiosis.2 Inadequacy in some of the status of B vitamins could have functional consequences on the other types of vitamin B complex, especially in one-carbon metabolism such as folate, vitamin B12, vitamin B6, and riboflavin, due to the interactions between B vitamins.
B vitamins complex status can be assessed by measuring the concentrations of these vitamins (or their metabolites) biochemically in the plasma/serum, erythrocytes, or urine.1 In addition, the adequacy of dietary intakes can be determined by comparing the intake to the Dietary Reference Intakes (DRI). The risk of B vitamins deficiency can lead to several diseases such as anemia, beriberi, and pellagra. Individuals with B vitamins deficiency may experience fatigue, numbness or tingling, and weakened muscles3 Based on our current knowledge, no national studies have assessed the dietary intake of B vitamins in Saudi Arabia.Despite the low prevalence of veganism in Saudi Arabia (<8%),4,5 several reports have indicated 10% of megaloblastic anemia 6 and about 25% of riboflavin deficiency.7,8 This maybe due to the low consumption of fruit and vegetables, as less than 3% of Saudis met the recommendations for daily consumption of fruits and vegetable based on national estimates. 9
In Saudi Arabia, there are mandatory and voluntary fortification/enrichment policies of food items with some nutrients including folic acid, niacin, riboflavin, and thiamin. Food fortification/ enrichment are required to be added to the wheat flour at the following amounts: 1.75, 52.91, 3.96, and 6.38 parts per million, respectively.10 Since 2000, Saudi Arabia has mandated folic acid fortification of wheat and enriched treated flour (150µg/100g) as an initiative to prevent neural tube defects (NTDs).11 These policies can significantly contribute to the populations’ dietary intakes and improve biochemical status. It has been reported that incidence rate for NTDs has significantly decreased post folic acid fortification from 1.46 to 0.81 per 1000 live births.12-14 Another study by Safdar et al. in 2007 found an apparent decline in the incidence of NTDs in newborns after folic acid flour fortification.12
Several studies examined individual B vitamin status in Saudi population, but there is a lack of reviews putting together these findings. Many of these studies in Saudi Arabia have explored B vitamins status in association with medical conditions or special population groups, such as diabetic patients, pregnant women and older adults. Therefore, the current review provides an extensive review and critique to the literature of B vitamin status reported by research studies conducted in Saudi Arabia in order to outline the B vitamin of concern among Saudi population and provide a direction to future research. The current review informs future studies on Saudi population to plan their experiments and tackle issues reported from previous studies. Evidence-based recommendations, as well as identification of nutrients of concern, allow for proper allocation of the country’s resources, particularly those directed toward establishing nutrient reference values and/or toward programs targeting nutrient deficiencies among certain age groups.
Materials and Methods
A search was conducted on previously published studies on vitamin B status in Saudi Arabia. Databases (PubMed, Medline and Google Scholar) were searched for articles published between January 1980 to December 2022 using combinations of the terms “Saudi Arabia”, and “status”, or“level” along with any the “vitamin B” names: vitamin B1, thiamine, thiamin, thiamine diphosphate (TDP), thiamine monophosphate (TMP), erythrocyte transketolase (ETK) essay, pyrophosphate or beriberi; vitamin B2, vitamin-G, riboflavin, erythrocyte glutathione reductase, flavin adenine dinucleotide (FAD), flavin mononucleotide (FMN); vitamin B3, niacin, nicotinamide, nicotinic acid; B4, choline, NAD/NADH, NADP/NADPH, niacin flush, or pellagra; vitamin B5, pantothenic Acid, co-enzyme-A; vitamin B6, pyridoxine, or plasma pyridoxal phosphate (PLP); vitamin B7, biotin, vitamin H; vitamin B9, folic acid, folate, plasma homocysteine (HCY), red cell folate, tetrahydrofolate (THF), or dihydrofolate (DHF); vitamin B12, cobalamin, cyanocobalamin , methylmalonic acid, plasma HCY, megaloblastic anemia, macrocytic anemia, or pernicious anemia. The inclusion criteria were studies published during 1980 to 2022, Male and /or female with the age of ≥18 years in Saudi Arabia, and patients with chronic diseases such as diabetes mellitus (DM), hypertension (HTN), dyslipidemia, Irritable Bowel Syndrome (IBS), and asthma. Studies that include pregnancy/lactation, patients with heart failure, stroke, chronic obstructive pulmonary disease (COPD), patients on supplementation and lack of sufficient data were excluded. The data was then extracted by two researchers independently and summarized in a table to be used for result analysis.
Results
A total of 42 studies were obtained, only n=28 studies were included in this review (Figure 1). n= 15 studies were excluded due to pregnancy/lactation, severe chronic disease, or lack of sufficient data. Overall, the majority of studies obtained were mainly on folate and vitamin B12 status (Table 1). One study reported results of all the following B-vitamins (thiamin, riboflavin, pyridoxine, folate, and vitamin B12). Three studies included results for both folate and vitamin B12. None of the included studies reported niacin, pantothenic acid, or biotin concentrations or any related biomarker in Saudi Arabia.
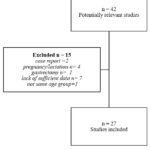 |
Figure 1: Summary of Studies Included in the Review |
Table 1: Studies on B vitamins status among Saudi Adults.
|
Reference/Author |
Population & Sample Size |
Region |
Biomarker cut-off |
Status (%) |
|
|
Vitamin B1 |
Al-Daghri et al (2013)16 |
236 (166 males and 70 females) with or without MetS |
Riyadh |
NA |
NA |
|
Al-Daghri et al (2015) 17 |
158 (77 with T1DM & 81 healthy controls) |
Riyadh |
NA |
NA |
|
|
Al-Attas et al (2011)15 |
Total 231 205 (43 T1DM & 162 T2DM) + 26 non-DM control |
Riyadh |
NA |
NA |
|
|
Albalawi et al (2022)18 |
3432 adults |
All the 13 administrative regions of SA |
Normal Serum Thiamin 28–85 μg/L |
111 participants (3.2%) |
|
|
Vitamin B2 |
El-Hazmi and Warsy (1987)20 |
502 Saudi males and 213 Saudi females |
Riyadh |
Normal Range of EGRAC = 0.9 to 1.2 Deficiency = 1.3 or above |
21-30 years: Male 14% and Female 65% 31-40 years: Male 28% and Female is 41%. and >41 years: Male is 29% and Female is 29% |
|
Elhazmi and Warsy (1989)7 |
502 Saudi males 213 Saudi females |
Different regions in SA |
Riboflavin deficiency as determined by an EGRAC value of 1.3 or above |
Male in Al-Hafouf, 32.6% Male in Jaizan 17.8% Male in Riyadh 17.1% Female in Al-Hafouf 41.5% Female in Jaizan 22.3% Female in Riyadh 37.9% |
|
|
Elhazmi and Warsy (1989)19 |
232 male and female hospital out-patients, Alula |
Alula |
AC value ranging from 0.9 to 1.20 indicated normal vitamin B2 EGRAC value of ≥ 1.30 indicated riboflavin deficiency |
29.3% of males had deficiency 35.9% of females had deficiency |
|
|
Al-Assaf et al (2007)8 |
202 Saudi Adults |
Riyadh |
Riboflavin in RBC Cut-off: NA |
NA |
|
|
Albalawi et al (2022)18 |
3432 adults |
All the 13 administrative regions of SA |
Normal Serum Riboflavin 2.3–14 μg/L |
1264 participant (36.9%) |
|
|
Vitamin B6 |
Al-Numair et al (2009)25 |
239 (127 males and 112 females) Only healthy and non-users of medications or dietary supplements (non-pregnant, none lactating and non-users of oral contraceptives for females) |
Alqassim |
Adequate status: plasma PLP >20 nmol/ L |
0% |
|
Al-Assaf et al (2003)22 |
51 smokers and non-smokers |
Riyadh |
Inadequate status: PLP concentration < 30 nmol/L; urinary 4-PA concentration < 3.0 µmol/L |
0% |
|
|
Al-Numair et al (2009)24 |
257 healthy smokers and non-smokers |
Dammam |
NA |
0% |
|
|
Albalawi et al (2022)18 |
3432 adults |
All the 13 administrative regions of SA |
Normal Serum Vitamin B6 8.7–27.2 μg/L |
57 participant (1.7%) |
|
|
Vitamin B9 |
Ahmed et al (2016)30 |
67 Patient |
Riyadh |
Serum Folate; cut-off not specified |
22% had low folate |
|
Al-Assaf et al (2007)29 |
309 (157 males) and (152 females) |
Riyadh |
Deficiency: < 3 ng/ml and <160 ng/ml for serum and RBC folate concentration, Adequacy: ≥5 ng/ml and ≥200 ng/mlfor serum and RBC folate concentration |
NA |
|
|
Ardawi et al (2002)27 |
1426 642 males 784 females |
Jeddah |
HCY >10.0 umol/L folate < 4.0 nmol/L |
HCY 34.5% folate 0 % |
|
|
Albalawi et al (2022)18 |
3432 adults |
All the 13 administrative regions of SA |
Serum Folate 4.6–18.7 ng/mL |
124 participant (3.6%) |
|
|
Khattab et al (2016)31 |
n =53 (males n= 28) and (females n= 25) |
Makkah and Taif cities |
Reference range for Folate In Makkah laboratory (4.6- 34.8 ng/ml). In Taif city laboratory (4.60- 18.70 ng/ml). Reference range for total HCY concentration (5.46 -16.20 umol/l) |
4% had low folate
58% had high HCY |
|
|
Alkhaldy et al (2020) 28 |
614 patients that had folate assessment requests |
Aseer |
Low serum folate is defined as level <10 nmol/L. |
2.8% had low serum folate |
|
|
Vitamin B12 |
Al-Daghri et al (2016)33 |
140 adults |
Riyadh |
Serum B12 Cut-off: NA |
NA |
|
Al-khamis et al (2016)43 |
110 with multiple sclerosis |
Riyadh |
Vitamin B12-deficient (< 200 pg/ml) Vitamin B12-replete (200–900 pg/ml) Vitamin B12-excessive (>900 pg/ml) |
30% presented with low levels of Vitamin B12 |
|
|
Alharbi et al (2018)45 |
412 |
Riyadh |
Serum B12 levels: Mild (118.1–132.8 pmol/L), moderate (88.6–118.1 pmol/L), and severe (< 88.56 pmol/L) deficiency. |
7.8% overall, 9.4% in metformin users 2.2% non-metformin users |
|
|
Alshammari et al (2019)35 |
363 T2DM patients |
Riyadh |
Serum B12 levels: serum levels less than 148 pmol/L or 200 pg/mL |
12.5% 2 were deficient between 16 patients |
|
|
Badedi et al (2019)36 |
323 108 cases with DFU 215 controls |
Jazan |
Serum B12 <148 pmol/L (Deficiency) |
Vitamin B12 deficiency Cases: 59% Controls: 32% |
|
|
Al-Musharaf et al (2020)37 |
341 |
Riyadh |
Serum B12 <148 pmol/L and insufficiency as <221 pmol/L |
deficiency was 0.6% (2/341) insufficiency was 5.6% (19/341) |
|
|
Jajah et al (202039 |
342 |
Taif |
Serum B12 Vitamin B12 normal (>300 mg/dl), borderline (200-300 mg/dl) deficient (<200 mg/dl) |
Deficiency in metformin users: 10.4% Borderline levels: 20.2% |
|
|
Al Saeed et al (2021) 44 |
307 |
Riyadh |
Serum B12 Deficiency: <150 pg/mL Borderline deficiency: (150-399 pg/mL) |
11 (3.6%) B12 deficient & 203 (66.1%) had borderline deficiency |
|
|
Almatrafi et al (2022)40 |
206 85 males 121 females |
Makkah |
Serum B12 <243 nmol/L |
17.5% |
|
|
Al-Musharaf et al (2022)38 |
92 Saudi Arabian females |
Riyadh |
Low Serum vitamin B12 (≤404.0 pg/mL) |
NA |
|
|
Alshehri et al (2019) 41 |
145 91 migraine 54 control |
Jeddah |
NA |
NA |
|
|
Ardawi et al (2002)27 |
1426 642 males 784 females |
Jeddah |
HCY >10.0 umol/L Vitamin B12 < 130 pmol/L |
HCY 34.5% Vitamin B12 0% |
|
|
Albalawi et al (2022)18 |
3432 adults |
All the 13 administrative regions of SA |
Normal serum B12: 187–883 pg/mL |
259 participants (7.5%) |
|
|
Alkhaldy et al (2020)28 |
614 patients that had folate assessment requests |
Aseer |
Low serum vitamin B12 is defined as level <179 pmol/L |
17.2% had low serum vit-B12 |
|
|
Khattab et al (2016)31 |
n =53 (males n= 28) and (females n= 25) |
Makkah and Taif cities |
Reference range for vitamin B12 Makkah city laboratory (211 – 946 pg/ml) In Taif city laboratory (240 – 900 pg/ml) Reference range for total HCY concentration (5.46 -16.20 umol/l) |
26% had low vitamin B12 58% had high HCY |
Thiamin (B1)
Four studies on thiamin status were conducted in Saudi Arabia. All of which were conducted in Riyadh except one study that included participants from different regions in Saudi Arabia. The earliest report on thiamin status among Saudis was a case-control study conducted in 2011 in Riyadh, where a total of n=231 adults (18-67 years old) included, but the majority had diabetes (n=43 type 1 diabetes; n= 162 type 2 diabetes).15 The study assessed both blood (thiamine, thiamine di-phosphate (TDP), thiamine monophosphate (TMP), and urinary thiamin concentrations; the functional indicator ETK activity in RBC was not assessed. Total blood thiamin was significantly higher among controls compared to diabetic patients: Control= 54.8±11.4 ng/mL; type 1 diabetes= 41.5±17.9 ng/mL; type 2 diabetes= 27.2±12.7 ng/mL).
Similarly, a cross-sectional study conducted on n=166 males and n=70 females in 2013 in Riyadh. Participants were recruited from primary care centers in Riyadh based on their metabolic syndrome status, it had more of a case-control design. The study assessed fasting blood thiamin derivatives (thiamine, TDP, TMP) and urinary thiamin concentrations. Mean ± SD participants’ age was 49.4 ± 16.5 and 53.7 ± 13.3 y in control group and metabolic syndrome groups, respectively.16 Thiamin concentrations were not shown for the total sample, but was presented by metabolic syndrome status, hypertension, and hyperglycemia. No significant differences were reported in any of the thiamin biomarkers between control groups and those with metabolic syndrome; mean ± SD total thiamin concentrations in whole blood of control vs. metabolic syndrome were 35.0 ± 1.8 vs. 31.3 ± 2.3 ng/ml, respectively.16 However, hypertensive participants (n=119) had lower concentrations of TDP and higher urinary thiamine concentrations compared to normotensive participants (n=117), whereas hyperglycemic participants (n=171) had lower blood TMP and TDP concentrations and higher urinary thiamine concentrations compared to normoglycemic participants (n=65). Rates of inadequate thiamin intake or thiamin deficiency were not reported.
A case-control study of 158 participants in Riyadh (n= 77 with type 1 diabetes and n=81 healthy controls) also assessed blood thiamine and its derivatives, as well as urinary thiamine concentrations.17 Controls were older than the cases and had higher total thiamin concentrations compared to control (42.9±15.1 ng/mL vs. 33.6±16.5 ng/mL). The only study on a large sample size of n=3,432 adults (18-87 y) was conducted between September 2019 and June 2021.18 The study selected participants living across the 13 administrative regions of Saudi Arabia (Riyadh, Makkah, Eastern Region, Northern Borders, Madinah, Jezan, Asir, Najran, Qassim, Tabuk, Hail, Al-Jouf, and Al-Baha). Serum thiamine pyrophosphate was determined using HPLC and 111 participants (3.2%) were classified as thiamin deficient (< 28 ug/L).18 Highest rate of thiamin deficiencies was among those aged 35–44 y. No significant differences were observed between men and women. Neither mean concentrations nor were ranges reported.18.
Riboflavin (B2)
Five studies assessed riboflavin status in Saudi population. Riboflavin, FMN, and FAD concentrations can be determined in plasma, serum, and erythrocytes to assess riboflavin status. Riboflavin status can be also determined using its functional indicators glutathione reductase activity coefficient, EGRAC.1 Three studies assessed the functional biomarker of riboflavin, glutathione reductase activity coefficient (EGRAC) and the other assessed serum or erythrocyte riboflavin concentrations.[7,19,20] A study conducted in Riyadh city (located in the middle of KSA) reported that 17.1% of the males and 37.9% of the females (total n=502) had riboflavin deficient status, defined as EGRAC ≥ 1.30, 20 whereas other studies reported a higher prevalence of deficiency among men in two other cities from different regions, Al-Hafouf (located in the East), Al-Ula (located in the West), and Jazan (located in the Southwest): 32.6%, 29.3%, and 17.8%, respectively.7,19 Sample size from each city is not reported in the abstract and we could not access the full articles. It is worth noting that EGRAC <1.00 has been reported previously.20 As in many of other older studies using older EGRAC methods and this has been criticized,21 Saudi females had higher rates of riboflavin deficiency compared to males. Rates of riboflavin deficiency among females from Al-Hafouf, and Riyadh (n=213), Al-Ula, Jazan were 41.5%, and 37.9, 35.9%, and 22.3%, respectively.7
A study on a large sample on Saudi adults reported that 37% had serum riboflavin < 2.3 μg/L (equivalent to 6.11 nmol/L), with males having higher rates of deficiency compared to females, 39.5% vs 34.2%.18 Currently, there is no cutoff of deficiency for serum/plasma riboflavin, FAD and FMN concentrations. Mean concentrations and ranges were not reported. It is not clear which form was assessed: total riboflavin or specific form: free riboflavin, FMN, or FAD.
Pyridoxine (B6)
Four cross-sectional studies have been conducted in three different cities in Saudi Arabia with one study included all the 13 regions in Saudi Arabia. A study conducted on n=51 male adults (n=20 of which considered from rural areas) with a mean± SD age of 33±6 years old living in Riyadh reported that 14 subjects (27.5%) had plasma pyridoxal phosphate (PLP) concentration < 30 nmol/L, indicating deficiency.22 Seven of which also had a urinary 4-pyridoxic acid (4-PA) concentration < 3.0 µmol/L on average; no significant differences were found in all vitamin B6 vitamers between subjects from urban and rural areas. All participants had adequate pyridoxine intake based on 3-d food records (consecutive) and none had intakes below 1.3 mg/d.[22] The mean BMI was 27.7 kg/m2 and that n=30 (59%) of the participants were overweight or obese (BMI ≥ 25); BMI has been reported to be negatively associated with PLP concentrations.23.
Another study that was also conducted in adult males (n=257), but in Dammam city, reported similar findings as none of the participants reported inadequate dietary B6 intake or had biochemical B6 deficiency based on mean plasma PLP <20 nmol/L and urinary 4-PA concentration < 3.0 mmol/d.[24] The third study was conducted in Al-Qassim region and included both males (n = 127; mean ± SD age 28.7±8.8 y) and females (n = 112; mean age 25.6±7.2 y). Both plasma and erythrocytes PLP concentrations were assessed, as well as dietary B6 intake [25] This study also reported that none of the participants had inadequate dietary B6 intake <1.3 mg/d based 3-d food record (consecutive). None of the participants had plasma PLP <20 nmol or urinary 4-PA excretion under <0.3 µmol/d; 63.8% were classified as overweight or obese that might have impacted vitamin B6 status.23
One study assessed pyridoxine status in a representative sample (n= 3,432 adults, mean age, 37.7 ± 11.7 years old).18 The study reported that only 57 participants (1.7%) had serum vitamin B 6 deficiency, however, a higher cut-off for deficiency was this study, 8.7 μg/L is the equivalent of 35.20 nmol/L that is higher than the commonly used cut-off of 20 nmol/L.18 Mean concentrations of PLP were not reported.
Folate (B9)
Folate status can be assessed using different biomarkers with serum/plasma folate being an easy and commonly used biomarker that reflects short-term status. Red blood cells folate is a good biomarker to reflect tissue folate contents, therefore long-term status.
The World Health Organization (WHO) has set criteria to define plasma/serum folate status as follows: elevated, >45.3 nmol/L; normal range, 13.5 – ≥ 45.3 nmol/L; possible deficiency, 6.8 – <13.4 nmol/L; deficiency, <6.8 nmol/L.[26] In this review, six studies assessed folate status of Saudi adults.
A study conducted in 2002 to establish total plasma HCY reference intervals for Saudi adults living in Jeddah (males: n=642; females n=784; 20-69 y) reported that none of the participants had folate deficiency (defined as serum folate < 4.0 nmol/L).27 Serum folate concentrations were higher in females than males, 14.40 ±5.26 nmol/L vs. 12.27± 4.84 nmol/L. The study also reported that n=84 (5.9%) subjects had serum folate concentrations between 4.22-6.36 nmol/L, indicating marginal status of deficiency. Proportion of participants with values less than 13.4 nmol/L (<6 ng/mL) have not been reported; those with folate concentrations < 13.4 nmol/L would be possibly deficient according the WHO criteria.[26] It appears that there were sex-specific differences in BMI and blood pressure but values were not compared statistically.
A retrospective study conducted on 614 patients (males; n=228, (37.1%), females; n=386, (62.9%)) in Southern Saudi Arabia (Abha) found mean ±SD folate serum concentration was 27.3 ± 0.5 nmol/L and that 2.8% of the patients have serum folate < 10 nmol/L.28 This study was based on patients who had folate test requested over a period of one year. The medical record of only 173 stated the reason for folate serum request and Anemia was the most common (45%); other medical history of these and other patients in the sample was not clear reducing the opportunity to understand the factors related to serum folate level.
A cross-sectional study in Riyadh was conducted among healthy adults where n=309 individuals (157 males,50.8%) and (152 females,49.2%) recruited and their serum folate was measured.[29] Cut-off values were at: deficiency: < 3 ng/ml and <160 ng/ml, adequacy: ≥5 ng/ml and ≥200 ng/ml for serum and RBC folate concentration, respectively. The result showed that serum folate was significantly lower in males (7.3 ± 2.0 ng/ml) compared to females (14.6 ± 6.0 ng/ml). However, only 1.9% of male participants had folate deficiency and 88.5% had adequate status, whereas 97.3% of females had adequate status and non had deficiency.29
Another cross-sectional study in Riyadh assessed serum folate as part of investigating the relation of different type of nutrients with Temporomandibular disorder (TMD). The study measured serum folate among 67 TMD patients with average age of 45 years (range; 25 to 55 years).[30] The study showed that 22% (n=10) of the patients had low serum folate based on standard laboratory value, but this was not specified by the authors.30 A study within institutionalized older adults performed a nutritional assessment in Makkah region.31 The study included 53 individuals (28 males, 52.8%) and (25 females, 47.2%) aged ≥ 60 years. The results showed that almost all subjects (96.23%) have normal folate level, while 3.77% of both males and females has low serum folate level (<4.6 ng/ml).31 A recent cross sectional study by Albalawi et al, 2022 was done in 13 Saudi regions included 3432 adults aged ≥18 years (mean age, 37.7 ± 11.7 years; women, 51.2%) to assess micronutrient deficiencies, and folate is one of them.18 The result of measuring serum folate showed that it is the second lowest vitamin deficiency (3.5%) and the levels were higher in men compared to women.
Cobalamin (B12)
Twenty-four studies have been conducted on vitamin B12 status in Saudi Arabia; seven of which targeted diabetic patients and one targeted patient with multiple sclerosis More than half (7out of 15) of studies on vitamin B12 were conducted in the city of Riyadh. The following biomarkers of vitamin B12 status are commonly used in population studies: serum/plasma vitamin B12 concentration, serum holotranscobalamin (holoTC) concentration, serum methylmalonic acid (MMA) concentration, plasma total HCY concentration.32 None of the studies in Saudi Arabia assessed MMA or holoTC 18,27,28,31,33-42
A cross-sectional study on 1426 participants (55% were females; 20-69 y) living in Jeddah was discussed in the folate section and reported that serum vitamin B12 mean±SD concentration was 239±73 pmol/L for males and 292±102 pmol/L for females; none of the participants had vitamin B12 <130 pmol/L.27 Although the study included healthy participants and were medically examined, they were recruited from primary care centers and no health indicators were reported except for mean BMI and blood pressure that were indicative of overweight/obesity and elevated blood pressure in some age groups; and only age and gender reported in the sociodemographic information.27
Three studies assessed B12 in healthy, non-smoker individuals, recruited from four Primary Health Care Centers within Riyadh (n=364).33,37,38 The study reported median of serum vitamin B12 concentrations of 421 pg/mL (290.6–530.6 pg/mL) and 371.25 pg/mL (288.6–496.3 pg/mL) in children and adults, respectively.33 Another study targeted diabetic adult patients with multiple sclerosis (n=110) recruited from four hospitals in Riyadh. The study reported that 65% of participants had adequate vitamin B12 status (200 – 900 pg/mL), whereas 30% had B12 < 200 pg/mL.43 About 5% had B12 > 900 pg/mL which considered high by the author although there are no clear cut-offs for elevated vitamin B12. The study lacks a comparison group and diabetes medication history, making it difficult to draw conclusion on whether multiple sclerosis is associated with low vitamin B12. Khattab et al. 2016 measured vitamin B12 status in 53 Saudi elders aged 60 to 105 years living in Makkah and Taif city.31 As reported by Khattab et al 2016, 26% of participants had low serum vitamin B12 (<211 pg/ml in Makkah city laboratory and <240 pg/ml in Taif city laboratory). Fifty-eight percent of study participants had high HCY concentration (>16.20 umol/L).31
Studies after 2016 mostly targeted diabetic patients except for five studies by Al Musharraf et al 2020 and 2022, a study by Alkhaldy et al 2020, Albalawi et al 2022; which included non-diabetic participants and one study by Alshehri et al 2019 included participants suffering of migraine.
Vitamin B12 – Studies in participants with diabetes
Five studies in diabetic patients assessed vitamin B12 in diabetic patients treated with metformin[35,39,40,44]and one that did not target metformin users.36
Almatrafi et al 2022 assessed 206 diabetic patients in Al-Noor Specialist Hospital in Makkah (n=85 males; n= 121 females) who were using metformin for at least six months.40 The study reported that 17.5% of the patients had serum B12 levels <243 nmol/L.40 The study had no control group to compare serum B12 among metformin users versus non-users and mean serum B12 was not reported. Lower rate of serum B12 deficiency (10%) was reported in Taif City (also in the Western region) among diabetic patients using metformin (n=347; mean age 58.10 ± 14.31 years). Mean serum B12 level was 464.99 ± 419.00 mg/dL.39
Three studies in Riyadh reported different rates of B12 inadequacy, but used different cutoffs. The first was conducted at King Abdulaziz Medical City reported that 3.6% of diabetic patients (n=11/307) who were using metformin had serum B12 < 150 pg/mL (the equivalent of 110.7 pmol/L).44 The study also reported that 203 (66.1%) had borderline deficiency (150-399 pg/mL). The majority in this study were also females (62.2%) and mean age was 58.69±11.1 years.44 Mean or median B12 were not reported and did not include control group either. The second study in Riyad conducted on diabetic patients using metformin (n=363; 57% females) reported the lowest number of B12 deficient as only two patients had serum B12 <200 pg/mL (=147.5612 pmol/L) and mean ±SD for all was 367 ± 139.95pg/mL; values of serum B12 in this samples ranged from 164.6-1288 pg/mL.35 The third study compared metformin users (n=319) with non-metformin users (n=93) and reported an overall prevalence of 7.8% of serum B12 < 132.8 pmol/L.45 The study reported mean concentration was 365.37±189.88 pmol/L among metformin users versus 313.69±141.84 pmol/L among non-users. Deficient serum vitamin B12 status (<132.8 pmol/L) was reported in n=30 (9%) of metformin users compared to n=2 (2%) of non-metformin users.
Only one retrospective study was conducted in Jazan (Southwest of Saudi Arabia) and examined patients attending the Jazan Diabetes & Endocrine Center with and without diabetic foot regardless of their metformin use.36 However, the majority were using metformin (87%) as the hospital’s protocol was to assess B12 in metformin users. The study included 108 newly diagnosed cases with diabetic foot ulcers and 215 control participants with type 2 diabetes free of foot ulcers. Rate of serum B12 <148 pmol/L was higher among cases compared to controls (59% vs. 32%); mean serum concentrations.36
What diet supported the adequacy?
Vitamin B12 – Studies in participants without diabetes
Almusharaf et al (2020, 2021 and 2022) assessed B12 intake and serum B12 in young females (n=346; 19-30 y) from university settings.37,38,46 The majority had adequate vitamin B12 status with 0.6% were classified as deficient when serum B12 < 148 pmol/L was used, whereas 6% of the women were classified as B12 insufficient when serum B 12 ≤220 pmol/L cut-off was used.37,38,46 About 92% of the participants consumed dietary intakes of the vitamin as recommended (> 2.4 mcg/d) and dietary vitamin B12 intake (Recommended Dietary Allowance> 2.4 mcg/d) was associated with lowers odd of having serum B12 insufficiency. Insufficiency of the vitamin was also associated with increased age, lower income level, and screen time (≥7 h/d).37,38,46
A cross-sectional study assessed the correlation between Migraine (a headache disorder) and vitamin B12 status in 91 Saudi females with migraine and a control group of n=54 female participant.41 The mean ± SD of serum vitamin B12 in Migraine patients was 255 ± 13 pmol/L and control group had mean serum vitamin B12 of 258 ± 15pmol/L.41 The study concluded that vitamin B12 status was not significantly correlated with migraine. The study by Alkhaldy et al (2020) assessed vitamin B12 in n=543 patients retrospectively.28 Patients’ data was collected from Aseer Central Hospital from either inpatient or outpatient clinics (Southern Saudi). Sampling was based on ordering of folate tests in the hospital from July 2018 to June 2019; no exclusion criteria were stated.28 Mean vitamin B12 concentrations of these patients with folate test requests was not reported but 17.2% had vitamin B12 concentrations < 179 pmol/ L.28 This was a very specific group, mainly patients, which explains the higher rate of B12 deficiency than previous studies.
A countrywide study has been conducted in 13 regions of Saudi Arabia (Riyadh, Makkah, Eastern Region, Northern Borders, Madinah, Jezan, Asir, Najran, Qassim, Tabuk, Hail, Al-Jouf, and Al-Baha) have found that; n= 259 (7.5%) of participants have vitamin B12 deficiency (serum B12 <187 pg/mL).18
Discussion
B vitamins play essential role in maintaining several body functions, including energy homeostasis, tissue growth and repair, and metabolic regulation. The objective of the current review was to identify the B vitamins status among Saudi adults as reported by original research studies since 1980. With the exception of vitamin B12 and folate, limited recent studies have assessed vitamin B1, B2 and B6. Therefore, it is difficult to draw conclusions regarding the status of the vitamins B1, B2 and B6. In general, folate deficiency was observed in around 3% and vitamin B12 was observed in 10-17% of Saudi adults based on serum/plasma concentrations.
Overall, limited studies have assessed B vitamins in Saudi Arabia and the majority was not representative to Saudi population, the sample size was small, and/or the sample was collected from one city which was usually Riyadh city (the capital city of Saudi Arabia). In addition, the studies have focused on type 2 diabetes due to 1) the influence of B vitamins in the incidence and the complications of type 2 diabetes, 2) the side effect of oral hypoglycemic agents in folate and vitamin B12 status, and 3) the increasing prevalence of type 2 diabetes in the last decade in Saudi Arabia.47,49
The majority of the studies have assessed the most common nutritional-deficiency anemias among female Saudi adults. Evidence shows that the most common type of nutritional-deficiency anemia was iron deficiency anemia followed by vitamin B12 deficiency anemia and folate deficiency anemia. One key factor for B vitamins deficiency is dietary intake. Poor dietary intake of vitamin B12 was observed in a previous study.50 A recent study by Al-Musharaf et al 2020 found that the vitamin B12 intake among individuals with sufficient vitamin B12 status (>220 pmol/L) was higher than individuals with insufficient vitamin B12 status (≤220 pmol/L). Among individuals with insufficient vitamin B12 status (≤220 pmol/L), 19% had estimated vitamin B12 intake below the Recommended Dietary Allowance. Dietary habits changes including junk foods and rigorous diets including vegetarianism.5,51,52 Studies that have assessed the status of B vitamins in Saudi Arabia were focused in Riyadh city and studies rarely reported dietary intakes. Some studies that reported dietary inadequacy of the group used the Recommended Dietary Allowance rather than the EAR, but overall rates of inadequacy were low. It is not clear whether the reported low status in some vitamins were due to inadequate dietary intakes or genetic factors affecting these vitamins absorption/metabolism.
In addition, there is inconsistency in the cut-off values used to define B vitamins deficiency. For example, vitamin B12 deficiency was defined as <148 pmol/L in 4 studies, <130 pmol/L in one study, and <180 pmol/L in two studies. In addition, there were some discrepancies in cut-offs were used in some studies to classify borderline or marginal status. Attention needs to be paid for units’ conversions and cut-offs used to define B vitamin status, especially for folate and vitamin B12 as some used the International System of Units and others used the traditional units. Several studies have reported the percent of sample below the cut-off values without providing the mean/median concentrations or range, making it challenging to compare studies particularly when cut-offs for deficiency is also different. Two studies reported on elevated vitamin B12 status (>701 or 664 pmol/L), but none of the studies reported on high folate status (>45 nmol/L).
Over 40% of the studies in each vitamin were conducted in Riyadh (not the region), one study that included cities from 3 regions, and one study that reported data on a representative sample of all the 13 administrative regions. Studies on populations selected from the Western regions were about 28%. Accordingly, comparisons across regions could not be performed. The only study on a representative sample of Saudi adults did not report on the regional differences either. We speculate differences in B vitamin status between regions as Saudi regions have diverse dietary patterns influenced by age, gender, and geographical locations.53-56
In 2000, folic acid fortification was introduced, while the other nutrients fortifications/ enrichments took place earlier. The earliest study on folate was conducted by Ardawi et al in 2002, post folic acid fortification, and aimed at establishing reference interval for HCY rather than assessing the change in folate status.27 Evaluating the changes in B vitamin status before and after the intervention programs (fortifications/ enrichments) is an area to be examined. This area was not the primary goal of the current review. Future studies could compare B vitamin status between fortified food consumers and non-consumers in Saudi Arabia.
Our review provides insights on the biochemical status of B vitamin in Saudi adults. It covered four decades of published studies and focused on adults without chronic diseases (except for diabetes), minimizing the confounding effect of these abnormalities on the metabolism of B vitamin. However, our review has some limitations. Actual prevalence of B vitamin deficiencies could not be obtained due to issues related to lack of reporting, differences in cut-offs used, and lack of sufficient studies and representation. Many studies did not report mean/median concentrations and the range of the assessed biomarker, providing little data that could facilitate comparisons at the national or the international level. In addition, methods used need to be distinctly described as methodological differences can explain some of the variability in the results. Few studies were not included due to access issues or being published in predatory journals that could have added more information, but these were only limited studies.
Conclusion
Overall, here we provided a comprehensive review on the B vitamin status of Saudi adults that differed between regions and sexes. The results suggest the lack of deficiencies in vitamin B6 and folate, particularly after the implementation of mandatory folic acid fortification. Studies showed potential for inadequacies in vitamin B12 and riboflavin status, but more recent studies on apparently healthy population is needed. Data are insufficient to establish reference values for Saudi adults given the variability in populations selected, recruitment strategies, methodological and biomarker differences in biochemical assessment, and reporting issues. Large national cohort studies are needed to assess the status of B vitamin and to assess the determinants of B vitamin insufficiency and/or deficiency in Saudi Arabia. Such studies need to be representative and take into consideration healthy individuals. Including individuals with common noncommunicable diseases, such as diabetes and hypertension, require a through medical history and medications used. When reporting proportions of deficiency, studies need to also report the absolute concentrations. Moreover, rates suboptimal/marginal deficiency is also recommended to report for vitamins that have established cut-offs, as health issues might arise from early stages of inadequacy. Methodological details were missing in many studies and more details would facilitate accurate comparison across studies. It is recommended to use established cutoffs to define status as much as possible or report status using more than one commonly used cutoff to minimize comparability issues between studies.
Acknowledgement
This project was supported by Princess Nourah bint Abdulrahman University Researchers Supporting Project number (PNURSP2024R207), Princess Nourah bint Abdulrahman University, Riyadh, Saudi Arabia.
Conflict of Interest
Authors disclose there is no conflict of interest.
Funding Sources
There is no funding sources.
References
- Gropper, Sareen S. , Smith, Jack L. , Carr TP. Advanced Nutrition and Human Metabolism. 8th ed. Boston, MA: Cengage; 2021. https://doi.org/10.1016/j.jneb.2022.02.001.
CrossRef - Mandić M, Mitić K, Nedeljković P, Perić M, Božić B, Lunić T, et al. Vitamin B Complex and Experimental Autoimmune Encephalomyelitis—Attenuation of the Clinical Signs and Gut Microbiota Dysbiosis. Nutrients 2022;14:1273. https://doi.org/10.3390/NU14061273/S1.
CrossRef - Ali MA, Hafez HA, Kamel MA, Ghamry HI, Shukry M, Farag MA. Dietary Vitamin B Complex: Orchestration in Human Nutrition throughout Life with Sex Differences. Nutrients 2022, Vol 14, Page 3940 2022;14:3940. https://doi.org/10.3390/NU14193940.
CrossRef - AL-Mohaithef M. Prevalence of vegan/vegetarian diet and eating behavior among Saudi adults and its correlation with body mass index: A cross-sectional study. Front Nutr 2022;9. https://doi.org/10.3389/FNUT.2022.966629.
CrossRef - Azhar W, Aljabiri S, Bushnaq T, Azzeh FS, Alyamani RA, Alkholy SO, et al. Knowledge, attitudes, and factors associated with vegetarianism in the Saudi Population. BMC Public Health 2023;23. https://doi.org/10.1186/S12889-023-15636-5.
CrossRef - Alfaris N, Altamimi J, Alkehayez N, Almushawah F, Alnaeem A, Alamri N, et al. <p>Prevalence of Anemia and Associated Risk Factors Among Non-Pregnant Women in Riyadh, Saudi Arabia: A Cross-Sectional Study</p>. Int J Gen Med 2021;14:765–77. https://doi.org/10.2147/IJGM.S299450.
CrossRef - El-Hazmi MA, Warsy AS. Riboflavin status in Saudi Arabia–a comparative study in different regions. Trop Geogr Med 1989;41:22–5.
- Al Assaf A, Osman M, Al Hamede F, Al Numair K. Assessment of riboflavin status by dietary intake and concentration in red blood cell of adult Saudis in Riyadh City – Saudi Arabia 2007:6–16.
CrossRef - El Bcheraoui C, Basulaiman M, AlMazroa MA, Tuffaha M, Daoud F, Wilson S, et al. Fruit and vegetable consumption among adults in Saudi Arabia, 2013. Nutr Diet Suppl 2015;7:41. https://doi.org/10.2147/NDS.S77460.
CrossRef - Food Fortification Initiative. Saudi Arabia — Food Fortification Initiative. Food and Agriculture Organization (FAO) of the United Nations 2022. https://www.ffinetwork.org/saudi-arabia (accessed March 12, 2023).
- FSAI. Report of the National Committee on Folic Acid Food Fortification Report of the National Committee on Folic Acid Food Fortification. 2006.
- Safdar OY, Al-Dabbagh AA, AbuElieneen WA, Kari JA. Decline in the incidence of neural tube defects after the national fortification of flour (1997-2005). Saudi Med J 2007;28:1227–9.
- AlShail E, De Vol E, Yassen A, Elgamal EA. Epidemiology of neural tube defects in Saudi Arabia. Saudi Med J 2014;35:S68.
- Seidahmed MZ, Abdelbasit OB, Shaheed MM, Alhussein KA, Miqdad AM, Khalil MI, et al. Epidemiology of neural tube defects. Saudi Med J 2014;35:S29. https://doi.org/10.1201/9780429278341-17.
CrossRef - Al-Attas OS, Al-Daghri NM, Alfadda A, Hussein Abd-Alrahman S. Blood Thiamine and Derivatives as measured by High-Performance Liquid Chromatography: Levels and Associations in DM Patients with Varying Degrees of Microalbuminuria. Subchronic Impact of Organophosphorus insecticide Triazophos on Liver, Kidneys and Thyroid in Albino Rats View project Vitamin D View project. Article in Journal of Endocrinological Investigation 2011;35:951–6. https://doi.org/10.3275/8126.
- Al-Daghri NM, Al-Attas OS, Alkharfy KM, Alokail MS, Abd-Alrahman SH, Sabico S. Thiamine and its phosphate esters in relation to cardiometabolic risk factors in Saudi Arabs. Eur J Med Res 2013;18:32. https://doi.org/10.1186/2047-783X-18-32.
CrossRef - Al-Daghri NM, Alharbi M, Wani K, Abd-Alrahman SH, Sheshah E, Alokail MS. Biochemical changes correlated with blood thiamine and its phosphate esters levels in patients with diabetes type 1 (DMT1). Int J Clin Exp Pathol 2015;8:13483.
- Albalawi O, Almubark R, Almarshad A, Alqahtani AS. The Prevalence of Vitamin and Mineral Deficiencies and High Levels of Non-Essential Heavy Metals in Saudi Arabian Adults. Healthcare 2022, Vol 10, Page 2415 2022;10:2415. https://doi.org/10.3390/HEALTHCARE10122415.
CrossRef - El-Hazmi MAF, Warsy AS. Riboflavin status in the population of Al-Ula 1989:276–80.
CrossRef - El-Hazmi MAF, Warsy AS. Riboflavin Status in a Saudi Population – A Study in Riyadh. Ann Nutr Metab 1987;31:253–8. https://doi.org/10.1159/000177276.
CrossRef - Hill MH, Bradley A, Mushtaq S, Williams EA, Powers HJ. Effects of methodological variation on assessment of riboflavin status using the erythrocyte glutathione reductase activation coefficient assay. Br J Nutr 2009;102:273–8. https://doi.org/10.1017/S0007114508162997.
CrossRef - Al-Assaf A. Evaluation of vitamin B-6 status of Saudi adult males in the Riyadh region – Saudi Arabia | ID: 3n204178d | ScholarsArchive@OSU. Oregon State University., 2003.
- Jarrett H, McNulty H, Hughes CF, Pentieva K, Strain JJ, McCann A, et al. Vitamin B-6 and riboflavin, their metabolic interaction, and relationship with MTHFR genotype in adults aged 18–102 years. Am J Clin Nutr 2022. https://doi.org/10.1093/AJCN/NQAC240.
CrossRef - Al-Numair K, Barber-Heidal K, Al-Assaf A. Vitamin B 6 Intake and B 6 Vitamer Concentrations and Excretion in Blood and Urine of Cigarette Smokers, Water-pipe Smokers and Non-smokers. J Saudi Soc for Food and Nutrition 2009;4.
- Al-Numair KS. Evaluation of Vitamin B Status of Adult Saudis in Al-Qassim Region-Saudi Arabia. Pakistan Journal of Nutrition 2009;8:923–7.
CrossRef - World Health Organization. Serum and red blood cell folate concentrations for assessing folate status in populations. Geneva: 2015.
- Ardawi MSM, Rouzi AA, Qari MH, Dahlawi FM, Al-Raddadi RM. Influence of age, sex, folate and vitamin B12 status on plasma homocysteine in Saudis. Saudi Med J 2002;23:959–68.
- Alkhaldy HY, Alqahtani M, Alamri ZS, Althibait NA, Ahmed MA, Alzahrani MA, et al. Clinical Appropriateness of Serum Folate ordering pattern in a tertiary care hospital in Saudi Arabia. Saudi Pharmaceutical Journal : SPJ 2020;28:905. https://doi.org/10.1016/J.JSPS.2020.06.010.
CrossRef - Al Assaf AH, Al Nasier AA, Al Khalifa AS. Folate status of adult saudis in Riyadh Region Saudi Arabia. New Egypt J Med 2007;37:7–12.
- Ahmed S, Tabassum N, Al Dayel O, Adnan Safar F, Ali Al Damkh A, Tariq Al Qahtani A, et al. Nutritional Assessment in Temporomandibular Disease: Creating an Awareness on Systemic Impact of Temporomandibular Disorder in Saudi Population. Journal of International Oral Health 2016;8:1023–5. https://doi.org/10.2047/jioh-08-11-06.
- Khattab HAH, Al-Saadoun ET. Nutritional assessment of institutionalized elderly in Makkah region, Saudi Arabia. Bioscience Research 2016;13:43–64.
- Allen LH, Miller JW, de Groot L, Rosenberg IH, Smith AD, Refsum H, et al. Biomarkers of Nutrition for Development (BOND): Vitamin B-12 Review. J Nutr 2018;148:1995S-2027S. https://doi.org/10.1093/jn/nxy201.
CrossRef - Al-Daghri NM, Rahman S, Sabico S, Yakout S, Wani K, Al-Attas OS, et al. Association of Vitamin B12 with Pro-Inflammatory Cytokines and Biochemical Markers Related to Cardiometabolic Risk in Saudi Subjects. Nutrients 2016;8. https://doi.org/10.3390/NU8090460.
CrossRef - Alharbi TJ, Tourkmani AM, Abdelhay O, Alkhashan HI, Al-Asmari AK, Rsheed AMB, et al. The association of metformin use with vitamin B12 deficiency and peripheral neuropathy in Saudi individuals with type 2 diabetes mellitus. PLoS One 2018;13. https://doi.org/10.1371/journal.pone.0204420.
CrossRef - Alshammari AN, Iqbal R, Baksh IP. Vitamin B12 deficiency and the knowledge and practice of physicians regarding screening for vitamin B12 deficiency among type 2 diabetic patients on metformin in selected hospitals in Riyadh, Saudi Arabia. J Family Med Prim Care 2019;8:2306. https://doi.org/10.4103/JFMPC.JFMPC_416_19.
CrossRef - Badedi M, Darraj H, Hummadi A, Solan Y, Zakri I, Khawaji A, et al. Vitamin B12 deficiency and foot ulcers in type 2 diabetes mellitus: A case–control study. Diabetes Metab Syndr Obes 2019;12:2589–96. https://doi.org/10.2147/DMSO.S233683.
CrossRef - Al-Musharaf S, Aljuraiban GS, Hussain SD, Alnaami AM, Saravanan P, Al-Daghri N. Low Serum Vitamin B12 Levels Are Associated with Adverse Lipid Profiles in Apparently Healthy Young Saudi Women. Nutrients 2020;12:1–11. https://doi.org/10.3390/NU12082395.
CrossRef - Al-Musharaf S, Aljuraiban GS, Al-Ajllan L, Al-Khaldi N, Aljazairy EA, Hussain SD, et al. Vitamin B12 Status and Gut Microbiota among Saudi Females with Obesity. Foods 2022;11:4007. https://doi.org/10.3390/FOODS11244007/S1.
CrossRef - Jajah MB, Althagafi AA, Alamri NM, Altowairqi RM, Binbaz SS. Prevalence of vitamin B12 deficiency in type 2 diabetes patient treated with metformin. The World Family Medicine (WFM) / Middle East Journal of Family Medicine (MEJFM) 2020;18:54–9. https://doi.org/10.5742MEWFM.2020.93730.
CrossRef - Almatrafi SB, Bakr ESH, Almatrafi AA, Altayeb MM. Prevalence of vitamin B12 deficiency and its association with metformin-treated type 2 diabetic patients: A cross sectional study. Human Nutrition & Metabolism 2022;27:200138. https://doi.org/10.1016/J.HNM.2022.200138.
CrossRef - Alshehri SA, Alshubaily FA, Alzubidi AA, Sonbol HS, Rahimuddin SA, Jambi EJ. The correlation between migraine and some biochemical parameters in saudi females. J Biochem Tech 2019;10:67–71.
- Al-Khamis F. Serum Vitamin B12 and thyroid hormone levels in Saudi patients with multiple sclerosis. J Family Community Med 2016;23:151. https://doi.org/10.4103/2230-8229.189126.
CrossRef - Al-Khamis F. Serum Vitamin B12 and thyroid hormone levels in Saudi patients with multiple sclerosis. J Family Community Med 2016;23:151. https://doi.org/10.4103/2230-8229.189126.
CrossRef - Al Saeed RR, Baraja MA. Vitamin B12 deficiency in patients with type 2 diabetes mellitus using metformin and the associated factors in Saudi Arabia. Saudi Med J 2021;42:161–5. https://doi.org/10.15537/SMJ.2021.2.25693.
CrossRef - Alharbi TJ, Tourkmani AM, Abdelhay O, Alkhashan HI, Al-Asmari AK, Rsheed AMB, et al. The association of metformin use with vitamin B12 deficiency and peripheral neuropathy in Saudi individuals with type 2 diabetes mellitus. PLoS One 2018;13. https://doi.org/10.1371/JOURNAL.PONE.0204420.
CrossRef - Al-Musharaf S, McTernan PG, Hussain SD, Aleisa KA, Alnaami AM, Wani K, et al. Prevalence and indicators of vitamin b12 insufficiency among young women of childbearing age. Int J Environ Res Public Health 2021;18:1–13. https://doi.org/10.3390/IJERPH18010001.
CrossRef - Al-Quwaidhi AJ, Pearce MS, Sobngwi E, Critchley JA, O’Flaherty M. Comparison of type 2 diabetes prevalence estimates in Saudi Arabia from a validated Markov model against the International Diabetes Federation and other modelling studies. Diabetes Res Clin Pract 2014;103:496. https://doi.org/10.1016/J.DIABRES.2013.12.036.
CrossRef - El-Kebbi IM, Bidikian NH, Hneiny L, Nasrallah MP. Epidemiology of type 2 diabetes in the Middle East and North Africa: Challenges and call for action. World J Diabetes 2021;12:1401. https://doi.org/10.4239/WJD.V12.I9.1401.
CrossRef - Valdés-Ramos R, Laura G-LA, Elina M-CB, Donají B-AA. Vitamins and Type 2 Diabetes Mellitus. Endocr Metab Immune Disord Drug Targets 2015;15:54. https://doi.org/10.2174/1871530314666141111103217.
CrossRef - Al-Musharaf S, McTernan PG, Hussain SD, Aleisa KA, Alnaami AM, Wani K, et al. Prevalence and Indicators of Vitamin B12 Insufficiency among Young Women of Childbearing Age. Int J Environ Res Public Health 2021;18:1–13. https://doi.org/10.3390/IJERPH18010001.
CrossRef - Alwosaifer AM, Alawadh SA, Abdel Wahab MM, Boubshait LA, Almutairi BA. Eating disorders and associated risk factors among Imam Abdulrahman bin Faisal university preparatory year female students in Kingdom of Saudi Arabia. Saudi Med J 2018;39:910–21. https://doi.org/10.15537/SMJ.2018.9.23314.
CrossRef - Fatima W, Ahmad LM. Prevalence of disordered eating attitudes among adolescent girls in Arar City, Kingdom of Saudi Arabia. Health Psychol Res 2018;6. https://doi.org/10.4081/hpr.2018.7444.
CrossRef - Moalla N, Al Moraie D. Dietary patterns in Saudi Arabian adults residing in different geographical locations in Saudi Arabia and in the UK in relation to heart disease risk 2014.
- Adam A, Osama S, Ibrar Muhammad K. Nutrition and Food Consumption Patterns in the Kingdom of Saudi Arabia. Pakistan Journal of Nutrition 2014;13:181–90. https://doi.org/10.3923/PJN.2014.181.190.
CrossRef - Moradi-Lakeh M, El Bcheraoui C, Afshin A, Daoud F, Almazroa MA, Al Saeedi M, et al. Diet in Saudi Arabia: findings from a nationally representative survey. Public Health Nutr 2017;20:1075–81. https://doi.org/10.1017/S1368980016003141.
CrossRef - Bawazeer NM, Qahtani SJ Al, Alzaben AS. The Association between Dietary Patterns and Socio-Demographic and Lifestyle Characteristics: A Sample of Saudi Arabia. Current Research in Nutrition and Food Science 2021;9:1046–57. https://doi.org/10.12944/CRNFSJ.9.3.29.
CrossRef
Abbreviations
AC: Activity coefficient
DFU: Diabetic foot ulcer
DM: Diabetes mellitus
EGRAC: Glutathione reductase activity coefficient
HCY: Homocysteine
MetS: Metabolic syndrome
NA: Non available
PLP: Plasma Pyridoxal Phosphate
RBC: Red Blood Cell
SA: Saudi Arabia
T1DM: Type 1 diabetes mellitus
4-PA: urinary 4-pyridoxic acid
Accepted on: 20 Nov 2023
Second Review by: Dimas Rahadian Aji Muhammad
Final Approval by: Dr. Reema Tayyem


Web of Science Coverage
Emerging Sources Citation Index (ESCI)
2024 Journal Impact Factor: 1.1
Scopus Journal Metrics
CiteScore 2025: 2.6
CiteScore Details
Sustainable Nutrition: Food Systems, Nutrient Retention, and Public Health Impact
![]()
This journal is a member of, and subscribes to the principles of, the Committee on Publication Ethics (COPE)


