Eating Patterns and Physical Activity in Older Adults Carpio Córdoba, Spain and Guadalajara Jalisco, Mexico
1Degree in Nutrition in (UNIVA) Atemajac Valley University, Zapopan Jalisco, Mexico
2Academic Area of Medicine (ICSA-UAEH) Institute of Health Sciences, Hidalgo State University, Pachuca City, Hidalgo State, Mexico.
DOI : http://dx.doi.org/10.12944/CRNFSJ.2.3.12
Download this article as:
![]()
Aging is a complex phenomenon and obvious, old age in Mexico is compared to disability, vulnerability, complexity and discrimination in our country's life expectancy is not very long compared to other countries. "Diet is the most important to delay or accelerate the aging process component." Aim. Determine differences in eating patterns and physical activity in older adults in El Carpio Córdoba, Spain and Guadalajara Jalisco, Mexico. Methods. A descriptive, cross-sectional comparative study in 156 elderly residents of El Carpio Córdoba Spain and Guadalajara Jalisco Mexico 156 was performed. Results. The results suggest that differences in life expectancy at birth, feeding, toxic habits and sporting aspects. The differences in patterns of diet and physical activity detected in this study in adults over. Conclusion. The Carpio Córdoba, Spain and Guadalajara Jalisco, Mexico could have transcendent meaning in the movement of life expectancy at birth, it represents in Mexico a possibility for feeding programs and physical activity for older people in order to support them in style and quality of life when young people built a legacy of experience and deserve to live longer and with better quality of life. In Spain Carpio live longer, have a higher consumption of toxic habits and do more sports activities in Guadalajara Mexico.
KEYWORDS:Food pattern; life expectancy; old age; toxic habits and physical activity
Introduction
In 2005, life expectancy reached 75.4 years for; women 77.9 years on average and men 73. Between 1970 and 2005 the indicator increased by 14.5 years. (Trevino et al, 2006; INEGI, 2006). The study of Geriatrics is very recent, Dr. Mario Paredes Espinosa, chief of internal medicine, the Old Civil Hospital of Guadalajara and Dr. David Leal in 1993 starts Geriatric care in the hospital. (Leal et al., 2006)
The Carpio Cordoba Spain, is located in the autonomous community of Andalusia, which has 4, 591 inhabitants (SIMA, 2008). In the autonomous community of Andalusia life expectancy is 80.23 years with good quality of life, as they are fully concerned about their diet and physical activity (SWISS, 2007). The aging process usually progressive and degressive begins at the time the individual has reached maximum capacity within the medium, including reproductive capacity (about 30 years in humans) to be affected differently depending on the factors affecting it, both endogenous (age, sex, race, genetic factors), and exogenous or environmental (Millan, 2006).
In relation to health, aging is accompanied by sensory, motor and intellectual impairments that decrease their quality of life, together with chronic degenerative diseases multicausal difficult and costly treatment. The primary objective is to reach old age with a good quality of life, this refers to the satisfaction of basic needs such as health, nutrition, retirement, retirement, housing, among others (Fernandez, 2000; Garcia, 2001; Carcache, 2002: Velarde and Avila, 2002; Trevino et al., 2006;).
As this Research Provides an Answer to the Following Mystery
What are the differences in eating patterns and physical activity in older adults in El Carpio Córdoba, Spain and Guadalajara Jalisco, Mexico? This research was conducted with the objective to determine the differences eating patterns and physical activity in older adults in El Carpio Córdoba, Spain and Guadalajara Jalisco, Mexico.
The treatment of the elderly has evolved significantly over time and across cultures to which it refers. In ancient times, there was a council of 22 elders or elderly people who formed the “Gerusía” advisory body to the king of Sparta. Homer (850 a. JC), refers to the capacity of the largest and fitness of young people to abide by the decisions made in the “council of elders”.
Plato (427 a. JC), emphasizes the idea that aging is the result of a lifetime, therefore, along the steps of previous old do you prepare for old age. Aristotle (384-322. JC), blamed the aging internal loss of body heat and moisture, so it was also practical at this time, advise the elderly to drink enough water.
Marcus Tullius Cicero (8106-43 JC.) In his Cato: old age, structured as a dialogue between Cato on old age and two young; recommended to maintain health, good food, drink and moderate exercise.
Galen (131-200) who first used the term to refer to gerontology aging and the care of the old, Maimonides (Cordoba 1135- 1204) emphasizes prevention of disease to grow old in the best possible conditions, Leonardo Da Vinci (1452-1519), aging was due to thickening of the veins (varices), preventing the flow of blood to the tissues, resulting in decreased nutritional content, which in turn would be producing the extinction of life slowly.
Roger Bacon (81210-1292), is considered one of the forerunners of Gerontology, as in his “History of life and death,” notes that life expectancy would be greater if improve conditions of hygiene, medical and social. The term “geriatrics” was first used by JL Nascher in 1909 in the play “Geriatrics: the diseases of old age and their treatment (Leal et al., 2006).
In Spain, the Spanish Society of Geriatrics and Gerontology is founded on May 17, 1948. Two years later, on July 12, 1950, is held in Liege (Belgium) First International Congress of Gerontology, in which participating companies Geriatrics different countries, including Spain, the International Society of Gerontology (IAG); United States and Britain as the main drivers in the development of this new specialty since the middle of last century, however, discipline evolving evenly in all other developed countries (Velarde et al., B2002). In 1990, the United Nations designated October 1 as “International Day of Older Persons” in order to raise awareness on the problems and needs of older people (Piña, 2003).
In Mexico during the Spanish colony, care for the elderly was directed only to the physically and socially handicapped; in the late nineteenth and early twentieth century the government and private foundations in Mexico developed public and private charity for the elderly. It was not until the seventies of the last century, the gerontology collection importance in Mexico. Different institutions concerned were created in gerontology, geriatrics as a medical specialty arises at the National Autonomous University of Mexico in 1992 and the University of Guadalajara in 1995, significantly in the Old Civil Hospital of Guadalajara in 1994 (Leal et al., 2006 ).
The aging of the world population advancing at a rate of 2% of adults over age 60 each year. Are estimated to live on the planet 600 million people over 60 years and is projected to be doubled by 2025 and by 2050 will amount to 2000 million (Shamah et al., 2008). In relation to Spain in 1951 the average life expectancy was 62.10 years, which means that in little more than half a century longevity has increased at 18 (SWISS, 2007). The quality of life is influenced by factors such as employment, housing, access to public services, urbanization, pollution, that make the social environment that influence human development of a community (Anonymous, 2001; Velarde and Avila, 2002 b).
Measuring the quality of life related to health has become in recent years the standard measure in clinical trials for measuring the effectiveness of interventions that go beyond traditional epidemiological measures of mortality and morbidity (Velarde and Avila, 2002; Duran et al., 2004), factors that determine the quality of life in old age are; family support, health, economics, relationships, widowhood, combined, allow to find a wide range of ways of aging. Elderly men require more family support than women, because the social network built along its life is often based primarily on the relationships established in the workplace (Salgado et al., 2005). The arrival of the retirement age, as an evolutionary feature, normative influence regains strength and returns to be an important determinant of aging urban to regional, municipal and metropolitan level is changing (Melendez et al., 2007), Mexico’s poor understanding of the process of generating the wrong policy decisions; municipalities in Mexico today and, further, metropolitan areas are unprepared to meet the challenge of aging urban and meet the needs and demands of older adults (Sanchez, 2007).
Diet and physical activity is one of the most important factors that reduce age-related decline of biological potential and allows ‘successful aging’. Maintaining independence, reduce disease and increase quality of life are important beneficial effects of physical activity in older people. Falls are more common in older people with balance disorders. The loss of strength and mobility are important risk factors. Falls are not an inevitable consequence of aging is no solid evidence that progressive interventions force balance and reduce the risk of falls in older people (Cruz et al., 2009). The nutritional requirements of the elderly in relation to energy tend to decrease due to a decline in basal metabolic rate and a reduction in physical activity, the average calorie intake of 2300 kcal per day for men and 1900 kcal per day in women, health problems arise when consumption totaling less than 1500 kcal per day (Mahan and Escott, 2001). Proper nutrition and nutritional care are key indicators of a good quality of life, disease prevention and sustainable health. (Cruz et al., 2009).
Pathologies in the Elderly
Mexico has limited information on the characteristics of the elderly environment, their health and nutrition profile. The available information comes from the National Survey of Chronic Diseases (ENEC-1993), and the National Health Survey 2000 (ENSA-2000); as well as (COEPO, 2008), where among the most common problems in people over 60; hypertension, obesity, type 2 diabetes mellitus, hypercholesterolemia, and some kidney diseases, arthritis or rheumatism, hypertension, blindness, deafness, or severe disabilities, nerves, chronic stomach problems, kidney disease, asthma, bronchitis or emphysema, diseases related with accidents, diseases of the teeth or mouth, diabetes, skin diseases, heart attack or other serious heart problems, fright, gallbladder problems related to pesticide use disease, liver disease, evil eye, stroke, cancer or malignant tumor, hepatitis, tuberculosis and other diseases that included, among others, epilepsy, thrombosis, bent spine, hernias and prostate problems (Salgado et al., 2005).
In the elderly, malnutrition occurs as a result of the coexistence of various diseases of chronic evolution, loneliness and poverty generally have this population and the physical and mental changes that distinguish aging, especially those related to alterations of the oral cavity, a condition decreased food consumption and tendency to eliminate foods containing important nutrients for this age group (Vargas et al., 2007). Malnutrition is another health condition that affects a large proportion of older adults worldwide, and risk factors include social isolation, economic hardship, monotonous diets and diseases ( Velarde et al., 2002 b attributed; Trejo et al., 2009).
Eating Patterns in the Elderly
In our country there is little information regarding nutritional aspects in the elderly. In a study conducted in men and women sixty years and more, with a pattern of “free life”, ie non-institutionalized residents of the Federal District and able to fend for himself; 100 subjects were studied, 54 women and 46 men; the average age at first was 64.6 years (SD ± 5.9) and 66.8 seconds (SD ± 6.1). The average value ingested / energy was 24 h in women of 1166 kcal (SD ± 377) in men and 1583 kcal (SD ± 480) with statistically significant difference (p> 0.0001). Only 7.4% of women and 8.7% of men reported an energy intake equal to or greater than the recommendation (RDA) for this age group. In relation to foods consumed most frequently studied subjects, we observed that these were predominantly low to medium cost, and even if the chicken was consumed with some frequency in the population, were included mainly limited portions. It is known that animal protein sources are expensive and this was reflected in the study, since a large proportion of the population leaned toward increased consumption of vegetables and cereals. It was observed that dietary intake of a large percentage of individuals was lower than usual, due to extraordinary or unexpected situations which had altered their usual daily consumption pattern during the interview about their dietary habits (Velazquez, 2003).
The elderly are a group of nutrition, subsidiary risk monitoring their eating patterns. The aging process involves a series of physiological, psychological, social, economic, functional and clinical changes that may influence the supply and maintenance of proper health. According to some authors (Rubio MA, 2002) 15% of the elderly subjects can not tolerate or do not ever takes one or more protein foods (meat, fish, eggs, dairy), 10% have problems with appetite and 10-15 % should take a crushed food because they have trouble chewing and swallowing (SEGG, 20011).
According to another study by Schoenborn and collaborators published in 2006, one in four elderly Americans had lost all his teeth. Of the elderly over 80 year’s no institutionalized, 10% have trouble making the purchase and 30% cooking. When difficulties arise in conventional food intake or when the normal or baseline power is not feasible for a person who can continue to feed orally, without resorting to artificial feeding systems, or when the nutritional status of the person is not suitable and rapid intervention is required, the basic food access (ABA) must be entered. He could be considered as an “intermediate step” between traditional food and clinical nutrition or artificial, enteral and parenteral (SEGG, 20011).
ABA is defined as one that is modified to make it suitable for different clinical conditions, allowing also to nurture, maintain the pleasure of eating and facilitate intake in people who have difficulty doing so (SEGG, 20011). At this stage, the appetite and the amount of food eaten tends to decline due to the intake of foods with low nutritional or energy value (broths, gruel water, very cooked vegetables), so you should take extra care to provide a sufficient diet that contains all the nutrients and attractive (general health Council, 2005).
Studies assessing the dietary intake of the elderly population show an average reduction in intake of most nutrients with increasing age. (SEGG, 20011).
In the study conducted in May 2007 by the Department of graduates and research on food, at the National School of Biological Sciences in Mexico City Foods that older adults prefer to consume, these were determined: fruits, grains, tubers, legumes, and sugars; about the type of foods in each group are extensive varieties, expressing a preference food more smooth. One of the most preferred was the cereal because they like to include in your eating pasta for soup, others prefer to eat bread in different varieties.
The group of legumes is variable, it was like to include in your diet more preferably to beans. Exhibit preference for fats because they relate to a better taste in food, including vegetable oils. In group of sugars, they consume more refined sugar for the fruit, are an important source of vitamins and minerals in average consumption, only 57% consume at least one serving of fruit for breakfast, there is one variety in the types of fruits most consumed, individuals older indicate that the choice of these fruits is based mainly for consistency and price. Vegetable consumption by 13%, the choice is based on consistency and cereal consumption is the main contribution of energy in the food, all the elders include bread (100%) at breakfast and only 20% eat omelets at breakfast, bread is the cereal most consumed, yet there are significant differences in the type of bread they consume 50% of respondents elderly consume bread with salt (bobbin lace) tortilla consumption at breakfast is 40%. Regarding the consumption of legumes only 10% and consuming more beans.
The animal products most consumed at breakfast are: sausage, egg and cheese, the egg is the food that is consumed in greater proportion, 55% of seniors include in its egg supply, however it is different as it consuming alternative only 38% and 36% accompanying with omelet, and only 5% with accompanying vegetables. Cheese is the second animal products consumed by the population of the elderly, is consumed by 31%, there are differences in the type of cheese consumed, 61% consume fresh cheeses, On the preparation of food, a unit for preparing indirectly limiting food consumption is observed. It is observed that the consumption of soup is 100%, the most consumed soup is the soup of pasta, consumes 77%. Eating stew was 100%, which includes in its one type of meat stew, 59% consume meat daily in different varieties, legume consumption is 70% on food, but there are differences in the type legume.
Food consumption is less at dinner and Energy Consumption determination, that same energy is below the recommendations in elderly individuals, corresponding to energy derived from lipids with poor protein intake hydrates carbon specific recommendations covering seniors, proteins are below the recommendations and lipids recommendation (Vargas et al, 2007) are exceeded.
As they age, individuals try to preserve as much as possible their eating habits, as the consumption of easier to chew and digest (soups, purees, ground beef, etc.), food is seen as a symbol of deterioration. The transition to the stratum of elderly age is itself considered to be degradation (Gutiérrez and Llaca, 2012).
Longevity
An investigation called Blue Zones, Dan Buettner project’s Quest Network, Inc. who studies the regions of the world where people who normally leads an active life, live beyond the age of 100 years was performed. Demographers and scientists have classified these longevity points by the ability of its people to live longer on average than the rest of the people in the world.
The features they have is that the people living in the Blue Zones have a lifestyle in common with similar characteristics that contribute to their longevity (Morales, 2007; Lytle, 2012). The longevity of the inhabitants of the Mediterranean basin aroused the curiosity of researchers, and enjoying longer life expectancy than other developed countries. After several years of studies, scholars concluded that the secret was in the Mediterranean diet and more specifically in its flagship product: olive oil (Carcache, 2002).
Aim
To determine the differences in eating patterns and physical activity in older adults in El Carpio Córdoba, Spain and Guadalajara Jalisco, Mexico.
Materials And Methods
A descriptive, cross-sectional comparative study in 317 elderly divided into two groups of 156, Guadalajara Jalisco Mexico residents and 156 residents of El Carpio Cordoba Spain was performed. A survey where dietary habits determined, food frequency, type of exercise, toxic habits and disorders in older adults in El Carpio Córdoba Spain and Guadalajara Jalisco, Mexico was applied.
Comparability of the sample was performed by comparing the survey applied to seniors in El Carpio Córdoba Spain and Guadalajara Jalisco, Mexico in January 2010, using the SPSS-15 statistical package.
Limits
a) time- The period of onset was in the months of November, 2009 to January, 2010 with respect to fieldwork.
b) Lugar – El Carpio Córdoba, Spain and Guadalajara Jalisco, México.
c) Person Adults over El Carpio Córdoba Spain and Guadalajara Jalisco México.
Inclusion Criteria
Adults over 65 years of El Carpio Spain and Guadalajara Mexico, regardless of whether or not curse with a chronic illness.
Criteria for Non-Inclusion
No adults under 65 are included.
Criteria for Removal
Those who began their participation in the survey for some reason decided not to continue.
Methodology
a. Data Collection Instrument: a survey that was applied in the city of Guadalajara Jalisco Mexico and El Carpio Cordoba Spain, which took place in the months of September 2009 and early January 2010, was performed.
b. Test Pilot: A pilot of a 10% sample size in El Carpio Córdoba Spain and Guadalajara Jalisco Mexico was conducted.
c. Technical data intervention: a database at D-Base III Plus and the statistical analysis of the data was performed using SPSS-15 was constructed.
General Plan
He attended in December at The Capio Spain, in which the pilot, which allowed establishing an understanding of each of the items in both population of Spain and Guadalajara Jalisco Mexico, was applied after piloting the instrument was applied and polished and tested both types of population, also information on finding alimentary detect important differences that allowed generate hypotheses for further research are analyzed.
Results
156 people of El Carpio Cordoba Spain studied, 83 (53.2%) corresponds to female and 72 (46%) were males studied, the minimum age was 65 years, with a high of 99 with a mean of 79.06 and a standard deviation of 6.63. (Table 1).
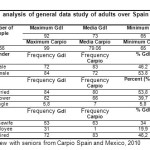 |
Table 1: Comparative analysis of general data study of adults over Spain Guadalajara and El Carpio Click here to View table |
Regarding marital status 80 (51.3%), 66 people were married (42.3%) are widowed and 7 (4.5%) in their work situation 63 (40.4%), persons engaged in home, 1 (0.6), people still are workers and 88 (56.4%) are retired. (Table 1). As for drinking, 80 (51.3%), non-drinkers, and 76 (48.8%) people if they drink alcohol. Of which 46 (31.5%) people drink wine and 27 (17.3%) people drink beer, 120 (76.9%), non-smokers and 36 (23.1%), if they smoke. 81 (51.9%), people do not drink coffee and 75 (48.1%), even upon the consumption of tea, it was found that 83 (53.2%), people do not drink tea and 73 (46.8 %), yes. (Table 2). 
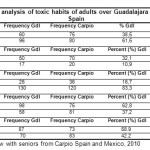 |
Table 2: Comparative analysis of toxic habits of adults over Guadalajara Mexico and El Carpio Spain Click here to View table |
Health problems, 102 (65.4%) people did not have gastrointestinal problems and 54 (34.6%) if, 102 (65.4%) without hypertension and 54 (34.6%) if, 144 (92, 3%) did not have diabetes 12 (7.7%) yes, regarding rheumatic diseases 122 (78.2%) people do not have this disease and 34 (21.8%) yes, (Table 3). Finally regarding the exercise proved that 34 (21.8%) did not play sports and 122 (78.2%) do. (Table 4).
Of the 156 people in the third age of the Metropolitan Zone of Guadalajara Jalisco Mexico of which 84 (54%) corresponds to female and 72 (46%) were males, the minimum age was 65 years, with a high of 92 with a mean of 73 and standard deviation of 5.95 (Table 1).
Regarding marital status 84 (53.8%), 62 were married (39.7%) are widowed and 10 (6.3%) are single. (Table 1) Your employment situation indicates that 53 (34%), persons engaged in the home, 31 (19.9), there are still workers and 72 (46.2%) are already retired. (Table 1)
As for drinking, 96 (61.5%), non-drinkers, and 60 (38.5%) people if they drink alcohol. Of which 50 (32.1%) people drink wine and 17 (10.9%) people drink beer, 130 (83.3%), non-smokers and 26 (16.7%), if they smoke. (Table 2). According to the eating habits 58 (37.2%), people do not drink coffee and 98 (62.8%), if they take coffee, and it was found that 67 (42.9%), people do not drink tea and 89 (57.1%), if they take tea. (Table 2).
Health problems, it was found that 104 (66.7%) people did not have gastrointestinal problems and 52 (33.3%) if they had gastrointestinal problems. 103 (66.0%) without hypertension and 53 (34%) do. (Table 3).
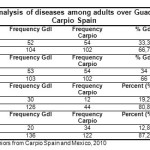 |
Table 3: Comparative analysis of diseases among adults over Guadalajara Mexico and El Carpio Spain Click here to View table |
Regarding diabetes was found that 126 (80.8%) people do not present and 30 (19.2%) itself. Rheumatic diseases 136 (87.2%) people did not have this disease and 20 (12.8%) if compared to last year 54 (34.6%) did not play sports and 102 (65.4%) if they perform any. (Table 4).
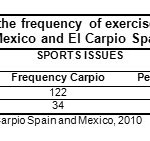 |
Table 4: Comparative table of the frequency of exercise in older adults in Guadalajara Mexico and El Carpio Spain Click here to View table |
When performing a comparative analysis of El Carpio Spain and Guadalajara, Mexico, about features globally in both populations was detected with respect to age, in Guadalajara Mexico average is 73.5 years and in El Carpio Spain 79 years, with P> 0.5. For substance abuse, alcohol detected in Guadalajara, Mexico, the average was 3846 and in El Carpio, Spain, an average of 4936 in regard to wine and beer, with a P <0.5 in Guadalajara, Mexico regarding smoking, the average was .1667 and El Carpio Spain, the average was 0.2308 with a P> 0.5. As for the average coffee consumption in Guadalajara was 6282 and the middle of 4808 in El Carpio with P> 0.5. Also tea consumption in older adults is 5705 Guadalajara and El Carpio in 4679 with a value of P <0.5. 
Health problems, gastrointestinal problems in Guadalajara have an average of .3333 and El Carpio was an average of 3462 with a value of P <0.5. Likewise hypertension in older adults with a mean of Guadalajara 3397 and 3462 in El Carpio, with a value of P <0.5. Diabetes in older adults with a mean of Guadalajara 1923 and in El Carpio half of 0769 with a value of P> 0.5. In rheumatic diseases in Guadalajara average that was presented in 1282 and El Carpio half of 2179 with a value of P <0.5. (Table 5).
Sports activities such as walking (gait) in adults over Guadalajara was an average of 6538 and in El Carpio half of 7821, with a value of P> 0.5. (Table 5).
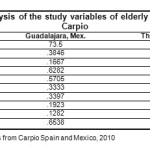 |
Table 5: Comparative analysis of the study variables of elderly Spain Guadalajara and El Carpio Click here to View table |
The frequency of food for the group of dairy, milk consumption in adults over Guadalajara, the average was 4.2308 and El Carpio, the average was 5.8462 with a P value> 0.5. Also yogurt consumption in adults over Guadalajara was a mean of 2.0385 and El Carpio, the average was 5.4679 with a P value> 0.5. (Table 6).
The consumption of fresh cheese in Guadalajara had a mean of 3.6282 and the average in El Carpio was 2.9295 with a P value> 0.5. In the consumption of other cheeses, such as aged, cured or semi-cured Guadalajara consumption average was .1154 and El Carpio an average of 2.81197 with a value of P> 0.5. (Table 6).
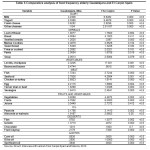 |
Table 6: Comparative analysis of food frequency elderly Guadalajara and El Carpio Spain Click here to View table |
The intake of cereals, bread consumption in Guadalajara, the average was 1.8077 and the average of El Carpio of 1.7500 with a P value <0.5. Also the consumption of bread as (virote-bobbin) in Guadalajara, the average was 4.0064 and El Carpio talking about bread as (ciabatta, baguette), the average was 4.1923 with a P value> 0.5. Swelled cereals consumption in Guadalajara, with a mean of 1.2628 and 0.3397 in El Carpio, with a value of P> 0.5. The Marias cookies turned Guadalajara with an average of 2.4679 and El Carpio an average of 2.8526 with a P value> 0.5. Regarding the sweet bread in Guadalajara, the mean was 1.5449 and El Carpio, the average was 1.3205 with a P value> 0.5. The consumption of chips or baked in Guadalajara was the average of 2.2692 and the average in El Carpio of 2.0321 with a P value> 0.5. The consumption of pasta in Guadalajara with a mean of 2.0064 and El Carpio an average of 1.5705 with a P value> 0.5. Finally, consumption of soup in Guadalajara adults with a mean of 2.0513 and 2.5064 in El Carpio of a P value of <0.5. (Table 6). Regarding the group of legumes, lentils or chickpeas consumption in Guadalajara had a mean of 2.3205 and 1.7821 in El Carpio of a P value of <0.5. regarding intake of beans in an average of 5.4744 Guadalajara and El Carpio in 9615 with a value of P> 0.5. (Table 6).
About the group of meat, fish in Guadalajara had a mean of 1.7244 and 2.7244 in El Carpio with a P value> 0.5, seafood consumption in Guadalajara with a mean of 2.7500 and 4.2564 in El Carpio de worth P> 0.5. The intake of chicken or turkey in Guadalajara, with a mean of 2.6923 and 1.8141 in El Carpio de valued at P> 0.5. Egg consumption in Guadalajara with a mean of 2.2115 and 1.5962 in El Carpio with a value of P> 0.5. Regarding the consumption of beef or beef in Guadalajara was the mean of 1.8269 and 1.0385 in El Carpio, with a value of P> 0.5. Sausages in Guadalajara with a mean of 1.6410 and 2.4541 in El Carpio de valued at P> 0.5. (Table 6).
Intake of fruits and vegetables, in Guadalajara, the average was 4.7692 and 3.8269 mean for vegetables and El Carpio average 6,000 fruit and vegetables mean 4.4872 with a P value for fruit> 0.5 and the value of P for vegetables> 0.5. Also the consumption of juices or juices in Guadalajara was the average of 3.0449 and the average in El Carpio was 2.7372 with a P value> 0.5. (Table 6).
The consumer group oil, peanuts (groundnuts), average in Guadalajara was 2.1795 and the average in El Carpio of 3.1410 with a P value> 0.5. Also the consumption of almonds or walnuts in Guadalajara average was 1.9167 and the average in El Carpio of 2.6603 with a P value of> 0.5. (Table 6).
Regarding the consumption of custard desserts in Guadalajara, the average was 8782 and the average in El Carpio of 1.3077 with a P value <0.5. Also the consumption of gelatin in Guadalajara, the average was 1.3718 and the average in El Carpio was 0.4872 with a P value> 0.5. Chocolate consumption average in Guadalajara was 1218 and the average in El Carpio of 1603 with a value of P <0.5. And finally the consumption of fruit in syrup in Guadalajara, the average was 2179 and the average in El Carpio in 7308 with a value of P> 0.5. (Table 6).
As for the intake for oil, consumption of corn oil in Guadalajara, the average was 6538 and in El Carpio said oil is not consumed, with a value of P> 0.5. Also the consumption of olive oil in Guadalajara was the average of 2500 and average in El Carpio average was 1,000 with a value of P> 0.5, the consumption of sunflower oil in Guadalajara, the average was 3846 and El Carpio is not consumed, with a value of P> 0.5 (Table 6).
Discussion
The National Institute of Statistics and Geography (INEGI), in 2005, in Mexico found that life expectancy at birth is 75.4 years; women live 77.9 years on average for 73 years for males. These results agree with those obtained in this investigation.
The National Statistics Institute (INE), 2007 found that life expectancy at birth stood at 80.23 years in Spain, representing an increase of two years in the last decade. These results are similar to those obtained in this study.
In the publication “Assessment of food consumption and power quality in older groups”; was found that 100% of older adults (300 respondents) prefer foods such as fruits, grains, legumes, and sugars; about the type of foods in each group are extensive varieties, expressing a preference for softer food consistency on preferences in the type of cereal: 100% of elderly respondents like to include in your diet pasta soup 70% prefer bread in different varieties and a lower percentage cookies and other cereal.
The group of legumes is variable, 100% of individuals older, I like to include in your diet to legumes in different varieties; Preferred type of legumes, 50% prefer the beans and the remaining 50% is from other varieties. The animal products are accepted by this age group, 60% prefer to consume meat, 30% prefer to consume egg and 23% prefer cheese and only 10% do not like to consume animal products. Dairy: Regarding the milk group: 90% of those seniors like milk and only 10% do not like. Preferences in the type of fat: 70% of seniors prefer to consume fat, fat consumption associated with a better taste in food.
About the type of fat they prefer: The elderly prefer to use vegetable oils. (Vargas, 2007). These results are consistent with research conducted, also other food of choice for the elderly such as oil were found, in which almonds are most preferred in the meat group of fish the greatest pleasure in Spain and chicken in Mexico, and the group of fats, prefer olive oil Spain and Mexico in corn oil.
Some areas in which we agree are from The Plan of Action on Ageing, adopted at Madrid by the Second World Assembly on Ageing (2002), which stresses that the activities for the promotion of health, prevention of diseases to throughout life, and equitable access of older persons to health care are cornerstones of a healthy aging. It is recommended to take measures to promote universal and equitable access to primary health care setting and community health programs for the elderly.
The Madrid Action Plan also calls for an end to discrimination based on age and other factors as a barrier to access to health systems. The policy framework for active aging, WHO, launched on the occasion of the World Assembly on Ageing in 2002, focuses on the lifestyle and the factors that determine health during aging. Besides putting emphasis on health promotion, prevention and equitable access to primary health care (PHC) and extended stay, this policy framework stresses the fact that health and social services should be integrated and coordinated and effective in terms of their cost. There should be no discrimination in the provision of services based on age, and providers of such services should treat people of all ages with dignity and respect (Hoskins, R et al, 2005).
Mexico is fertile ground for the stage in the demographic transition and because a growing consensus on the importance there is greater scientific contribution to the study, analysis and design of public policies toward aging, aging and the older population. (Montes de Oca, 2010) The challenge is to become aware that aging is inevitable and it is necessary to compensate with quality services and health care, giving back means giving recognition to those who were participants in developmental time and their energies of those in that age and experience, in several countries, are not considered to obtain the rights as a citizen, to dignified treatment, to give even a right that has earned for their efforts, live with dignity, warmth and quality of life.
Conclusions
Adults over El Carpio Spain live longer than seniors in Guadalajara Jalisco, Mexico, also consumed more drinks, mainly red and white wine, Snuff, from the meat group consume more fish and meats mainly prosciutto, more dairy, fruits and oilseeds seniors in Guadalajara Jalisco, Mexico.
Adults over Spain El Carpio perform more physical activity like walking to the elderly in Guadalajara Mexico.
Adults over El Carpio Spain have a higher rate of rheumatic disease in Guadalajara Mexico.
Adults over Guadalajara Mexico take more coffee and tea, preferably consumed corn oil, while in El Carpio Spain preference is olive oil. They have a higher rate of diabetes in The Carpio Spain.
The differences in patterns of diet and physical activity detected in this study in adults over El Carpio Córdoba, Spain and Guadalajara Jalisco, Mexico could have transcendent meaning in the movement of life expectancy at birth, it represents in Mexico a possibility for feeding programs and physical activity for older people in order to support them in style and quality of life when young people built a legacy of experience and deserve to live longer and with better quality of life, the challenge is focused on generating public policies needed to ensure near future every person.
Acknowledgements
The authors of the present research article would like to acknowledge and truly thank the collaboration of Yesenia Elizabeth Ruvalcaba Cobián who has a B.A in Teaching English as a Foreign Language, for her contributions on the revision and translation of the article; situation which allows the possibility to increase the transferring and modification of scientific knowledge.
The authors declare that there is no conflict of interests for the publication of this research paper.
References
- Anónimo. Estadísticas de mortalidad en México: muertes registradas en el año 2001. Salud Pública de México, 44, 2002: 565-58I.
CrossRef - Carcache, D. Españoles preocupados por la vejez y la soledad. La Prensa, 2002: 22691.
- (COEPO). Consejo Estatal de Población (2008/08/26). Recuperado 15 junio del 2009, del Web site: http://coepo.jalisco.gob.mx/PDF/Notasinformativas/notacoepo20089.pdf
- Consejo de salubridad general. (2005). Evaluación y control nutricional de adulto mayor en primer nivel de atención. Recuperado el día 25 de marzo de 2012, del web site: http://www.cen etec.salud.gob.mx/inferior/gpc.html
- Cruz, J. A., Pascal, S. A., Pierre, B. J. Documento europeo sobre el futuro de la promoción de la salud y las acciones preventivas, la investigación básica y los aspectos clínicos de las enfermedades relacionadas con el envejecimiento. Revista Española de Geriatría y Gerontología, 44, 2009: 61-65.
CrossRef - Durán, A. L., Gallegos, C. K., Salinas, Martínez, S. H. Hacia una base normativa mexicana en la medición de calidad de vida relacionada con la salud, mediante el Formato Corto 36. Salud Pública de México, 46, 2004: 306-315.
CrossRef - Fernández, B. R. La gerontología positiva. Rev Multó Gerontol, 10, 2000: 143-145.
- García, C. J. La importancia de la actividad física en ancianos. Entorno médico, 2001: 4.
- Gutiérrez, R. L. La salud del anciano en México y la nueva epidemiología del envejecimiento. CONAPO. (2004). Recuperado 13 junio del 2009, del Web site: http://www.conapo.gob.mx/publicaciones/sdm/sdm2004/sdm26.pdf
- Gutiérrez L., Llaca C. Nutrición del Anciano. Recuperado 18 de marzo de 2012, del Web site: http://www.facmed.unam.mx/deptos/salud/censenanza/spivsa/anciano/anciano.pdf
- (INEGI). ( 2006). Instituto Nacional de Estadística y Geografía Esperanza de vida, INEGI. Recuperado 19 julio del 2013, del Web site:http://www.inegi.org.mx/inegi/contenidos/espanol/prensa/Contenidos/capsulas/2005/sociodemograficas/esperanza.asp?s=inegi&c=1582
- Hoskins, I. Kalache, A. y Mende, S. Hacia una atención primaria de salud adaptada a las personas de edad. Rev Panam Salud Publica/Pan Am J Public Health 17, 2005 (5/6), 444-451
- Leal, M. D., Flores, C. M., Borboa, G. C. La geriatría en México. Mediagraphic, 8, 2006: 185-190.
- Lytle L. Blue zones Vitality proyecto. School of Public Health, Universidad de Minesota. 2012: Web site: http://www.sph.umn.edu/outreach/ engagement/buluezones.asp
- Mahan, K. L., Escott-Stump, S. Nutrición y Dietoterapia. Krause. México, D.F: Mc Graw Hill. 2001.
- Meléndez, J. C., Tomás, J. M., Navarro, P. E. Análisis de las redes sociales en la vejez a través de la entrevista Manheim. Salud Pública de México, 49, 2007: 408-414.
CrossRef - Millán, C. J. Principios de Geriatría y Gerontología. Aravaca, Madrid: Mc Graw Hill. 2006.
- Morales Güeto.,(2007). Salud y longevidad. J. Nutriterapia, España: Días de Santos. 2007.
- Montes de Oca Zavala, V. Pensar la vejez y el envejecimiento en el México contemporáneo. Renglones. (2010).52 (33) 3669-3487
- Piña, O. Apuntes para la historia de la gerontología en Yucatán México. Rev Biomed, 14, 2003: 205-210.
- Salgado, N., González, V. T., Jáuregui, O. B., Bonilla, F. P. “No hacen viejos los años, sino los daños”: envejecimiento y salud en varones rurales. Salud Pública de México, 47, 2005: 294-302.
- Sánchez, G. D. Envejecimiento demográfico urbano y sus repercusiones socioespaciales en México. Retos de planeación gerontológica. Revista de Geografía Norte Grande, 38, 2007: 45-61.
CrossRef - (SEGG) Grupo de Trabajo de Atención Primaria, perteneciente a la Sociedad Española de Geriatría y Gerontología. (2011). Manual de atención al anciano desnutrido en el nivel primario. Recuperado el día 25 de marzo de 2012, del web site: http://www.nutrinfo.com/archivos/ebooks/manual_anciano.pdf
- SIMA (Sistema de Información Multiterritorial de Andalucía)-El Carpio, Córdoba 2008: Recuperado 29 julio del 2009
- Shamah, L. T., Cuevas, N. L., Mundo, R. V., Morales, R. C., Cervantes, T. L., Villalpando, H. S. Estado de salud y nutrición de los adultos mayores en México: resultados de una encuesta probabilística nacional. Salud Pública de México, 50, 2008: 383-389
CrossRef - SWISS (Noticias Suizas al Ritmo del Mundo). La esperanza de vida se sitúa en 80,23 años en España. Noticias Suizas al Ritmo del Mundo. (2007/10/29) Recuperado 29 junio del 2009
- Trejo, P. C., García, R. J., Garza, V. O., Sánchez, E. P., Martínez, G. M., García, S. I. Valoración antropométrica y bioquímica en ancianos hospitalizados. RESPYN. 2009: 3.
- Treviño S. S., Pelcastre, V. B., Márquez, S. M. Experiencias de envejecimiento en el México rural. Salud Pública de México, 48, 2006: 30-38.
CrossRef - Vargas, H. X., Gallardo N., Yoja, T. Evaluación del Consumo de Alimentos y Calidad de Alimentación en Grupos de la Tercera Edad. ICA, 2007: 31-38.
- Velarde, J. E., Ávila, F. Ca. Evaluación de la calidad de vida. Salud Pública de México, 44, 2002: 350-361
- Velarde, J. E., Ávila, F. Cb. Consideraciones metodológicas para evaluar la calidad de vida. Salud Pública de México, 44, 2002:. 448-463.
- Velázquez M. Dieta: Una aproximación de lo que consumen los adultos mayores y pautas para mejorar la alimentación y nutrición de este grupo etario. RESPYN. 2003. .Recuperado 22 de marzo de 2012, del Web site: http://www.respyn.uanl.mx/especiales/ee-5-2003/ponencias_precongreso/02-precongreso.htm


Web of Science Coverage
Emerging Sources Citation Index (ESCI)
2024 Journal Impact Factor: 1.1
Scopus Journal Metrics
CiteScore 2025: 2.6
CiteScore Details
Sustainable Nutrition: Food Systems, Nutrient Retention, and Public Health Impact
![]()
This journal is a member of, and subscribes to the principles of, the Committee on Publication Ethics (COPE)


