
Introduction
Micronutrient deficiency is one of the main global health concerns. It is projected that more than two billion suffer from micronutrient deficiencies worldwide 1,2. The majority of people in low-income nations are often lacking in a variety of micronutrients 2. When people do not have access to micronutrient-rich foods including fruits, vegetables, animal products, and fortified meals, deficiencies arise.
In Kenya, vitamin A deficiency (VAD), vitamin B9 deficiency, and vitamin B12 deficiency are the main micronutrient deficiencies of concern 3. According to the Ministry of Health 4, folate deficiency affects 32.1 % of expectant women and 30.9 % non-expectant women. Vitamin B12 deficiency was found to be more prevalent in women aged 15-19 (47 %) than in older women (31.5 %) 3. Overall, 24 % of the Kenyan population are Vitamin A deficient, with preschool children having the highest prevalence at 53 % 4. A study by Harika, Faber, Mulugeta, Kimiywe and Eilander 5 reported that in Kenya, 15 % of children aged between 0 and 19 years are vitamin A deficient.
Micronutrient deficiencies can be avoided or eliminated if populations consume adequate amounts of the required micronutrients continuously 6. Food fortification is one of the approaches that has been utilized to alleviate the incidence of micronutrient deficiencies among Kenya’s vulnerable groups 7,8. Food fortification is the deliberate addition of a necessary micronutrient, such as vitamins, minerals, or amino acids, to a food, regardless of whether such nutrients were present in the food prior to processing; with the intention of enhancing its nutritional quality and delivering a public health benefit with a low risk of adverse health effects 9. A food vehicle for fortification should be widely consumed and readily available to the population 8. Maize flour, a staple food in most developing countries has been used as a vehicle to increase the intake of iron, zinc, retinol, and vitamins B1, B2, B3, B6, B9, and B12 6.
The effectiveness of a fortification scheme is highly dependent on the retention of micronutrients 10. The stability of the fortificant is affected by exposure to any chemical or physical elements, including heat, moisture, oxygen, light, or pH, during manufacturing, packaging, distribution, or storage. Stability and bioavailability of fortificants are among the important factors considered when selecting fortificants used in micronutrient premixes. Folic acid, retinyl palmitate, niacinamide, and riboflavin are the most stable and bioavailable forms of folate, vitamin A, vitamin B3, and vitamin B2 11.
Despite the fortification programs in many countries, there are still many cases of micronutrient deficiencies 8. One of the many factors influencing micronutrient stability in maize flour is storage conditions such as temperature and relative humidity. Vitamin losses have been reported to be higher than mineral losses in fortified foods during storage 12. For instance, zinc and iron are relatively stable whereas vitamin A and riboflavin are generally unstable under normal storage conditions 10,13. Higher temperatures and relative humidity decreases vitamin stability 10,12. According to Hemery, Laillou, Fontan and Avallone 10 vitamins showed losses of up to 90 % when stored at 40 ℃ temperature and 75 % relative humidity, over a twelve-month storage period.
The aim of this study, therefore, was to assess the influence of storage condition on the retention of retinol and B-vitamins in selected commercial fortified maize flour.
Materials and Methods
Sample collection
Fresh samples of fortified maize flours from two brands, coded XX1 and XY2, were sampled from the manufacturers at the point of production, on the same day that the fortificants were added. The fortificant premixes used to fortify the two different brands were from different suppliers. The samples were from large-scale commercial millers. The samples were thereafter brought to the laboratory for analysis.
Sample preparation
Samples from brands XX1 and XY2 were first conditioned for 72 hours at 25 °C and 75 % RH. After conditioning, a sample (0 month storage) was drawn and analysed for retinol, folate, niacin, riboflavin, and thiamine. The flour samples were then each divided into two equal batches, re-packaged in brown khaki bags to eliminate biasness due to differences in packaging material and then labeled with unique sample codes. The samples were then stored in two separate incubation chambers; one set at 25 °C and a relative humidity of 75 % and the other set at 35 °C and a relative humidity of 83 %. Relative humidity of 75 % and 83 % were achieved using saturated salt solutions of sodium chloride and potassium chloride respectively. These conditions were selected to reflect normal storage conditions commonly encountered in Kenya, namely storage conditions around Nairobi (25 °C/ 75 % RH) and storage conditions at the Kenyan Coast (35 °C/ 83 % RH). Under both storage conditions, sampling was done at monthly intervals for six months. At each sampling interval, the content of retinol, folate, niacin, riboflavin, and thiamine in the flour samples were analysed.
Determination of retinol
Extraction and quantification of retinol were carried out according to the method described by Zahar and Smith 14 with little modifications. Two grams of flour was weighed into a centrifuge tube. This was followed by adding 5 ml of ethanol containing 0.1 % (wt/vol) ascorbic acid and then 2 ml of 50 % (wt/vol) potassium hydroxide. The centrifuge tubes were capped, shaken well, and put in a water bath (Memmert WNB AC 230 V-50/60 HZ, Germany) at 80 ºC for 20 minutes. The tubes were shaken intermittently throughout this period. Using running water, the tubes were cooled before 20 ml of hexane containing 0.01% BHT (wt/vol) was added. The contents of the tubes were thoroughly mixed on a vortex mixer for one minute, and after standing for two minutes, the contents of the tubes were again mixed for another minute. Fifteen ml of cold water (1 ºC) was added to each centrifuge tube and then the tubes were inverted 10 times. The samples were centrifuged at 10000 rpm for 10 min. Afterward, the upper-organic layer was pipetted into a tube and the solvent was evaporated under vacuum at 40 ºC using a rotary vacuum evaporator (Hahnshin HS-2005S, water bath HS-3001, Korea). The residue was dissolved in 1 ml of methanol, ready for HPLC analysis. Twenty (20) µl of the sample was injected into reverse-phase HPLC (Shimadzu RF-20A, Japan) fitted with column C-18 ODS size 250 mm × 4.6 mm × 0.5 µm. The mobile phase was methanol and water in a ratio of 95:5 and the flow rate was 0.8 ml/min. A UV-visible diode-array detector (SPD – M20A) was used for the identification of retinol at 325 nm. Concentrations of retinol were calculated using peak areas of the samples and the standard curves of the retinol standards.
Determination of B-vitamins
Determination of vitamin B1 (thiamine), vitamin B2 (riboflavin), vitamin B3 (niacin), vitamin B6 (pyridoxine), and vitamin B9 (folate) was carried out according to Ekinci and Kadakal 15 with little modifications. To 5 g of sample, 20 ml of acidified deionized water was added followed by vortexing at medium speed for 1 minute. The mixture was then centrifuged for 10 minutes at 10000 rpm. The supernatant was drawn and filtered through 0.45 µm pore size membrane filters. Twenty µl of the sample was injected into reverse-phase HPLC (Shimadzu RF-20A, Japan); column C-18 ODS size 250 mm × 4.6 mm × 0.5 µm. The mobile phase constituted 100 mM KH2PO4 and MeOH in the ratio of 90:10 (v:v) and the flow rate was 1 ml/min. A UV-visible diode-array detector (SPD – M20A) was used. Thiamine, riboflavin pyridoxine, folic acid, and niacin were identified at 254 nm. The integrated peak areas of the samples obtained and the calibration curves of the corresponding standards were used to calculate the concentrations of the specific B-vitamins.
Statistical analysis
The standard deviations and mean values of all samples were computed. The means for the storage experiment were then analysed by two-way analysis of variance (ANOVA) using GenStat statistical tool (19th Edition, 2018) to assess the interaction effect between storage time, storage conditions, and brands on micronutrient stability. Tests were conducted at a 95 % confidence level and the interactions between storage conditions and storage time; storage time and brand were regarded as significant at p ≤ 0.05.
Results and Discussion
Vitamin A (Retinol)
At the beginning of storage, retinol concentration in brand XX1 and XY2 was 0.63 mg/kg and 0.51 mg/kg respectively. At 25 ℃/ 75 % RH, retention of retinol after six months of storage was 66.4 % and 73.3 % for brands XX1 and XY2 respectively (Figure 1). The amount of retinol retained after a 6-month storage period at 35 ℃/ 83 % RH was 54.3 % and 61.9 % for brands XX1 and XY2 respectively (Figure 2). For both brands at each monthly analysis, retention of retinol was higher for samples stored at 25 ℃/ 75 % RH as compared to those stored at 35 ℃/ 83 % RH. Overall, the results show significantly higher losses of retinol at high temperatures and high relative humidity. Retinol is more susceptible to losses in hot and humid surroundings than in cold and dry conditions 16. Temperature may influence the oxidation rate of fat-soluble vitamins such as retinol, resulting in decreased vitamin stability 17. It is also known that retinol is susceptible to isomerization because its structure contains double bonds 18. One of the most unstable vitamins is vitamin A, with retinol being more unstable as compared to other retinyl esters 18.
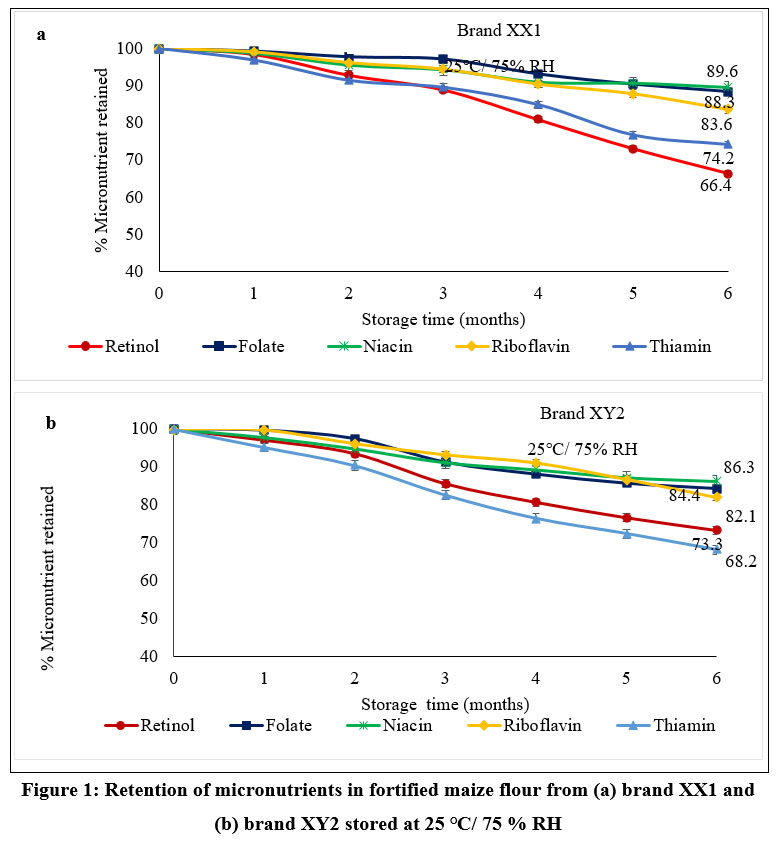 |
Figure 1: Retention of micronutrients in fortified maize flour from (a) brand XX1 and (b) brand XY2 stored at 25 ℃/ 75 % RH |
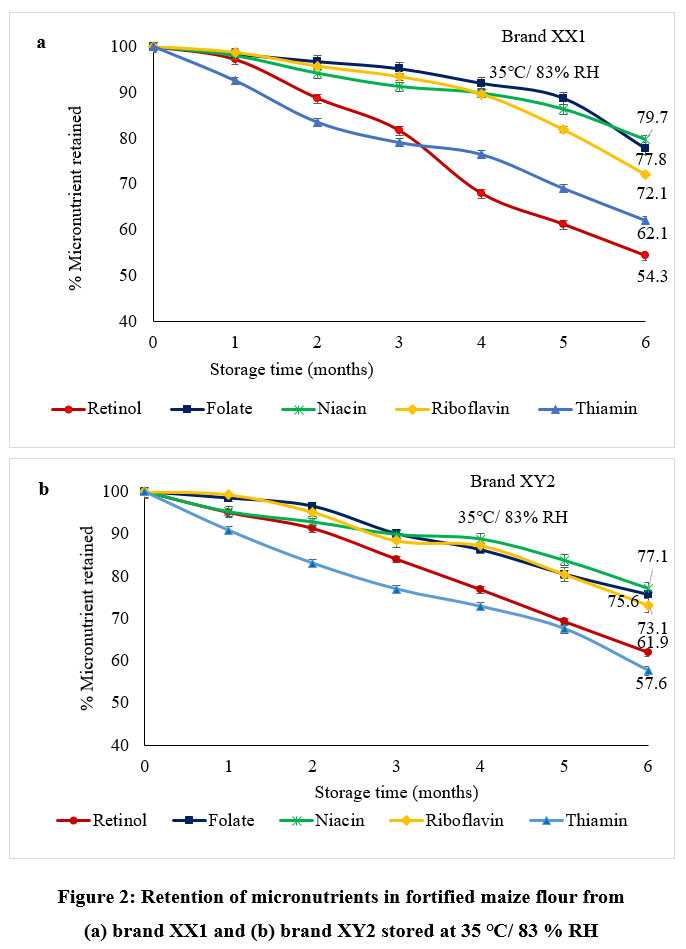 |
Figure 2: Retention of micronutrients in fortified maize flour from (a) brand XX1 and (b) brand XY2 stored at 35 ℃/ 83 % RH |
Retention of retinol was also brand-dependent (Figures 1 and 2), however, both brands depicted similar trends. The differences in retention capacity across the brands could probably be attributed to the different forms of vitamin A fortificant and the quality of the premixes used by different millers. Usually, fortificants are added to the selected food vehicle in the form of a micronutrient premix 6. Fortificants are defined as the source of micronutrients, while micronutrient premixes are a blend of different fortificants formulated to provide specified and determinable amounts of micronutrients 11. Fortification premixes vary in the type of encapsulates and antioxidants used in their formulation, which may affect the the stability of retinol across brands 19. Retinyl acetate, retinyl palmitate, and provitamin A (β-carotene) are some of the vitamin A forms (retinyl esters) that may be added to food during the fortification process 19. The protected form of retinyl palmitate, which is specially coated is the most stable and is usually preferred for use in flour fortification 12.
These results were different from those reported by Dunn, Jain and Klein 12 of 75 % vitamin A retention in cornmeal flour stored at 27 ℃ for six months. Higher retention values of 83.8 % and 75.7 % were reported by Khamila, Sila and Makhoha 13 after storage of fortified maize flour samples at 25 ℃ / 60 % relative humidity and 35 ℃ / 75 % relative humidity respectively for six months.
Vitamin B1 (Thiamine)
The amount of thiamine in brand XX1 and XY2 at the start of storage, was 2.91 mg/kg and 2.77 mg/kg. As shown in Figure 1, thiamine retention was higher in flour samples stored at 25 °C/75 % RH after six months, with 74.2 % and 68.2 % retention for brands XX1 and XY2, respectively. Like for retinol, samples stored at 35 ℃/ 83 % RH for six months showed lower retention values of 62.1 % and 57.6 % for brand XX1 and brand XY2 respectively (Figure 2). For all the brands investigated, the overall rate of thiamine degradation was higher in samples stored at 35 °C/ 83 % RH than in samples stored at 25 °C/75 % RH. For both storage conditions, thiamine was the least stable vitamin for brand XY2, while it was the second least stable vitamin for brand XX1. This variation may probably be due to the make-up differences in premixes sourced from different suppliers. Thiamine hydrochloride and thiamine mononitrate are the two commonly used salts for fortification and are both heat-labile and sensitive to both humidity and oxygen 20. If the makeup ingredients are not stable, the premix may not be stable 21. Thiamine is a vital micronutrient, however delivering it in food products is challenging due to its instability under heat, alkaline pH, and various processing/storage conditions 22. However, thiamine hydrochloride and thiamine mononitrate are both quite stable to oxygen in the absence of light and moisture and extremely stable when used in dry goods with light and moisture-resistant packaging 18. Thiamine hydrochloride, despite being sold in a crystalline state, also exists in an amorphous form, particularly in fortificants, which is more labile 23. Thiamine degradation rate increases with increased relative humidity 24.
Vitamin B2 (Riboflavin)
Riboflavin was relatively stable amongst the vitamins assessed. Initial riboflavin concentration for brand XX1 was 2.41 mg/kg and 2.34 mg/kg for brand XY2. Figure 1 illustrates that at 25 ℃/ 75 % RH, retention of riboflavin after six months of storage was 83.6 % and 82.1 % for brands XX1 and XY2 respectively. At 35 ℃/ 75 % RH, the amount of riboflavin retained after a 6-month storage period was 72.1 % and 73.1 % for brands XX1 and XY2 respectively (Figure 2). For both brands, retention of riboflavin was greater at 25 °C/75% RH than at 35 °C/75% RH under the specified storage conditions after each month. These values were different from those reported by Khamila, Sila and Makhoha 13 where fortified maize flour samples stored at 25 ℃/ 60 % RH and 35 ℃/ 75 % RH, 66 % and 54.4 % of riboflavin were retained respectively. Higher retention values of 94 % after storage for 24 months at 30 ℃ have been reported by Coad and Bui 25. According to Ottaway 18, riboflavin is relatively stable during heat processing, storage, and cooking. It degrades, though, when exposed to light. A combination of light and high temperatures make riboflavin generally unstable in food products 26. Riboflavin is degraded through cleavage of the isoalloxazine ring, yielding a number of unstable compounds 26.
Vitamin B3 (Niacin)
When compared to other vitamins analyzed, niacin was the most stable in both brands and both storage conditions. At the beginning of storage, the amount of niacin in brand XX1 and XY2 was 21.53 mg/kg and 17.20 mg/kg respectively. Niacin retention for the samples stored at higher temperatures and relative humidity was lower than those stored in lower temperatures and relative humidity (Figures 1 and 2). At 35 ℃/ 83 % RH, 79.7 % and 77.1 % niacin content were retained for brands XX1 and XY2 respectively at the end of storage (Figure 2). Higher retention values of 89.6 % and 86.3 % for brands XX1 and XY2 respectively were observed for samples stored at 25 ℃/ 75 % RH for six months (Figure 1). At every month of analysis for both brands XX1 and XY2, niacin degradation rate was lower for samples stored at 25 ℃/ 75 % RH than those stored at 35 ℃/ 83 % RH. Niacin retention values observed in this study were consistent with those reported by Khamila, Sila and Makhoha 13 of 87.7 % and 75.6 % for flour stored for six months at 25 ℃/ 60 % RH and 35 ℃/ 75 % RH respectively. Beizadea 27 reported higher niacin retention values of 94 % when fortified spaghetti was kept in the dark for three months at a temperature of 25 °C and 60 % relative humidity. Niacin exists as nicotinamide in fortified foods, and is usually stable during thermal processing, and exposure to oxygen and light 18. Although considered the most stable vitamin, niacin losses are mainly attributed to leaching into cooking water 28. Generally, maize has low niacin content. Fortification of milled flour reduces the risk of pellagra among the vulnerable population 29.
Vitamin B9 (Folate)
For brand XX1 and XY2, there was a folate concentration of 1.56 mg/kg and 1.40 mg/kg respectively, at the start of storage. As shown in Figure 1, there was 88.3 % and 84.4 % retention in samples stored at 25 ℃/ 75 % RH for brands XX1 and XY2 respectively after a 6-month storage period. On the other hand, brand XX1 and brand XY2 flour samples stored at 35 ℃/ 83 % RH retained 77.8 % and 75.6 % amounts of folate at six months (Figure 2). Folate degradation rate was lower for samples stored at 25 °C/ 75% RH than it was for samples stored at 35 °C/ 83% RH during every monthly analysis for both brands XX1 and XY2. These values compare favorably with the findings of Khamila, Sila and Makhoha 13 who reported 87.3 % and 75.9 % retention of vitamin B9 for flour stored at 25 ℃/ 60 % RH and 35 ℃/ 75 % RH respectively. Another study by Hemery, Fontan, Laillou, Jallier, Avallone and Berger 30 reported a retention range of 81- 83 %, regardless of storage temperature, after 3 months when wheat samples were kept at 65 % RH, which was fairly consistent with the findings of this study. Folate is relatively stable to humidity and heat 27. Light, temperature, oxygen, and pH are all environmental factors that can cause interconversion or degradation of folates, resulting in irreversible loss of activity 31. Folic acid is an essential micronutrient in the diet 32. The mechanism of folate degradation is determined by the vitamin’s structure and the chemical environment 33. Folate degradation typically involves alterations to the bond structures, the pteridine ring system, or both 31. In the presence of oxidants or reductants, folic acid can be cleaved and inactivated 31. A study conducted by Scientific Advisory Committee on Nutrition 34 reported that mandatory fortification at levels of 300 µg of folic acid per 100 g of flour increased the average folic acid intake of the UK population by about 80 µg/day and would be effective in reducing neural tube defects (NTD) risk by about 11-18 %.
The interaction between storage time, storage conditions, and maize flour brands on vitamin stability
Based on previous research conducted by Dunn, Jain and Klein 12, and Khamila, Sila and Makhoha 13 on vitamin stability in fortified foods during storage, it is expected that vitamin losses will occur over an extended storage period. In agreement, the current study indicated that vitamins in fortified maize flour are less stable after an extended storage time (Figures 1 and 2). However, the interaction between storage time and storage conditions was not significant (p > 0.05) for the amounts of retinol, thiamine, niacin, and folate in fortified maize flour stored for six months (Table 1). Additionally, as shown in Table 1, the F-observed values were less than the F-critical (2.24). These statistics indicate that there was no significant interaction between time and storage condition on the levels of of retinol, thiamine, niacin, and folate retained in the flour samples. There was, however, a significant (p < 0.05) interaction between storage time and storage condition on the amounts of riboflavin retained in the flour samples (Table 1). Further, as indicated in Table 1, the F-observed (6.04) is greater than the F-critical (2.24) hence the interaction of time and storage condition on riboflavin retention in fortified maize flour was significant. Overall, this observation means that despite the decrease in the vitamin content in the samples during storage, there was no significant difference in the changes at 25 ℃/ 75 % RH and 35 ℃/ 83 % RH except for riboflavin. Meaning even though the vitamin retention was higher in samples stored at a lower temperature and relative humidity (25°C/ 75% RH) than in samples stored at higher temperature and relative humidity (35°C/ 83% RH), the difference was not significant.
Table 1: The interaction between storage time, storage conditions, and maize flour brands on micronutrient stability.
| Micronutrients | Time vs Condition | Time vs Brand | ||
| P-values | F-values(observed) | P-values | F-values(observed) | |
| Vitamin A (Retinol) | 0.768 | 0.55 | 0.140 | 1.68 |
| Vitamin B1 (Thiamine) | 0.075 | 2.02 | 0.650 | 0.70 |
| Vitamin B2 (Riboflavin) | 0.001 | 6.04 | 0.935 | 0.30 |
| Vitamin B3 (Niacin) | 0.978 | 0.19 | 0.975 | 0.20 |
| Vitamin B9 (Folate) | 0.759 | 0.56 | 0.147 | 1.65 |
Level of significance = 0.05; F-critical value = 2.24
This may be explained by the small differences in temperature (10 ℃) and relative humidity (8 %) between the two storage conditions. Larger variations in storage temperature and relative humidity would probably indicate significant differences in the combined effect of storage time and the storage conditions on vitamin stability. The difference observed in riboflavin stability could be attributed to sample exposure to light both during sampling and sample preparation for analysis. Ribeiro, Pinto, Lima and Sousa 35 observed that after storage of vitamin formulations at 25 ℃ for 72 hours, riboflavin retention was 99 % and 94.7 % with and without photoprotection, respectively. This indicated that light influenced riboflavin stability during storage. Among all the vitamins assessed, light had the biggest impact on riboflavin’s stability 18,27.
Furthermore, the current study found that the combined effects of time and brand on the stability of retinol, thiamine, riboflavin, niacin, and folate concentrations in fortified maize flour stored for six months did not significantly differ (p > 0.05) (Table 1). Furthermore, as described in Table 1, the F-observed values were less than the F-critical (2.24). These statistics indicate that there was no significant interaction between time and brand on the levels of all vitamins retained in the flour samples. These results can be interpreted that although the vitamin content in the samples decreased during storage, there was no significant difference in the changes between brand XX1 and brand XY2. It therefore does not matter what brand the fortified maize flour is from since the vitamin changes are not significantly different. This observation may be attributed to the fact that vitamin premixes from different manufacturers are homogeneous in their technological development, therefore, reducing the differences in vitamin stability. These findings are in agreement with Yang, Wang, Li, Zhang and Ma 36 who reported that the vitamin supplier had no significant influence on vitamin A stability in vitamin premixes stored for 12 months.
Conclusions
With regards to storage stability tests, retinol was the least stable vitamin for brand XXI at both 25 °C/75% RH and 35 °C/83% RH, followed by thiamine, riboflavin, folate, and niacin. However, brand XY2 showed that under both storage conditions, thiamine was the least stable vitamin, followed by retinol, riboflavin, folate, and niacin. In comparison to samples stored at higher temperatures and relative humidity (35 °C/ 83% RH), samples stored at lower temperatures and relative humidity (25 °C/ 75% RH) retained more vitamins for both brands XX1 and XY2. Despite the decrease in the vitamin content in the stored samples, there was no significant difference in the changes at 25 ℃/ 75 % RH and 35 ℃/ 83 % RH except for riboflavin. The stability of vitamins for both brands XX1 and XY2 progressively decreased over the six-month storage period however, there was no significant difference in the changes between the two brands. The results of this study conclusively show that most vitamin losses in fortified maize flour occur during storage. There is need for more studies to assess the bioaccessibility of the vitamins added to maize flour during the fortification process. This is because the overall goal of fortification of flour is to make micronutrients available to vulnerable groups through the consumption of fortified flour products.
Acknowledgement
The authors thank the laboratory technicians of the Food Science and Technology department, JKUAT; Mr. Charles Njogu, Mr. John Muchuna, Mr. David Abuga, Mrs. Jessica Oruka, and Mr. Votha Mumo for their assistance.
Conflict of Interest
The authors declare no conflict of interest.
Funding Source
This work was funded by the European Union (EU) through Jomo Kenyatta University of Agriculture and Technology (JKUAT) (grant number Food/2016/380-039).
References
- Singh U., Praharaj C., Singh S., Singh N., eds. Biofortification of Food Crops.; 2016.
CrossRef - Bailey R. L., West K. P., Black R. E. The Epidemiology of Global Micronutrient Deficiencies. Ann Nutr Metab. 2015;66(suppl 2):22-33. doi:10.1159/000371618
CrossRef - KNMS. The Kenya National Micronutrient Survey. Published online 2011:1-150. http://www.nutritionhealth.or.ke/wp-content/uploads/Downloads/The Kenya National Micronutrient Survey 2011.pdf
- Ministry of Health. Point-Of-Use Fortification with Micronutrient Powders (MNPs): Improving The Nutrition Of Infants And Young Children Aged 6-23 Months Trainers’ Guide. 2020;(June).
- Harika R., Faber M., Samuel F., Mulugeta A., Kimiywe J., Eilander A. Are Low Intakes and Deficiencies in Iron, Vitamin A, Zinc, and Iodine of Public Health Concern in Ethiopian, Kenyan, Nigerian, and South African Children and Adolescents? Food Nutr Bull. 2017;38(3):405-427. doi:10.1177/0379572117715818
CrossRef - WHO. Recommendations on Wheat and Maize Flour Fortification. Meeting Report: Interim Consensus Statement. Published online 2009. http://www.who.int/nutrition/publications/micronutrients/wheat_maize_fort.pdf
- Harrison G. G. Public Health Interventions to Combat Micronutrient Deficiencies. Public Health Rev. 2010;32(1):256-266. https://publichealthreviews.biomedcentral.com/articles/10.1007/BF03391601
CrossRef - Ministry of Health. Kenya National Food Fortification Strategic Plan. Published online 2018:1-36.
CrossRef - WHO, FAO. Evaluating the Public Health Significance of Micronutrient Malnutrition. Guidel Food Fortif with Micronutr. Published online 2006.
CrossRef - Hemery Y. M., Laillou A., Fontan L., et al. Storage Conditions and Packaging Greatly Affects the Stability of Fortified Wheat Flour: Influence on Vitamin A, Iron, Zinc, and Oxidation. Food Chem. 2018;240:43-50. doi:10.1016/j.foodchem.2017.07.084
CrossRef - East African Community. Draft East African Standard Fortified Milled Maize (Corn) Products – Specification. Published online 2011. http://www.eac-quality.net/fileadmin/eac_quality/user_documents/3_pdf/DEAS_768_2011_Fortified_ milled_maize_products-_Specification
CrossRef - Dunn M. L., Jain V., Klein B. P. Stability of Key Micronutrients Added to Fortified Maize Flours and Corn Meal. Ann N Y Acad Sci. 2014;1312(1):15-25. doi:10.1111/nyas.12310
CrossRef - Khamila S., Sila D. N., Makokha A. Compliance Status and Stability of Vitamins and Minerals in Fortified Maize Flour in Kenya. Sci African. 2020;8. doi:10.1016/j.sciaf.2020.e00384
CrossRef - Zahar M., Smith D. E. Vitamin A Quantification in Fluid Dairy Products: Rapid Method for Vitamin A Extraction for High Performance Liquid Chromatography. J Dairy Sci. 1990;73(12):3402-3407. doi:10.3168/jds.S0022-0302(90)79036-4
CrossRef - Ekinci R., Kadakal Ç. Determination of Seven Water-Soluble Vitamins in Tarhana, a Traditional Turkish Cereal Food, by High-Performance Liquid Chromatography. Acta Chromatogr. 2005;(15):289-297.
- Kuong K., Laillou A., Chea C., Chamnan C., Berger J., Wieringa F. T. Stability of Vitamin A, Iron and Zinc in Fortified Rice during Storage and its Impact on Future National Standards and Programs-Case study in Cambodia. Nutrients. 2016;8(1):3-11. doi:10.3390/nu8010051
CrossRef - Saensukjaroenphon M., Evans C. E., Paulk C. B., et al. Impact of Storage Conditions and Premix Type on Fat-Soluble Vitamin Stability. Transl Anim Sci. 2020;4(3):1-10. doi:10.1093/tas/txaa143
CrossRef - Ottaway P. B. Stability of Vitamins during Food Processing and Storage. Woodhead Publishing Limited; 2010. doi:10.1533/9781845699260.3.539
CrossRef - Johnson Q., Mannar V., Ranum P. Fortification Handbook Vitamin and Mineral Fortification of Wheat Flour and Maize Meal. 2004;(June):1-107.
- Whitfield K. C., Smith T. J., Rohner F., Wieringa F. T., Green T. J. Thiamine Fortification Strategies in Low- and Middle-Income Settings: A Review. Ann N Y Acad Sci. 2021;1498(1):29-45. doi:10.1111/nyas.14565
CrossRef - Florence N. U., Tola A. Vitamin A Stability in Nigerian Wheat Flour and Fortification Compliance Level. African J Food Sci. 2016;10(3):33-40. doi:10.5897/ajfs2015.1385
CrossRef - Tuncil S. A. Investigating Stability in Amorphous Solid Dispersions: A Study of the Physical and Chemical Stability of Two Salt Forms of Thiamine and the Physical Stability of Citric Acid. 2018;(December). https://hammer.figshare.com/articles/thesis/ Investigating_Stability_in_Amorphous_Solid_Dispersions _A_Study_of_the_Physical_and_ Chemical_Stability_of_Two_Salt_Forms_of_Thiamine_ and_the_Physical_Stability_ of_Citric_Acid/7501874/1
- Arioglu-Tuncil S., Voelker A. L., Taylor L. S., Mauer L. J. Amorphization of Thiamine Chloride Hydrochloride: Effects of Physical State and Polymer Type on the Chemical Stability of Thiamine in Solid Dispersions. Int J Mol Sci. 2020;21(16):1-15. doi:10.3390/ijms21165935
CrossRef - Voelker A. L., Taylor L. S., Mauer L. J. Effect of PH and Concentration on the Chemical Stability and Reaction Kinetics of Thiamine Mononitrate and Thiamine Chloride Hydrochloride in Solution. Vol 15.; 2021. doi:10.1186/s13065-021-00773-y
CrossRef - Coad R., Bui L. Military Freeze-Dried Meal During Extended Storage. Foods. 2020;9(39):1-11.
CrossRef - Sheraz M. A., Kazi S. H., Ahmed S., Anwar Z., Ahmad I. Photo, Thermal and Chemical Degradation of Riboflavin. Beilstein J Org Chem. 2014;10:1999-2012. doi:10.3762/bjoc.10.208
CrossRef - Beizadea E. Fortification of Wheat Flour. Rom Biotechnol Lett. 2009;14(2):4300-4306.
- Yusufali R., Sunley N., de Hoop M., Panagides D. Flour Fortification in South Africa: Post-Implementation Survey of Micronutrient Levels at Point of Retail. Food Nutr Bull. 2012;33(4 Suppl). doi:10.1177/15648265120334s308
CrossRef - Suri D. J., Tanumihardjo S. A. Effects of Different Processing Methods on the Micronutrient and Phytochemical Contents of Maize: From A to Z. Compr Rev Food Sci Food Saf. 2016;15(5):912-926. doi:10.1111/1541-4337.12216
CrossRef - Hemery Y. M., Fontan L., Laillou A., et al. Influence of Storage Conditions and Packaging of Fortified Wheat Flour on Microbial Load and Stability of Folate and Vitamin B12. Food Chem X. 2020;5(December 2019):100076. doi:10.1016/j.fochx.2019.100076
CrossRef - Liang L. Folates : Stability and Interaction with Biological Molecules. J Agric Food Res. 2020;2(March):100039. doi:10.1016/j.jafr.2020.100039
CrossRef - Rosenberg I. H., Selhub J. Assessing All the Evidence for Risks and Benefits With Folic Acid Fortification and Supplementation. Elsevier Inc.; 2018. doi:10.1016/b978-0-12-802861-2.00024-9
CrossRef - Bailey L. B., Stover P. J., McNulty H., et al. Biomarkers of Nutrition for Development-Folate Review. J Nutr. 2015;145(7):1636S-1680S. doi:10.3945/jn.114.206599
CrossRef - Scientific Advisory Commitee on Nutrition. Update on Folic Acid. 2017;(July):1-73. https://www.gov.uk/government/uploads/system/uploads/attachment _data/file/637111/SACN_Update_on_folic_acid.pdf
CrossRef - Ribeiro D. O., Pinto D. C., Lima M. T., Volpato N. M., Cabral L. M., De Sousa V. P. Chemical Stability Study of Vitamins Thiamine, Riboflavin, Pyridoxine and Ascorbic Acid in Parenteral Nutrition for Neonatal Use. Nutr J. 2011;10(1):1-9. doi:10.1186/1475-2891-10-47
CrossRef - Yang P., Wang H., Li L., Zhang N., Ma Y. The Stability of Vitamin A from Different Sources in Vitamin Premixes and Vitamin-Trace Mineral Premixes. Appl Sci. 2021;11(8). doi:10.3390/app11083657
CrossRef

This work is licensed under a Creative Commons Attribution 4.0 International License.


