Electrochemical Evaluation of the Organic Matter Content of Edible Sea and Rock Salts Retailed in the Greek Market.
1Department of Chemistry, National and Kapodistrian University of Athens, Athens, Greece, 157 84 2Center for Marine and Environmental Research, Ruđer Bošković Institute, Zagreb, Croatia, 10002, P.O. Box 180.
Corresponding Author Email: harpro@chem.uoa.gr
DOI : http://dx.doi.org/10.12944/CRNFSJ.4.Special-Issue-October.17
Download this article as:
![]()
The release of copper-complexing ligands in 14 sea and 10 rock edible salts retailed in the Greek market has been examined. The concentration of ligands (LT) and the copper-binding strength (logKapp) of salt solutions were determined with Differential Pulse Anodic Stripping Voltammetry (DPASV).
The tested salt samples were found to have Cu complexing ligands, at concentrations ranging from <0.1 to 61.2 nmol g-1. In none of the salt samples examined (except a single one) were LTvalues exceeded by the corresponding total copper concentrations, indicating that Cu is fully complexed.
Aiming to partially characterize the physico-chemical properties of the organic material contained in salts, the surface active substances (SAS) and catalytically active compounds (CAC) were measured, for the first time, in salt solutions by sensitive electrochemical techniques. Higher concentrations of organic carbon and SAS were determined in sea samples compared to rock salts.
KEYWORDS:salts; mineral; marine; copper complexation; SAS; CAC
Introduction
Salt has an important role as a food ingredient and a carrier of nutrients. It is routinely used as a food additive for taste improvement and also as a food preservative. Several hundred million tons of salt are annually produced worldwide, with its origin being either from mines or seawater.
There are three basic types of salt namely table salt, sea salt and rock salt, with numerous variations, in terms of source and chemical composition, classified within these three categories. Refined, industrial grade table salt constitutes of pure sodium chloride, to which an anti-caking agent and in some cases, iodine are added [1, 2]. As long as they are unrefined, mined or rock and sea salts do not contain any additives, although labeling of salt packaging is frequently characterized by uncertainty and obscurity. Unrefined salt is generally not of pure white color such as NaCl, but tends to be off-white or pink, since some sea salts take on unique tints from the clay pans in which they crystallize. Also, hinting colors of salts may be attributed to minerals contained. Unrefined and unprocessed salt varieties have recently become particularly popular to certain groups of consumers, who either consider themselves as health conscious or use unprocessed salts as a gourmet product.
Salts constitute a source of major, minor and trace elements, including metals, with certain health implications [3, 4]. The fraction of metals which can actually be retained by the human body from the consumption of salts is related to their metal content, to the metal fraction usually eluted by water, as well as to the bioavailability of metal species present. The bioaccessibility of metals is affected by their complexation mechanisms, to which the organic matter plays a principal role. The co-consumption of salt may hence reduce the bioaccessibility of toxic metals originating from foodstuffs, where it is added for taste improvement. Despite the fact that several studies consider the determination of trace metals in refined and unrefined salts [5, 6, 7], to the authors’ knowledge, there are no studies available relatively to metal complexation in salts, which presents an emerging interest.
A total of 24 unrefined salts produced (sea salts) or imported (sea, rock salts) in Greece were investigated in the present study, in terms of copper-complexing ligands release. The apparent complexing capacity of Cu (LT) and the apparent conditional stability constant (logKapp) were determined in salt solutions with Differential Pulse Anodic Stripping Voltammetry (DPASV). The organic material of salt samples, in terms of functional groups and type of compounds, was partially physico-chemically characterized, with the application of chronopotentiometric stripping analysis (CSA) [8] and adsorption transfer of chronopotentiometric analysis (AdTCSA) [9], while surface active substances (SAS) were measured by phase selective alternating current voltammetry (PSACV) [10].
Materials and Methods
Salt samples analysed in the present study were purchased from retail shops of Athens during 2015. Out of 24 total samples 14 were of marine origin (9 sea salts, 5 sea salts flower) and 10 of mineral origin (rock salts) (Table 1). Sampling of salts, which according to their labeling contain chemical additives for the improvement of their properties, was avoided. Regarding the Greek sea salts selected, they are exclusively hand harvested according to traditional patterns, usually in small quantities from natural cavities of rocky coastal areas. Regarding the imported Himalayan pink salt, which is the most popular in Greece among rock salts, 7 different samples were examined, due to the great variety of packages in which the specific salt is transported. The Atlantic grey salt is a “moist”, unrefined sea salt, usually found in the Brittany region of the French Atlantic coast. Its natural, light-grey color derives from the minerals absorbed from the clay lining the salt pond.
All analytical determinations carried out were performed in salt solutions, since during their culinary use salts are dissolved and due to the fact that the more ‘labile’ species of the examined parameters are included in the solution. In detail, following drying of salt samples for 24 h at 35oC, 30 g of each one were dissolved in 1 L of deionized water of 18.2 MΩ cm (Millipore, Bedford, MA, USA), in glass containers previously thoroughly cleaned with 1:1 HNO3 (Merck, Darmstadt, Germany) and rinsed with Milli-Q water.
The apparent complexing capacity of Cu (LT), demonstrating the presence of organic ligands and the apparent conditional stability constant (logKapp), indicating the stability of Cu-ligands complexes, were determined in the salt solutions by Differential Pulse Anodic Stripping Voltammetry (DPASV) [11], through linear transformation of titration data assuming 1:1 metal to ligand complexation [12, 13]. The repeatability calculated (n = 5) was lower than 10%. The procedure employed is described in detail elsewhere [14].
The determination of surface active substances (SAS) was carried out by phase selective alternating current voltammetry (PSACV) [10], employing the experimental conditions according to Karavoltsos et al (2014) [14]. The surfactant activity was expressed in equivalents of the non-ionic surface active compound Triton-X-100 (MW = 600). The detection limit of the method was 0.53 μg g-1 and its reproducibility equal to 3%.
The presence in salt solutions of adsorbable organic compounds, carrying catalytically active groups dissociated at pH = 5.1 and pH = 8.2, indicated by catalytic hydrogen evolution peaks at these pH values, was detected by (CSA) [8, 9]. The catalytically active compounds (CAC) at pH 8.2 were measured directly in the salt solutions by CSA. CAC at pH5.1 were measured by accumulation in salt solutions followed by a transfer of electrode to new electrochemical cell containing 0.55M NaCl with 0.5M acetate buffer (pH 5.1), in which stripping was performed and catalytic H peak recorded. Samples were measured directly after their preparation. The concentrations of CAC at pH 5.1 were expressed in mg g-1 of the polysaccharide xanthan (Sigma-Aldrich, Germany) used for the calibration, whereas those of CAC at pH 8.2 in mg g-1 of protein albumin (MW 67 kDa) of the human serum (HSA) (Sigma, USA). For the measurement conditions applied [14] the detection limits for CAC at 5.1 and 8.2 were respectively equal to 0.03 mg g-1 of X an than and 0.09 μg g-1 of HSA.
All electrochemical measurements carried out in the present study were performed by a μAutolab type III (Eco-Chemie, The Netherlands) instrument connected to a three electrode cell (663 VA Stand, Metrohm, Switzerland) with a static mercury drop electrode (SMDE) as the working electrode. The reference electrode was an Ag/AgCl (3 M KCl). A carbon rod electrode served as the auxiliary electrode.
The Cu content of salts was determined through measuring total dissolved Cu concentrations in salt solutions, by Inductively Coupled Plasma Mass Spectrometry (ICP-MS, Thermo Scientific ICAP Qc) (Thermo Fisher Scientific, Waltham, MA, USA), after rapid carbamate extraction of metals from the salt solutions, according to the solvent extraction technique described by Danielsson et al (1982) [15]. The detection limit for Cu was 0.01 ng g-1. The analysis of the certified reference material (CRM) NASS-6 (seawater) yielded a 94% recovery.
Total organic carbon (TOC) was determined by High Temperature Catalytic Oxidation employing a TOC-5000A Shimadzu analyser (Shimadzu Scientific Instruments, Columbia, MD). The precision was estimated as the standard deviation between injections and was less than 2% of the mean.
The t-test was used in order to detect significant differences between average values obtained for samples, whereas principal component analysis (PCA) was used in order to identify sets of variables which are characterized by substantial correlation. These statistical analyses were performed with the software package XLSTAT. A value of p<0.05 (95 % confidence level) was considered to indicate a significant difference (t-test).
Results
The pH values measured in the salt solutions ranged between 4.67 and 9.39 in sea salts, being slightly (p=0.05) lower than those of rock ones, ranging between 5.77 and 9.48. The total organic carbon (TOC) content of sea salts was significantly higher than that of rock ones (p=0.002), respectively varying from 0.02 to 0.37 mg g-1 in sea, 0.08 to 0.45 mg g-1 in sea flower and 0.03 to 0.10 mg g-1 in rock salts.
The LT concentrations determined demonstrate the presence of Cu complexing ligands in salt solutions, at concentrations ranging up to 61.2 nmol g-1 (Table 1). The highest values of LT (nmol g-1) were obtained for samples 24 (61.2), 11 (40.4), 18 (38.7) and 16 (37.0). A great variation in LT values was recorded among the samples examined, without any particular difference (p>0.05) between sea (<0.1 – 40.4 nmol g-1) and rock (0.6 – 61.2 nmol g-1) salts.
The concentrations of total Cu varied between <0.01 and 0.88 nmol g-1 (Table 1). The fact that in none of the salt samples analyzed, excluding sample 13, did total Cu concentrations exceed the corresponding LT ones, demonstrates that Cu contained in salts is fully complexed.
The calculated values of logKapp, which characterize the stability of Cu complexes with organic ligands, varied from 6.1 to 7.7, indicating potentially similar features of ligands originating from different kinds of salts.
Table 1: Concentrations of LT (nmol g-1), Cu (nmol g-1) and TOC (mg g-1) in salts and logKapp
| Type | Origin |
LT (nmol g-1) |
logKapp |
Cu (nmol g-1) |
TOC (mg g-1) |
|
| 1 | sea salt | Greece |
17.2 |
6.6 |
0.10 |
0.17 |
| 2 | sea salt | Greece |
11.5 |
7.5 |
0.43 |
0.06 |
| 3 | sea salt | Greece |
0.5 |
6.4 |
<0.01 |
0.02 |
| 4 | sea salt | Greece |
26.7 |
6.7 |
0.88 |
0.02 |
| 5 | sea salt | Greece |
2.7 |
6.7 |
0.08 |
0.26 |
| 6 | sea salt | Greece |
33.2 |
6.6 |
0.13 |
0.23 |
| 7 | sea salt | Greece |
20.3 |
6.7 |
0.17 |
0.37 |
| 8 | sea salt | Atlantic ocean (grey) |
17.2 |
7.0 |
0.03 |
0.30 |
| 9 | sea salt | Hawai (red salt) |
9.4 |
7.0 |
0.13 |
0.11 |
| 10 | sea salt flower | Greece |
24.0 |
6.8 |
0.22 |
0.45 |
| 11 | sea salt flower | Greece |
40.4 |
6.4 |
0.22 |
0.08 |
| 12 | sea salt flower | Greece |
17.0 |
6.5 |
0.09 |
0.28 |
| 13 | sea salt flower | Cyprus |
<0.1 |
6.3 |
0.17 |
0.11 |
| 14 | sea salt flower | France |
5.1 |
7.7 |
0.23 |
0.37 |
| 15 | rock salt | Himalayan pink salt |
30.4 |
6.6 |
0.08 |
0.08 |
| 16 | rock salt | Himalayan pink salt |
37.0 |
6.6 |
0.07 |
0.05 |
| 17 | rock salt | Himalayan pink salt |
19.6 |
6.8 |
0.08 |
0.06 |
| 18 | rock salt | Himalayan pink salt |
38.7 |
6.3 |
0.30 |
0.07 |
| 19 | rock salt | Himalayan pink salt |
28.7 |
6.6 |
0.36 |
0.10 |
| 20 | rock salt | Himalayan pink salt |
17.2 |
6.6 |
0.14 |
0.04 |
| 21 | rock salt | Himalayan pink salt |
28.3 |
6.3 |
0.03 |
0.05 |
| 22 | rock salt | Persia-Iran (blue salt) |
0.6 |
7.4 |
0.13 |
0.05 |
| 23 | rock salt | Kalahari desert |
20.6 |
6.6 |
0.18 |
0.04 |
| 24 | rock salt | Peru |
61.2 |
6.1 |
0.14 |
0.03 |
The concentrations of surface active substances (SAS) and catalytically active compounds (CAC) at two different pH levels, namely pH 5.1 and 8.2, measured for the first time to our knowledge in samples of edible salts, were determined in an attempt to investigate their organic matter content. The pH values of the measurements are noted, since it has been demonstrated that the proximity of buffer and catalyst dissociation constants constitutes a precondition for the occurrence of catalytic mechanism [16]. In addition, the fact that the catalytic activity is related to S, N, O and P atoms present in the catalytically active functional group of the organic molecule [17], may lead to the consideration that N-containing organic material could be detected at pH 8.2, since the majority of N-containing groups in organic molecules are characterized by dissociation constants lying close to this pH value [8]. Sulphate and/or carboxylic groups present in organic molecules are presumed to dissociate at pH 5.1, provoking H ions catalytic activity. Hence compounds such as polysaccharides containing sulphate and/or carboxylic groups could be catalytically active at pH 5.1, since they were tested as model compounds. However, the presence of other CAC, also dissociating at this pH, could be presumed as well, since not all classes of compounds have been tested so far [8, 9].
Regarding SAS, they were found to range from 1.8 (sample 17) to 9.3 μg g-1 eq. T-X-100 (sample 5) (Table 2), with sea salts (2.1 – 9.3 μg g-1 eq. T-X-100) being characterized by higher (p = 0.003) concentrations compared to rock ones (1.8 – 4.0 μg g-1 eq. T-X-100). Among the samples examined, the highest SAS values were detected in samples 5 (9.3), 14 (7.9), 10 (7.3) and 6 (6.9), all of marine origin.
In many of the salt samples examined the concentrations of CAC at pH 5.1 were lower than 0.03 mg g-1 eq. xanthan (Table 2). Detectable values of CAC at pH 5.1 ranging between 0.07 and 0.16 mg g-1 eq. xanthan were obtained principally for sea salts. Also, except the rock salts 16, 17 and 22, the concentrations of CAC at pH 8.2 in the rest of the salt samples were lower than 0.09 µg g-1 eq. HSA (Table 2), indicating lack of N-containing organic material.
Table 2: Concentrations of CAC at pH 5.1 (mg g-1 eq. xanthan), CAC at pH 8.2 (mg g-1 eq. HSA) and SAS (μg g-1 eq. T-X-100)
|
CAC pH 5.1 (mg g-1 eq. xanthan) |
CAC pH 8.2 (mg g-1 eq. HSA) |
SAS (μg g-1 eq. T-X-100) |
|
| 1 |
– |
– |
3.9 |
| 2 |
– |
– |
2.1 |
| 3 |
0.15 |
– |
3.6 |
| 4 |
0.11 |
– |
4.0 |
| 5 |
0.11 |
– |
9.3 |
| 6 |
0.16 |
– |
6.9 |
| 7 |
0.14 |
– |
5.8 |
| 8 |
0.07 |
– |
6.7 |
| 9 |
– |
– |
4.3 |
| 10 |
0.10 |
– |
7.3 |
| 11 |
– |
– |
2.7 |
| 12 |
– |
– |
4.3 |
| 13 |
– |
– |
2.6 |
| 14 |
0.10 |
– |
7.9 |
| 15 |
– |
– |
4.0 |
| 16 |
– |
4.9 |
2.9 |
| 17 |
– |
1.2 |
1.8 |
| 18 |
0.10 |
– |
2.7 |
| 19 |
– |
– |
3.3 |
| 20 |
– |
– |
3.2 |
| 21 |
– |
– |
2.6 |
| 22 |
– |
0.5 |
2.9 |
| 23 |
0.07 |
– |
2.1 |
| 24 |
0.12 |
– |
3.8 |
Discussion
Since the salt samples examined in the present study differ in terms of their organic matter content and its composition, the values of the various parameters measured should be normalized with reference to their organic matter concentrations in order to make comparisons feasible. The normalization of LT concentrations as for organic carbon content provides information on the amount of Cu ligands per organic carbon mass unit. Hence, the highest LT concentrations normalized as for TOC (nmol Cu / mg C) were calculated for samples 24 (2039) and 4 (1333), while the lowest for samples 13 (0.034) and 5 (10.5), with the difference between sea (mean concentration 187 nmol Cu / mg C) and rock salts (579 nmol Cu / mg C) considered statistically insignificant (p>0.05). The normalized LT concentrations obtained in the present work for salts (0.03 – 2039, mean value 351 nmol Cu / mg C) were higher compared to those recorded for extracellular material of marine macroalgae (11-22 nmol Cu / mg C) [18], herbal infusions (16 – 128 nmol Cu / mg C) [14] and coastal seawater samples (30 – 170 nmol Cu / mg C) [19].
SAS normalized concentrations as for organic carbon content also demonstrated a significant variation, pointing to differences in the surface active material contained in the salt samples. Their normalized values ranged between 0.016 and 0.200, with the highest ones being recorded for samples 4 (0.200), 3 (0.180) and 24 (0.128). Regarding CAC at pH 5.1 their highest normalized values as for organic carbon were obtained for samples 3 (7.7), 4 (5.5) and 24 (4.1). It is noteworthy that in the salt solutions of samples 4 and 24, for which the highest normalized LT concentrations were obtained, the normalized concentrations obtained for SAS and CAC at pH 5.1 were among the highest. Therefore, the contribution to Cu complexing sites of CAC containing catalytic groups may potentially occur.
In order to evaluate the type of SAS contained in the salt samples examined, a correlation was undertaken between SAS and TOC concentrations of salt solutions, to those of different model substances. Organic substances containing different functional groups and hydrophobic properties were selected for this purpose. The straight lines appearing on the graph (Fig. 1) are obtained when the SAS data for different model substances and their different concentrations, such as capric acid (decanoic acid) a saturated fatty acid (line No 1), the microbial polysaccharide xanthan (line No 2), the hydrophobic polysaccharide dextran T-500 (MW 500000) without any functional groups present in its molecule [20, 21] (line No 3), fulvic acid and protein (Albumin) (line No 4) and Triton-X-100 (line No 5) are correlated with their corresponding TOC values. When respective SAS and TOC data obtained for the salt solutions are placed on the graph, they are situated close to and/or between the lines corresponding to the model substances. The closer a point is to the line, the higher the resemblance of the corresponding sample with the relevant model substance [22]. Ćosović (1990) [23] has demonstrated that the molecular mass of adsorbable compounds represents a key factor in the process of adsorption based on the kinetics of that process.
As demonstrated in Fig. 1, most of the sea salts examined demonstrated adsorption features similar to those of capric acid and microbial polysaccharide xanthan, whereas rock salts tend to have an adsorption behavior more similar to xanthan and to polysaccharide dextran T-500. This is reflected to the presence in some samples of CAC at pH 5.1 (Table 2), which are mainly of a polysaccharidic character. However, the organic material present in the majority of the salt samples does not resemble the adsorption behavior of neither the model protein albumin (Fig. 1), as demonstrated also in the absence of CAC at pH 8.2 (Table 2), nor the model substance Triton-X-100. Regarding sample 3 (sea salt from Greece), although not mentioned on its label, appears to be treated, on the basis of its particularly low concentrations of LT, Cu and TOC determined.
 |
Figure 1: Correlation of SAS concentrations eq. to Triton-X-100 (T-X-100) and TOC values in edible salts solutions. Lines correspond to different model substances: No 1 to capric acid, No 2 to microbial polysaccharide xanthan, No 3 to polysaccharide dextran T-500, No 4 tofulvic acid and protein (Albumin) and No 5 to Triton-X-100 Click here to View figure |
In order to gain an overview of the relationships among copper ligands (LT) and the parameters determined, principal components analysis (PCA) was performed for all salt samples examined. Three principal components (PC) were extracted from the statistical analysis (with eigenvalues > 1) which together explain 71% respectively, of the total variance in the data set. The projection of the variables measured in salt samples on the plane defined by Factor 1 (F1) and Factor 2 (F2), is shown in Fig. 2. Two groups are formed, one comprising LT and pH and a second one comprising TOC and SAS, indicating that in each cluster the parameters identified are correlated with each other.
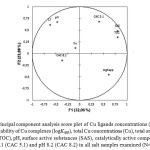 |
Figure 2: Principal component analysis score plot of Cu ligands concentrations (LT), relative stability of Cu complexes (logKapp), total Cu concentrations (Cu), total organic carbon (TOC), pH, surface active substances (SAS), catalytically active compounds at pH 5.1 (CAC 5.1) and pH 8.2 (CAC 8.2) in all salt samples examined (N=24). Click here to View figure |
References
- Haddy F.J. Role of dietary salt in hypertension. Life Sciences; 79: 1585-1592: (2006)
CrossRef - Steinhauser G., Sterba J.H. Poljanc K., Bichler M., Buchtela K. Trace elements in rock salt and their bioavailability estimated from solubility in acid. Journal of Trace Elements in Medicine and Biology; 20: 143-153: (2006)
CrossRef - Eftekhan M.H., Mazloomi S.M., Akbarzadeh M., Ranjbar M. Content of toxic and essential metals in recrystallized and washed table salt in Shiraz, Iran. Environmental Health Sciences and Engineering; 12:10:1-5: (2014)
- Heshmati A., Vahidinia A., Salehi I. Evaluation of heavy metals contamination of unrefined and refined table salt. International Journal of Research Studies in Biosciences; 2 (2): 21-24: (2014)
- Chmilenko F.A., Baklanov A.N. Determination of alkali and alkaline-earth elements in table salt and sodium chloride by sonoluminescence. Journal of Analytical Chemistry; 55: 1152-1154: (2000)
CrossRef - Amorim F.A.C., Ferreira S.L.C. Determination of cadmium and lead in table salt by sequential multi-element flame atomic absorption spectrometry. Talanta; 65: 960-964: (2007)
CrossRef - Soylak M., Peker D.S.K., Turkoglu O. Heavy metal contents of refined and unrefined table salts from Turkey, Egypt and Greece. Environmental Monitoring and Assessment; 143: 267-272: (2008)
CrossRef - Strmečki S., Plavšić M., Ćosović B. Constant current chronopotentiometric stripping analysis of “N-catalyst” in sodium chloride solution and seawater. Electroanalysis; 22(1): 91-98: (2010)
CrossRef - Strmečki S., Plavšić M. Adsorptive transfer chronopotentiometric stripping of sulphated polysaccharides. Electrochemistry Communications; 18: 100-103: (2012)
CrossRef - Ćosović B. Aqueous surface chemistry. Adsorption characteristics of organic solutes. Electrochemical evaluation. In Stumm W. (Ed.), Chemical processes in lakes (pp. 55-80). Wiley, New York (1985)
- Plavšić M., Krznarić D., Branica M. Determination of the apparent copper complexing capacity of seawater by DPASV. Marine Chemistry; 11: 17-30: (1982)
CrossRef - Ružić I. Theoretical aspects of the direct titration of natural waters and its information yield for trace metal speciation. Analytica Chimica Acta; 140: 99-113: (1982)
CrossRef - van den Berg C.M.G. Determination of copper complexation with natural organic ligands in seawater by equilibration with MnO2: II. Experimental procedures and application to surface seawater. Marine Chemistry; 11: 323-342: (1982)
CrossRef - Karavoltsos S., Plavšić M., Kalogeropoulos N., Kogiannou A.A., Strmečki S., Sakellari A., Dassenakis M., Scoullos M. Copper complexing properties and physic-chemical characterization of the organic matter in Greek herbal infusions. Food Chemistry; 160: 53-60: (2014)
CrossRef - Danielsson L.G., Magnusson B., Westerland S., Zhang K. Trace metal determination in estuarine waters by electrothermal AAS after extraction of dithiocarbamate complexes into freon. Analytica Chimica Acta; 144: 183-188: (1982)
CrossRef - Mader P., Vesela V., Dorčak V., Heyrovsky M. The “presodium” hydrogen evolution at the dropping mercury electrode catalysed by simple cysteine peptides. Collection of Czechoslovac Chemical Communications; 66: 397-410: (2001)
CrossRef - Heyrovsky M. Catalytic hydrogen evolution at mercury electrode from solutions of peptides and proteins. In Paleček E., Scheller F., Wang J. (Eds.), Electrochemistry of nucleic acids and proteins. Towards electrochemical sensors for genomics and proteomics (pp. 657-680). Elsevier, Amsterdam (2005)
CrossRef - Karavoltsos S., Sakellari A., Strmečki S., Plavšić M., Ioannou E., Roussis V., Dassenakis M., Scoullos M. Copper complexing properties of exudates and metabolites of macroalgae from the Aegean Sea. Chemosphere; 91: 1590-1595: (2013)
CrossRef - Karavoltsos S., Kalambokis E., Sakellari A., Plavšić M., Dotsika E., Karalis P., Leondiadis L., Dassenakis M., Scoullos M. Organic matter characterization and copper complexing capacity in the sea surface microlayer of coastal areas of the Eastern Mediterranean. Marine Chemistry; 173: 234-243: (2015)
CrossRef - Plavšić M., Ćosović B. Adsorption properties of different polysaccharides on mercury in sodium chloride solutions. Electroanalysis; 12: 895-900: (2000)
CrossRef - Orlović-Leko P., Kozarac Z., Ćosović B. Surface active substances (SAS) and dissolved organic matter (DOC) in atmospheric precipitation of urban area of Croatia (Zagreb). Water, Air and Soil Pollution; 158: 295-310: (2004)
CrossRef - Ćosović B., Vojvodić V. Voltammetric analysis of surface active substances in natural waters. Electroanalysis; 10: 429-434: (1998)
CrossRef - Ćosović B. Adsorption kinetics of the complex mixture of organic solutes at model and natural phase boundaries. In Stumm W. (Ed.), Aquatic chemical kinetics (pp.291-311).Wiley, New York (1990)


Web of Science Coverage
Emerging Sources Citation Index (ESCI)
2024 Journal Impact Factor: 1.1
Scopus Journal Metrics
CiteScore 2025: 2.6
CiteScore Details
Sustainable Nutrition: Food Systems, Nutrient Retention, and Public Health Impact
![]()
This journal is a member of, and subscribes to the principles of, the Committee on Publication Ethics (COPE)


