

Introduction
The prevalence of overweight and obesity in Saudi Arabia has increased rapidly, reaching up to 37% and 41%, respectively.1 This is due to a major shift in dietary intake, decreased physical activity levels and accelerated nutrition transition, thereby increasing nutrition-related health problems and other related diseases.2-4 The traditional healthy diet consisting of dates, milk, vegetables, fruits, fish, and whole wheat grains has been replaced by the Western-style diet, with excess intake of calorie-dense food, high intake of fat and sugar, and low intake of fiber.2-6 Along with changes in dietary habits, unhealthy foods are easily affordable and accessible; additionally, a luxurious lifestyle in which vehicles are extensively used and an increased prevalence of sedentary behaviors have all resulted in high obesity rates, particularly in the Saudi population.5 In addition, obesity is also associated with many chronic diseases, such as hypertension, dyslipidemia, metabolic syndrome, type 2 diabetes, cardiovascular diseases, and cancers.7-10
Dietary intake is a risk factor that contributes to the management or prevention of many health problems.11, 12 Recently, many nutrition-related epidemiological studies have assessed the relationship between dietary patterns rather than just focusing on a single nutrient in relation to disease risks.11, 12 The concept is such that dietary patterns reflect the effect of a combination of foods, nutrient content, and dietary behavior and are more representative of daily dietary intake.2, 3, 11-13 Previous studies have shown that Western dietary intake patterns are linked with an increased risk of obesity, metabolic syndrome, type 2 diabetes and elevated triglyceride levels, whereas prudent dietary patterns are correlated with a lower body mass index (BMI) and a decreased risk of type 2 diabetes, cardiovascular disease and mortality.11, 12, 14-16
To our knowledge, available published studies on dietary patterns in Saudi Arabia are limited.2 Henceforth, the objective of the current study was to study the explore different dietary patterns among the Saudi population and examine the association between dietary patterns and socio-demographic and lifestyle factors. This will be particularly important and helpful for the promotion of effective prevention programs to maintain overall health and well-being in Saudi Arabia.
Methods
Study Design and Participants
A cross-sectional study was conducted on a group of Saudi adults living in Riyadh city in Saudi Arabia between June and December 2013. Participants were recruited from King Abdul-Aziz University Hospital who were the attendants of patients (i.e., accompanying the patient). A total of 299 Saudi men and women aged 35-65 years without any significant health problems were recruited for this study. Pregnant or lactating women and patients on a specific diet were excluded. All participants provided informed consent, and the purpose of the study was explained. The study protocol was approved by the Institutional Review Board (IRB # 13/3757/IRB, project number E-10-152) of the Medical College at King Saud University.
Demographic, Anthropometric and Lifestyle Characteristics
Participants were interviewed individually using a predesigned questionnaire with closed-ended questions that were developed based on the knowledge available in the literature. The questionnaire included socio-demographic information, including age, sex, education level, marital status, income per month, smoking status, and physical activity. It also included information on meal patterns, such as the number of meals consumed in a day, skipping meals, most meals are eaten outside the home, places often visited for food, and the number of fast food or other restaurants visited per month. Participants were subjected to weight and height measurements by a trained nurse in the clinic.
Dietary Intake
A trained nutritionist has assessed the participant’s usual food intake using an adapted and validated food frequency questionnaire (FFQ) over the previous 6 months in the Saudi population.17 Participants were asked to report the frequency and the quantity consumption of each food item using possible responses: 1-7 times per week, 2-3 months, or rarely/never.17 To estimate the food portion size consumed by each participant, food models (Fort Atkinson, WI, USA), household units (e.g., bowls, spoons and cups), and photographic pictures (Nelson, MAFF. UK.) were used by the interviewer. The portion sizes and the frequency of each food item were converted to daily food intake. Daily intakes of food items, energy, macronutrients and micronutrients intake of participants were calculated by multiplying the daily frequency of intake by the nutrient content of the specified portion size using Q-Builder Tinuviel software nutrition analysis program V3.0 software. Misreporting was considered any participants with daily Kcal intake < 800 kcal or > 4200kcal 18.
Dietary Pattern Derivation
The classification of food patterns was described previously. 12, 14, 15 Factor analysis was used to develop different dietary patterns.12, 14, 15, 19 A total of 157 food items of the FFQ questionnaire were gathered into different groups. The food items were grouped based on similarity properties, ingredients and nutrient profiles to reduce the number of variables and improve their distribution.12, 14, 15, 20 Food items having a unique composition (e.g., dates, Arabic coffee and eggs) were classified individually. Fifteen food groups were formed (Table 1), which were included in the factor analyses to identify independent dietary patterns. The method of grouping the foods and labeling the food pattern was described previously.19
Table 1: Food Groups Intake.
| Food Group | Components |
| Dairy products (whole& low Fat) | Labenah – white cheese – proccesedcheese – milk – laban – yogurt – yogurt with cucumber |
| Fresh & Cooked Vegetable | Tomatoes – onion – cucumber -carrot – lettuce – watercress – celery pascal large outer stalk – cabbage – green salad – fatoosh – tabolah – cabbage with carrot – mixed vegetable cooked – pumpkin cooked – squash cooked – okra cooked – peas & carrots cooked – green Beans cooked – cauliflower cooked – Molokhiyah cooked – Spinach cooked – vegetable oven cooked – vegetable with white sauce “bashamel”- Metablbazngan – vegetable soup – ketchup – pickles. |
| Dates | Dates. |
| Fruits | Melon -watermelon – apple – orange – mandarin – banana – grapes – pears – apricot – peach – strawberry – fruit salad – dried fruit – fresh fruit juice. |
| Meat & Poultry | Chicken meats (all types) – Beef meats (all types) – lamb – camel – variety meat & liver – mortadella – frankfurters – kebbah – kamooniah. |
| Seafood | Fried fish – grilled fish – tuna oiled – watered tuna -shrimp. |
| Eggs | Eggs (all types). |
| Cooked legumes | Balilah – homoss – foul (beans) – lentils – falafel – lentils soup. |
| Breakfast cereal, bread & bakery | White bread (mafrood) – Roll white (samoli) – white toast – tamees bread – tames biscuit bread – fateer – shaborah white – brown bread (mafrood) –Roll brown (samoli) – brown toast – Shaborah brown – bran corn flakes – whole bran cereals – Breakfast cereals – special cereals breakfast – pizza – fatayer(labenah,spinach, thyme) – croissants |
| Rice, pasta, potato and other dishes | Rice plain boiled, rice (kabsah, biryani, bokhari, mandy) –pasta plain boiled – pasta with meat –pasta with tomato sauce – pastabashamel /llazania – boiled potatoes peeled – fried potatoes – potatoes with bashamel – corn cooked -koshare – koskosi – mutbaq–sambosa (cheese, meat)- stuffed vegetables – grape leaves stuffed – oat soup – creamed soup chicken or mushroom. |
| Tradition dishes | Gareesh – haress – qursan – mataziz – Mashghotha – areka — saleeq – manto – yagmushaseedahborr – maasoob – Mohala – henini–aseedatamerr- gareesh soup. |
| Fat & Oil | Margarine – butter – cream – vegetable oil – olive oil – olive – mayonnaise – tehinah – peanutbutter – liquid cheese – salad dressing |
| Arabic Coffee | Arabic coffee. |
| Beverages &Drinks | Soft drink – diet soft drink – energy drinks – fruit drink (canned or packed juice) – nescafe or other coffees – coffee mate – tea. |
| Sweets, dessert & Other snacks | Honey – jam -mohallabia or cream caramel -arabic desserts – maamool dates – cinnamon roll – cake – gateau – doughnut – chocolate (any type) – ice-cream (any type) – tea biscuits or digestive – salty biscuits – biscuit with choco or cream – popcorn – crackers (chips) – candy (gum ,lollypop) – nuts |
Statistical Analysis
Statistical Package for the Social Sciences (SPSS) version 21 was used to conduct all statistical analyses. All results are considered statistically significant if p-values are less than 0.05. Continuous variables were expressed as mean ± standard deviation, and categorical variables were expressed as n number and percentages. The t-test was used for continuous variables, and the chi-square test was used for categorical variables. ANOVA was used to compare more than two groups. The partial Pearson correlation coefficient (r) was used to examine the direction of the linear relationship between dietary pattern scores and total energy and nutrient intake. Multiple linear regression analyses were used to assess the association between the factor scores for each of the identified dietary patterns as dependent variables and the socio-demographic and lifestyle characteristics as independent variables. Daily intake (in grams) of food items, energy, and macronutrients intakes were computed using the Q-Builder Software nutrition analysis program (V2.0).
Results
Demographic, Anthropometric and Lifestyle Characteristics
Table 2 represents the socio-demographic and anthropometric data of 299 Saudi adults (114 men (38%) and 185 women (62%). The mean age of this population was 49.6±6.9 years old. No significant difference was found in age between men (48.7±6.9 years) and women (50.1±6.9 years) (p=0.085). A significantly higher percentage of men were university graduates, had monthly incomes of more than 10,000 SR, and were active smokers. The mean BMI for the studied cohort was 30.6 ± 5.72 kg/m2, with 53.5% not involved in any physical activity.
Table 2: Socio-demographic, Anthropometric and Lifestyle Characteristics of the Participants (n= 299)
| Total (n=299) | Men (n=114) | Women (n=185) | P value | |
| Marital status | ||||
| Married | 257 (86.0) | 112 (98.2) | 145 (78.4) | <0.001 |
| Unmarried | 42 (14) | 2 (1.8) | 40 (21.6) | |
| Education level | ||||
| Illiterate | 36 (12.0) | 0 (0.0) | 36 (19.5) | <0.0001 |
| Primary | 58 (19.4) | 10 (8.8) | 48 (25.9) | |
| Secondary | 106 (35.5) | 42 (36.8) | 64 (34.6) | |
| University & above | 99 (33.1) | 62 (54.4) | 37 (20.0) | |
| Income per month (SR) | ||||
| <5000 | 59 (19.7) | 2 (1.7) | 57 (30.8) | <0.001 |
| 5000-10000 | 90 (30.1) | 28 (24.6) | 62 (33.5) | |
| >10000 | 150 (50.2) | 84 (73.7) | 66 (35.7) | |
| Smoking status | ||||
| Yes | 20 (6.7) | 17 (14.9) | 3 (1.6) | <0.001 |
| No | 279 (93.3) | 97 (85.1) | 182 (99.4) | |
| Physical Activity | ||||
| No | 160 (53.5) | 41 (36.0) | 119 (64.3) | <0.001 |
| 1-2 times/week | 60 (20.1) | 28 (24.6) | 32 (17.3) | |
| 3-4 times/week | 30 (10.0) | 17 (14.9) | 13 (7.0) | |
| ≥ 5 times/week | 49 (16.4) | 28 (24.6) | 21(11.4) | |
| No. of meals per day | ||||
| Three meals | 143 (47.83) | 67 (58.8) | 76 (41.1) | 0.016 |
| Two meals | 145 (48.5) | 44 (38.6) | 101 (54.6) | |
| One meal | 11 (3.67) | 3 (2.6) | 8 (4.3) | |
| Skip some meals | ||||
| Yes | 116 (38.8) | 26 (22.8) | 90 (48.7) | <0.001 |
| Sometimes | 132 (44.2) | 67 (58.8) | 65 (35.1) | |
| No | 51 (17.0) | 21 (18.4) | 30 (16.2) | |
| Most meal skipped | ||||
| Breakfast | 104 (41.9) | 29 (31.2) | 75 (48.4) | 0.046 |
| Lunch | 54 (21.8) | 22 (23.6) | 32 (20.6) | |
| Dinner | 90 (36.3) | 42 (45.2) | 48 (31.0) | |
| Meal eaten outside home | ||||
| Breakfast | 17 (9.3) | 15 (17.4) | 2 (2.1) | 0.002 |
| Lunch | 22 (12.0) | 9 (10.5) | 13 (13.4) | |
| Dinner | 144 (78.7) | 62 (72.1) | 82 (84.5) | |
| No. of snacks per day | ||||
| ≤ 1 snack | 181 (60.5) | 80 (70.2) | 101 (54.6) | 0.007 |
| ≥ 2 snacks | 118 (39.5) | 34 (29.8) | 84 (45.4) | |
| BMI | ||||
| < 25 | 41 (13.7) | 19 (16.7) | 22 (11.9) | 0.031 |
| 25-29.99 | 111 (37.1) | 50 (43.8) | 61 (33.0) | |
| ≥ 30 | 147 (49.2) | 45 (39.5) | 102 (55.1) | |
SR, Saudi Riyals, BMI, body mass index
A total of 47.8% of participants reported consuming three daily meals, while 38.8% reported skipping one or more meals, with breakfast being the most frequently skipped meal, particularly among women. In this cohort, 183 (61.2%) had meals in restaurants, with dinner being the most frequently consumed restaurant meal among 78.7% of participants. On average, breakfast was consumed 5.7 ± 1.9 days/week. Meals comprising fast food and restaurant food were consumed 2.3 ± 3.7 times/week, with a higher number of such meals consumed among men (2.9 ± 3.4 times/week) than among women (1.9 ± 3.9 times/week) (p=0.015).
Dietary Patterns
Factor loading analysis demonstrated five dietary patterns with a total variance of 54.9% in dietary intake, as shown in Table 3. The five dietary patterns were classified as follows: the “sweet and starch” pattern, “date and coffee” pattern, “healthy” pattern, “traditional” pattern, and “protein” pattern. The sweet and starch pattern was positively correlated with beverages and drinks, sweets, desserts and other snacks, breakfast cereals, bread, bakery goods, beans, rice, pasta and cooked dishes. The date and coffee pattern was positively correlated with the consumption of dates and coffee. The healthy pattern was positively correlated with foods that were considered healthy, including fruits, vegetables and seafood, while the traditional pattern was positively correlated with traditional Saudi food patterns, including meat and poultry, traditional Saudi dishes, fat, oil and fruits. Finally, the protein pattern was associated with the consumption of eggs and dairy products.
Table 3: Factor Analysis for the Five Dietary Patterns Identified of the Participants (n= 299)
| Dietary Pattern | |||||
| Food groups | Sweet & Starch | Date & Coffee | Healthy | Traditional | Protein |
| Beverages and Drinks | 0.692 | – | – | 0.293 | – |
| Sweets, Dessert and other snacks | 0.644 | – | – | 0.265 | – |
| Breakfast cereal, bread and bakery | 0.608 | 0.225 | 0.205 | -0.265 | 0.230 |
| Cooked legumes | 0.573 | – | – | – | – |
| Rice, Pasta, Potato and other dishes | 0.499 | 0.289 | – | – | -0.277 |
| Dates | – | 0.861 | – | – | – |
| Arabic coffee | – | 0.850 | – | – | – |
| Fresh and Cooked Vegetables | – | – | 0.755 | – | – |
| Fruits | – | – | 0.635 | 0.483 | |
| Seafood | 0.305 | – | 0.579 | – | – |
| Meat and Poultry | – | – | -0.287 | 0.605 | 0.204 |
| Tradition dishes | – | – | – | 0.577 | – |
| Fat and Oil | 0.271 | – | 0.257 | 0.494 | – |
| Eggs | – | – | – | – | 0.799 |
| Dairy products (Whole & low Fat) | – | – | – | 0.228 | 0.601 |
| % variance explained per pattern | 20.68 | 11.60 | 8.21 | 7.66 | 6.74 |
Total variance explained by all of the patterns is 54.89%
For simplicity, value below 0.2 were excluded from the table.
The Relationship between Dietary Patterns and Socio-demographic and Lifestyle Characteristics
The correlation between different dietary patterns with energy- and energy-adjusted nutrient intake is demonstrated in Table 4. The sweet and starch pattern had the strongest significant positive correlation with energy (r=0.520, p<0.01) when compared to other dietary patterns. In addition, cholesterol had a significant negative correlation, while sodium, calcium and iron had significant positive correlations with sweet and starch patterns. In the healthy pattern, higher scores indicate a higher intake of total fiber, folate, carotene, vitamin E, calcium, vitamin B12, iron, sodium and vitamin C and lower cholesterol intake. For the traditional pattern, protein and cholesterol intake had significant positive correlations, while carbohydrate, calcium, iron and folate had significant negative correlations. Furthermore, higher protein pattern scores indicate a higher intake of protein, cholesterol, sodium, calcium, and vitamin D.
Table 4: Correlation of Dietary Pattern and Total Energy and Energy-adjusted Nutrient Intakes in the Participants (n= 299)
| Nutrients | Dietary pattern | ||||
| Sweet & Starch | Date & Coffee | Healthy | Traditional | Protein | |
| Energy (Kcal)1 | 0.520** | 0.264** | 0.163** | 0.158** | 0.143* |
| Protein (g) | 0.011 | -0.022 | – 0.104 | 0.136* | 0.168** |
| Carbohydrate (g) | 0.108 | 0.034 | 0.070 | – 0.134* | -0.083 |
| Fat (g) | – 0.103 | -0.004 | – 0.025 | 0.097 | 0.023 |
| Total fibre (g) | – 0.023 | -0.013 | 0.549** | – 0.054 | 0.048 |
| Cholesterol (mg) | – 0.156** | -0.057 | – 0.146* | 0.144* | 0.443** |
| Sodium (mg) | 0.172** | -0.039 | 0.185** | – 0.095 | 0.199** |
| Calcium (mg) | 0.142* | 0.026 | 0.299** | – 0.235** | 0.252** |
| Iron (mg) | 0.139* | -0.025 | 0.213** | – 0.151** | 0.103 |
| Carotene (μg) | – 0.052 | 0.100 | 0.508** | – 0.049 | 0.027 |
| Vitamin D (μg) | 0.097 | -0.069 | – 0.001 | – 0.044 | 0.387** |
| Vitamin E (mg) | 0.031 | -0.078 | 0.417** | 0.081 | 0.047 |
| Vitamin B12 (μg) | 0.047 | -0.081 | 0.228** | – 0.053 | 0.125* |
| Folate (μg) | – 0.038 | -0.020 | 0.529** | – 0.120* | 0.156** |
| Vitamin C (mg) | – 0.024 | -0.102 | 0.172** | 0.116* | 0.077 |
1Energy were adjusted for age and gender
All nutrients were adjusted for age, gender, and total energy intake
*P < 0.05 and ** P < 0.005 were considered significantly different.
The association of dietary pattern scores with socio-demographic and lifestyle characteristics was examined using multivariate linear regression analyses in Table 5, which revealed that sweet and starch patterns correlate strongest to the male gender, frequent visits to fast-food restaurants and breakfast consumption behavior, followed by being young, highly educated and having less income. The date and coffee pattern had a significant negative correlation with the number of meals and snacks per day. The healthy pattern was found to be associated with male gender, higher education with high income, older adults, breakfast consumption behavior and high level of physical activity. The traditional pattern was significantly associated with married subjects and the male gender, whereas the protein pattern was strongly correlated with younger age and breakfast consumption behavior.
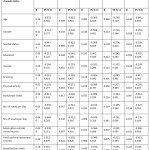 |
Table 5: Relationship between Socio-demographic and Lifestyle Variables and Dietary Pattern (n= 299) |
Discussion
A dietary pattern describes the overall dietary intake (in terms of quantity and variety) of foods and nutrients.21 The objective of the current study was to assess dietary patterns in Saudi adults. In the current study, five dietary patterns were identified: sweet and starch, date and coffee, healthy, traditional, and protein patterns. Adherence to sweet and starch patterns was associated with the male gender, frequent visits to fast-food restaurants and breakfast consumption behavior. Adherence to a healthy pattern was associated with male gender, higher education with high income, older adults, breakfast consumption behavior and high levels of physical activity. The traditional pattern was associated with married subjects and the male gender, whereas the following date and coffee pattern was associated with a reduced number of meals and snacks. The protein pattern was associated with younger age and breakfast consumption behavior.
Limited studies have examined food intake in Saudi Arabia.2, 22, 23 Studies have shown that Saudi food intake is based on white rice, wheat bread, dates and Arabic coffee.22 A national study found that adult Saudis (older than 24 years) had higher intakes of fruit and vegetables than younger ages, and this is more likely linked to fruit consumption.2 In the current study, five dietary patterns were revealed from the analysis, which is consistent with the previously identified number ranging between 3 and 7 patterns.12, 14, 15, 24, 25 Together, these factors explained 54.89% of the variance in dietary intake, with the largest variance interpreted by the sweet and starch pattern (20.68%). The current study reported a similar result to previous studies where the percentage of variance ranged between 27-63%.12, 14, 15
Although the labeling of the dietary patterns was based on the author’s interpretation of factors, the correlation coefficient of dietary pattern scores with energy and energy-adjusted nutrient intake further explored the characteristics of the identified dietary pattern and explained the labeling. The higher dietary pattern score “sweet and starch” pattern reflected a diet that is composed of high amounts of sugar, sweets, and starchy foods and dishes, which could explain its strongest correlation with energy intake. It has been reported that a high variety of foods, particularly added sugar foods (sweets), snacks, condiments, and other carbohydrates, along with a low variety of vegetables, promotes a higher intake of energy, thereby contributing to increasing rates of obesity and diabetes.26 In addition, energy-dense foods and beverages consumed within this pattern could also affect the dietary quality of its consumers by prohibiting them from meeting the required daily nutrient intakes.27 In contrast, the healthy pattern reflected characteristics of healthy dietary intake, as it had the highest correlation with dietary fiber and many vitamin and mineral intakes and had a negative correlation with dietary cholesterol. This was expected, as foods in this healthy pattern are considered to be a good source of soluble fiber and other micronutrients and have been considered protective dietary factors associated with lower cardio-metabolic mortality risk in the Middle East and North Africa region.28, 29 Similarly, the protein pattern that correlated with egg and dairy product consumption was associated with protein, cholesterol, sodium, calcium and vitamin D consumption.
The current study showed a differential relationship between dietary patterns and socio-demographic and lifestyle factors. Our findings revealed that the predominant dietary pattern was a “sweet and starch” pattern among Saudi adults. The strongest correlations with this pattern were male gender, frequent visits to fast-food restaurants followed by being young, being educated and having less income. This observation was in line with previously reported dietary habits among Saudis, wherein fast food consumption behavior and energy-dense foods such as sweets, sugar-sweetened beverages and savory snacks were widespread eating patterns among different age groups, especially young adults.30 The increasing number of franchised fast-food restaurants and attractive Westernized high-calorie snacks found in supermarkets with affordable prices resulted in this major lifestyle change.2 This change in dietary habits observed in Saudi adults had chronic health conditions and a high intake of starches, including starchy vegetables, rice, white bread and baked goods known to have a high glycemic load. Although dates and Arabic coffee are associated with a reduced number of meals and snacks per day, it did not reduce the obesity rate, which could indicate that date consumption in the Saudi culture is significantly high, which may increase the total calorie intake, leading to overweight and obesity.22, 23 This had a negative effect on appetite regulation, energy expenditure and body weight and contributed to the obesity and diabetes epidemic in Saudi adults.31
In this study, the healthy dietary pattern was linked with male gender, higher education with high income, older adults, breakfast consumption behavior and high level of physical activity. These findings are consistent with previous studies, where being older adults and males had healthy lifestyle practices and with higher socioeconomic status measured by education and income appeared to be significantly associated with a healthier dietary pattern.32, 33 This could be explained by the fact that older people with higher education tend to be more health-conscious and aware of the importance of a healthy lifestyle in promoting health and wellbeing.
Despite tremendous changes in the habitual dietary intakes of Saudis, some common traditional practices remain intact, such as the consumption of some traditional dishes and dates.34 The traditional pattern is characterized by Saudi traditional dishes, such as harees, qorsan, marqooq and gerish (Table 1). This study demonstrated that married subjects and males consume more of the Saudi traditional pattern, which could be explained by the fact that Saudi families consume more traditional food than Saudi singles, and males favor the consumption of red meat and other Saudi traditional dishes.35 Furthermore, people who are using traditional Saudi whole grain-based foods are associated with low BMI, which could be explained by the fact that traditional food has lower total calories and contains more dietary fiber than nontraditional foods, thus improving insulin resistance and protecting from many chronic diseases.36
Finally, the protein dietary pattern was significantly associated with a younger age group and breakfast behavior consumption. This is in line with the findings from a similar Lebanese study.12, 14, 15 A positive correlation between higher protein intake and younger age group has been observed and previously reported wherein protein intake decreases with increasing age.37
To our knowledge, the current study is one of the first studies to assess gains in dietary patterns in a sample of Saudi adults using a validated FFQ in the same population, where the FFQ is known to be the most commonly used method to assess usual food intake and a valid tool to identify dietary patterns by factor analysis.17, 38 This study is limited by its cross-sectional design, which does not allow us to further explore causal associations between dietary patterns and socio-demographic and lifestyle variables in Saudi adults. In addition, although the study was recruited the participants randomly, the results of the current study can not be generalized to the Saudi population.
In conclusion, five dietary patterns were identified in a sample of Saudi adults, which are the “sweet and starch” pattern, “date and coffee” pattern, “healthy” pattern, “traditional” pattern, and “protein” pattern. Findings from the current study support the differences in dietary patterns based on the population and these differences are influenced by socio-demographic characteristics (age, gender, marital status, education level, income) and other lifestyle factors (breakfast consumption, number of meals, physical activity). Hence, there is an immediate need for implementing a national cohort study to examine the relationship between dietary patterns and the risk of cardiometabolic dysregulation.
Acknowledgments
We would like to thank Mr. Ahmed Al-sharqawi for his great help in statistical analysis.
Funding Sources
This research was funded by the Deanship of Scientific Research at Princess Nourah bint Abdulrahman University through the Fast-track Research Funding Program.
Conflict of Interest
The author(s) declares no conflict of interest.
References
- Al-Nozha MM, Al-Mazrou YY, Al-Maatouq MA, et al. Obesity in Saudi Arabia. Saudi Med J. May 2005;26(5):824-9.
- Moradi-Lakeh M, El Bcheraoui C, Afshin A, et al. Diet in Saudi Arabia: findings from a nationally representative survey. Public Health Nutr. Apr 2017;20(6):1075-1081. doi:10.1017/S1368980016003141.
CrossRef - Washi SA, Ageib MB. Poor diet quality and food habits are related to impaired nutritional status in 13- to 18-year-old adolescents in Jeddah. Nutr Res. Aug 2010;30(8):527-34. doi:10.1016/j.nutres.2010.07.002.
CrossRef - Mehio Sibai A, Nasreddine L, Mokdad AH, Adra N, Tabet M, Hwalla N. Nutrition transition and cardiovascular disease risk factors in Middle East and North Africa countries: reviewing the evidence. Ann Nutr Metab. 2010;57(3-4):193-203. doi:10.1159/000321527.
CrossRef - Al-Hazzaa HM, Abahussain NA, Al-Sobayel HI, Qahwaji DM, Musaiger AO. Physical activity, sedentary behaviors and dietary habits among Saudi adolescents relative to age, gender and region. Int J Behav Nutr Phys Act. Dec 2011;8:140. doi:10.1186/1479-5868-8-140.
CrossRef - Lock K, Pomerleau J, Causer L, Altmann DR, McKee M. The global burden of disease attributable to low consumption of fruit and vegetables: implications for the global strategy on diet. Bull World Health Organ. Feb 2005;83(2):100-8. doi:/S0042-96862005000200010.
- Al-Nozha M, Al-Khadra A, Arafah MR, et al. Metabolic syndrome in Saudi Arabia. Saudi Med J. Dec 2005;26(12):1918-25.
- Patell R, Dosi R, Joshi H, Sheth S, Shah P, Jasdanwala S. Non-Alcoholic Fatty Liver Disease (NAFLD) in Obesity. J Clin Diagn Res. Jan 2014;8(1):62-6. doi:10.7860/JCDR/2014/6691.3953.
CrossRef - Sundararajan K, Campbell MK, Choi YH, Sarma S. The relationship between diet quality and adult obesity: evidence from Canada. J Am Coll Nutr. 2014;33(1):1-17. doi:10.1080/07315724.2013.848157.
CrossRef - De Pergola G, Nitti A, Bartolomeo N, et al. Possible role of hyperinsulinemia and insulin resistance in lower vitamin d levels in overweight and obese patients. BioMed research international. 2013;2013:921348. doi:10.1155/2013/921348; 10.1155/2013/921348.
CrossRef - Al Thani M, Al Thani AA, Al-Chetachi W, et al. A ‘High Risk’ Lifestyle Pattern Is Associated with Metabolic Syndrome among Qatari Women of Reproductive Age: A Cross-Sectional National Study. Int J Mol Sci. Jun 2016;17(6)doi:10.3390/ijms17060698.
CrossRef - Naja F, Hwalla N, Itani L, et al. Dietary patterns and odds of Type 2 diabetes in Beirut, Lebanon: a case-control study. Nutr Metab (Lond). Dec 2012;9(1):111. doi:10.1186/1743-7075-9-111.
CrossRef - Al-Rethaiaa AS, Fahmy AE, Al-Shwaiyat NM. Obesity and eating habits among college students in Saudi Arabia: a cross-sectional study. Nutr J. Sep 2010;9:39. doi:10.1186/1475-2891-9-39.
CrossRef - Naja F, Nasreddine L, Itani L, et al. Dietary patterns and their association with obesity and sociodemographic factors in a national sample of Lebanese adults. Public Health Nutr. Sep 2011;14(9):1570-8. doi:10.1017/S136898001100070X.
CrossRef - Naja F, Nasreddine L, Itani L, Adra N, Sibai AM, Hwalla N. Association between dietary patterns and the risk of metabolic syndrome among Lebanese adults. Eur J Nutr. Feb 2013;52(1):97-105. doi:10.1007/s00394-011-0291-3.
CrossRef - McEvoy CT, Cardwell CR, Woodside JV, Young IS, Hunter SJ, McKinley MC. A posteriori dietary patterns are related to the risk of type 2 diabetes: findings from a systematic review and meta-analysis. J Acad Nutr Diet. Nov 2014;114(11):1759-75.e4. doi:10.1016/j.jand.2014.05.001.
CrossRef - Bawazeer N. Vitamin B12 and folate status during pregnancy among Saudi population. University of Warwick.; 2011. http://wrap.warwick.ac.uk/49940/1/WRAP_THESIS_Bawazeer_2011.pdf.
- Azadbakht L, Mirmiran P, Hosseini F, Azizi F. Diet quality status of most Tehranian adults needs improvement. Asia Pac J Clin Nutr. 2005;14(2):163-8.
- Safdar NF, Bertone-Johnson E, Cordeiro L, Jafar TH, Cohen NL. Dietary patterns of Pakistani adults and their associations with sociodemographic, anthropometric and life-style factors. J Nutr Sci. 2013;2:e42. doi:10.1017/jns.2013.37.
CrossRef - Michels KB, Schulze MB. Can dietary patterns help us detect diet-disease associations? Nutr Res Rev. Dec 2005;18(2):241-8. doi:10.1079/NRR2005107.
CrossRef - Hu FB. Dietary pattern analysis: a new direction in nutritional epidemiology. Curr Opin Lipidol. Feb 2002;13(1):3-9. doi:10.1097/00041433-200202000-00002.
CrossRef - Al-Assaf AH, Al-Numair KS. Body Mass Index and Dietary Intake of Saudi Adult Males in the Riyadh Region-Saudi Arabia. Body Mass Index and Dietary Intake of Saudi Adult Males in the Riyadh Region-Saudi Arabia. 2007;6(5):414-418.
CrossRef - Adam A, Osama S, Muhammad KI. Nutrition and Food Consumption Patterns in the Kingdom of Saudi Arabia. Pakistan Journal of Nutrition. 2014;13(4):181-190.
CrossRef - Park SY, Murphy SP, Wilkens LR, et al. Dietary patterns using the Food Guide Pyramid groups are associated with sociodemographic and lifestyle factors: the multiethnic cohort study. J Nutr. Apr 2005;135(4):843-9. doi:10.1093/jn/135.4.843.
CrossRef - Kesse-Guyot E, Bertrais S, Péneau S, et al. Dietary patterns and their sociodemographic and behavioural correlates in French middle-aged adults from the SU.VI.MAX cohort. Eur J Clin Nutr. Apr 2009;63(4):521-8. doi:10.1038/sj.ejcn.1602978.
CrossRef - Ledikwe JH, Blanck HM, Kettel Khan L, et al. Dietary energy density is associated with energy intake and weight status in US adults. Am J Clin Nutr. Jun 2006;83(6):1362-8. doi:10.1093/ajcn/83.6.1362.
CrossRef - Jomaa L, Hwalla N, Itani L, Chamieh MC, Mehio-Sibai A, Naja F. A Lebanese dietary pattern promotes better diet quality among older adults: findings from a national cross-sectional study. BMC Geriatr. Apr 2016;16:85. doi:10.1186/s12877-016-0258-6.
CrossRef - Afshin A, Micha R, Khatibzadeh S, et al. The impact of dietary habits and metabolic risk factors on cardiovascular and diabetes mortality in countries of the Middle East and North Africa in 2010: a comparative risk assessment analysis. BMJ Open. May 2015;5(5):e006385. doi:10.1136/bmjopen-2014-006385.
CrossRef - Slavin JL, Lloyd B. Health benefits of fruits and vegetables. Adv Nutr. Jul 2012;3(4):506-16. doi:10.3945/an.112.002154.
CrossRef - ALFaris NA, Al-Tamimi JZ, Al-Jobair MO, Al-Shwaiyat NM. Trends of fast food consumption among adolescent and young adult Saudi girls living in Riyadh. Food Nutr Res. 2015;59:26488. doi:10.3402/fnr.v59.26488.
CrossRef - Aller EE, Abete I, Astrup A, Martinez JA, van Baak MA. Starches, sugars and obesity. Nutrients. 03 2011;3(3):341-69. doi:10.3390/nu3030341.
CrossRef - Midhet F, Al Mohaimeed AR, Sharaf F. Dietary practices, physical activity and health education in qassim region of saudi arabia. Int J Health Sci (Qassim). Jan 2010;4(1):3-10.
- Mullie P, Clarys P, Hulens M, Vansant G. Dietary patterns and socioeconomic position. Eur J Clin Nutr. Mar 2010;64(3):231-8. doi:10.1038/ejcn.2009.145.
CrossRef - Al-Mssallem M. The association between the glycemic index of some traditional saudi foods and the prevalence of diabetes in Saudi Arabia: review article. . J diabetes Metabolism. 2014;5:542.
CrossRef - Kerver JM, Yang EJ, Bianchi L, Song WO. Dietary patterns associated with risk factors for cardiovascular disease in healthy US adults. Am J Clin Nutr. Dec 2003;78(6):1103-10. doi:10.1093/ajcn/78.6.1103.
CrossRef - Esmaillzadeh A, Azadbakht L. Major dietary patterns in relation to general obesity and central adiposity among Iranian women. J Nutr. Feb 2008;138(2):358-63. doi:10.1093/jn/138.2.358.
CrossRef - Wakimoto P, Block G. Dietary intake, dietary patterns, and changes with age: an epidemiological perspective. J Gerontol A Biol Sci Med Sci. Oct 2001;56 Spec No 2:65-80. doi:10.1093/gerona/56.suppl_2.65.
CrossRef - Hu FB, Rimm E, Smith-Warner SA, et al. Reproducibility and validity of dietary patterns assessed with a food-frequency questionnaire. Am J Clin Nutr. Feb 1999;69(2):243-9. doi:10.1093/ajcn/69.2.243.
CrossRef

This work is licensed under a Creative Commons Attribution 4.0 International License.