Rapid High-Performance Liquide Chromatographic Method for Quantitative Determination of Caffeine in Different Soft and Energy Drinks Available in Bangladesh
Juthi Mirza1
, Md. Esrafil1, Shamoli Akter1*, Md. Jahangir Alam1, Md. Shahinul Haque Khan2 and Md. Abu Zubair1 1Department of Food Technology and Nutritional Science, Mawlana Bhashani Science and Technology University, Santosh, Tangail, Bangladesh.
2Department of Chemistry, Bangladesh University of Health Science, Dhaka, Bangladesh.
Corresponding Author Email: shamoli07@gmail.com
DOI : http://dx.doi.org/10.12944/CRNFSJ.9.3.33
Download this article as:
![]()
Caffeine is one of the commonly used food additives, which has unique flavor characteristics and bitter taste and used in soft drinks as flavor enhancer. An experimental study was designed to determine the concentration of caffeine in different brands of soft drinks and energy drinks available in Bangladesh by using HPLC. For chromatographic analysis, A Luna 5 C18 (2) 100A column (250×4.6 mm) was used at 37°C temperature at the wavelength of 272nm. Chromatographic separation was determined using buffer of sodium acetate and acetic acid with acetonitrile at a ratio of 80:20 (pH=4.0; flow rate of 1.0 ml/min). The results of this study showed that caffeine content in soft drinks ranged from 19.63 to 101.73 mg/100ml and highest concentration of caffeine found in brand 3 samples while lowest concentration found in brand 2 samples. Significantly higher concentration of caffeine (p less than 0.05) found in six soft drinks sample when compared to BSTI and FDA reference value except brand 2 sample (p greater than 0.05). Quantification of caffeine in different brands of energy drink sample revealed that, four brand sample contained caffeine; among them brand 3 sample showed the highest levels of caffeine 295.86 mg/100ml and lowest amount found in brand 1 sample (101.74 mg/100ml). Concentration of Caffeine in soft and energy drinks exceeded the national and international standard recommended range hence this proposed HPLC method can be used for routine determination and control of caffeine content in different drinks.
KEYWORDS:Caffeine; Energy Drinks; Flavor; Food Additive; HPLC; Soft Drinks
Introduction
Caffeine (1,3,7-trimethylxanthine) is an alkaloid naturally present in the seeds, leaves and fruits of cocoa, coffee and tea and more than sixty other natural plants.1,2 The availability in different plants gave caffeine and caffeine-containing products a long-standing popularity all over the world.3,4 Besides, natural occurrence, caffeine is the most widely consumed legal psychostimulants nowadays and is present in many and diverse kinds of foods and beverages.5,6 Pure caffeine is white crystalline powder, odorless and bitter in taste.7 Caffeine exhibits a number of biological effects, feeling of heightened alertness, decrease fatigue, boost of energy, enhance motor performance diuretic and stimulant properties at low dose level but may be swapped to common psychological problem with high dose level.8 Excessive caffeine intake by those with psychological problems may exaggerate symptoms like insomnia, headaches, irritability and nervousness.9 Regular high doses of caffeine consumption are associated with cardiovascular disease, reduce cerebral blood flow, nervous system disorders, poor liver function10 and stimulates gastric secretion11 as well as produce toxic effect in combination with narcotics, alcohol and some other drugs.12 Researchers found a significant correlation between high intake of caffeine and the risk of miscarriage and also observe irritability and wakefulness in a breast- fed baby during lactation.13 Availability and chemical nature of caffeine made it ideal ingredient for soft drinks and beverage.14 Caffeine has a unique taste and added to soft drinks as a flavoring agent to enhance the overall quality of soft drinks. Although caffeine is used as a flavor enhancer but the health safety issue to the consumer should are now the prime concerns. The Food and Drug Administration (FDA) specify the maximum limit for safe uses in carbonated beverages is 0.02% means 71mg of caffeine in 355 mL soft drinks.15 Caffeine are using in different product and extensively in beverage at developing country like Bangladesh without following any rules and regulation. Hence, it is important to develop an appropriate analytical method to separate and determine concentration levels of caffeine in soft and energy drinks for quality assurance purposes as well as consumer protection. Therefore, the aim in this study is to optimize, validate sample preparation procedures, identification and quantification of caffeine from different brands of soft and energy drinks brands available from the local market in Bangladesh by applying HPLC technique.
Material and Methods
Chemicals and Reagents
Sodium acetate (97%), HPLC grade acetonitrile, Glacial acetic acid and commercial standards of anhydrous caffeine were procured from Sigma Chemical Co. (Darmstadt, Germany). Deionized water (18.2 MW) was obtained from a Barnstead Nano pure water purification system (Barnstead, USA).
Sample Collection
A total of 90 (ninety) samples from ten brands of soft drinks and 54 samples from six brands of energy drinks were purchased from Bangladeshi market after getting verbal consent from shopkeepers. The expiry dates of all collected samples were within the study period.
Instrumentation and Operating Condition
The HPLC (Shimadzu) analysis operate with isocratic pump (10Avp), column, UV-Vis detector, degasser, oven and a LC Workstation Class-VP were used for data acquisition. A Luna 5 μ C18 (2) 100Å column (250×4.6 mm) at 37°C was used for the separation process. About 20μl sample was injected into the injector. The caffeine analysis was done using buffer of sodium acetate and acetic acid with acetonitrile at a ratio of 80:20 (pH=4.0; flow rate of 1.0 ml/min). The chromatograms were detected at the wavelength of 272 nm.16
Mobile Phase Preparation
The mobile phase prepared with buffer (80%) and acetonitrile (20) following slightly modified method of Pylypiw and Grether17. About 1 g of sodium acetate and 1 ml of glacial acetic acid mixed with 50 ml de-ionized water in a 1 L volumetric flask with proper shake and then added deionized water to make 1000 ml. After that 800 ml of the prepared acetate buffer were mixed with 200 ml of acetonitrile in another volumetric flask. The mixture was then filtered with a nylon-66 (pore size 0.2 μm) filter membrane.
Preparation of Standard Solution
About 50 mg of anhydrous caffeine and 20 ml 50% aqueous acetonitrile were taken in a 50 ml volumetric flask and shaking well and then added 50% aqueous acetonitrile up to 50 ml mark. The prepare solution was then filtered with a syringe filter and labeled as standard stock solution-1 (Concentration 1.0 mg/ml). Then 1ml of stock solution-1 was taken in 50ml volumetric flask and mobile phase were added up to mark and labeled as standard stock solution-2 (Concentration 20µg/ml). Similarly standard solutions 1.7, 3.12, 6.25, 12.5 and 25.0 µg/ml were also prepared by dilution of aliquots and filtered through sample filters (pore size 0.2 μm) prior to inject into the column.
Preparation of Sample Solution
Approximately 1ml of sample (soft drinks or energy drinks) was taken in 50 ml volumetric flask and 25% acetonitrile and 75% water were added up to the 50ml mark. After a proper mixing, 5ml of the sample solution was filtered with sample filter (pore size 0.2µm) and 20 µl was injected onto the HPLC column.
Caffeine Identification and Quantification
The wavelength of the stock caffeine was analyzed using UV-spectrophotometer at 272 nm. The retention time was set 4.62±0.2 minutes by running standard several times. To plot calibration curve, 20 μl of each standard solution (1.7, 3.12, 6.25, 12.5 and 25 µg/ml) were injected. Then peak area (y) was then plotted against the concentration (µg/ml) of the caffeine (x). Least square linear regression analysis was done to calculate the slope, correlation coefficients and y-intercept of the standards plots. Limit of quantification (LOQ) and Limit of detection (LOQ) were determined by considering 10 and 3 time signal to noise ratios respectively estimated by the regression lines mention in the previous report.18 The correlation coefficient for standard curve was 0.9995.
Recovery Studies
Recovery studies were also carried out to verify the precision and accuracy by spiking some samples (2.0mg/l, 4.0 mg/l, and 6.0mg/l) from a known standard. About 2.0 ml of 25.0 mg/L standard were mixed with 2.0 ml of sample to make the concentration 12.5 mg/L and injected. To obtain the percentage of recoveries, observed concentrations were divided by known concentration and then multiply by 100. The spiked samples were measured in three replicates.
Statistical Analysis
All the sample analyses were performed in triplicate and descriptive statistics were analyzed by using SPSS software package version 16.0 (SPSS Inc., Chicago, IL, USA) for all variables. The significance of the differences between the means of the two groups was determined by independent sample Student’s t-test. Differences were considered to be significant at p< 0.05.
Results and Discussion
Analysis of Chromatogram
Caffeine is used as a flavor enhancer in soft drinks due to its unique taste which helps to enhance the overall quality of soft drinks. But there are standard limit to use caffeine in soft drinks and other beverages products. This is the major concern to check whether the right amount is used or not. In this study Caffeine in different brands of soft and energy drinks was analyzed using HPLC. The optimum flow-rate of eluent was set at 1.0 ml/min to identify caffeine standard and fixed the rate for all determinations. The overlaid UV spectrum showed good response at 272 nm for the caffeine. In optimized conditions, caffeine was separated with a resolution of more than 4 and the retention time was found to be 4.648 minutes (Figure 1). The calibration curve for caffeine was plotted on the basis of peak areas of chromatograms and a very good linearity was found as presented in figure with an excellent regression factor (0.9998). Linear regression line was obtained y=6820.6x-966.35 (Figure 3).
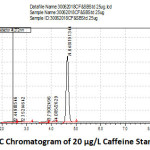 |
Figure 1: HPLC Chromatogram of 20 µg/L Caffeine Standard Solution. |
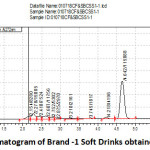 |
Figure 2: Chromatogram of Brand -1 Soft Drinks obtained from Shop-1. |
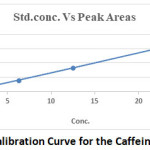 |
Figure 3: Calibration Curve for the Caffeine Standard. |
Table 1: Analytical Characteristics of HPLC Method.
| Parameter | Value |
| Accuracy | 101.39±4.61 |
| Slope | 6820.6 |
| Intercept | 966.35 |
| Linearity range | 1.8µg/ml to 25.08µg/ml |
| Correlation coefficient | 0.9998 |
| SE of intercept | 0.324 |
| SD of intercept | 0.0000475 |
| LOD | 0.00015mg/100ml |
| LOQ | 0.00047mg/100ml |
Table 1 revealed the analytical characteristics of HPLC method. A linear relationship was observed between the concentration of caffeine and the peak area in HPLC at 272 nm. The correlation coefficient for standard curve was 0.9998. Standard error of intercept and standard deviation of the intercept was obtained from the Microsoft Excel function as 0.324 and 0.0000475 respectfully. The quantification limit (LOQ) and detection limit (LOD) were calculated using ICH19 method and found 0.000471mg/100ml and 0.00015mg/100ml respectively.
Analysis of Caffeine in Soft Drinks Sample
After HPLC analysis majority of the soft drinks (six out of ten) contained caffeine at different level. No peak in the chromatogram of the sample brand 7, 8, 9 and 10 was matched to the peak of caffeine standard. The concentration of caffeine in soft drink samples ranged from 19.63 mg/100ml to 101.73 mg/100ml (Table 2). Highest concentration of caffeine found in brand 3 sample whereas lowest concentration of caffeine found in brand 2 sample. The mean concentration of caffeine found 75.17 mg/100ml which was higher than the mean concentrations 40.01 mg/L recorded by Hillary et al.,20 in Coca-Cola drinks and 9.79 –14.38 mg/100 mL found by Nour, Trandafir and Ionică21.
Table 2: Concentration of Caffeine different Brand of Soft Drinks.
| Sample | Concentration of Caffeine (mg/100ml) | Mean±SD (mg/100ml) |
|||
| Shop | Sample 1 | Sample 2 | Sample 3 | ||
| Brand 1 | 1 | 93.20 | 89.54 | 86.72 | 87.35±3.25 |
| 2 | 91.27 | 86.64 | 88.62 | 88.84±2.32 | |
| 3 | 77.26 | 88.55 | 84.38 | 83.40±5.71 | |
| Brand 2 | 1 | 18.65 | 21.23 | 20.64 | 20.17±1.35 |
| 2 | 20.82 | 21.56 | 21.47 | 21.28±0.40 | |
| 3 | 21.55 | 18.09 | 19.26 | 19.63±1.76 | |
| Brand 3 | 1 | 101.58 | 101.80 | 101.81 | 101.73±0.13 |
| 2 | 99.77 | 95.89 | 98.19 | 97.95±1.95 | |
| 3 | 101.27 | 100.46 | 101.67 | 101.14±0.61 | |
| Brand 4 | 1 | 70.95 | 70.29 | 71.05 | 70.76±0.41 |
| 2 | 68.28 | 66.26 | 68.60 | 67.72±1.27 | |
| 3 | 66.59 | 64.80 | 72.20 | 67.86±3.86 | |
| Brand 5 | 1 | 98.41 | 90.65 | 99.70 | 96.25±4.89 |
| 2 | 97.40 | 91.69 | 82.59 | 90.56±7.47 | |
| 3 | 95.10 | 92.93 | 88.35 | 92.13±3.45 | |
| Brand 6 | 1 | 79.85 | 78.64 | 76.25 | 78.25±1.83 |
| 2 | 81.74 | 82.54 | 80.36 | 81.55±1.10 | |
| 3 | 83.34 | 83.89 | 84.80 | 84.01±0.74 | |
| Brand 7 | 1 | Nd | Nd | Nd | Nd |
| 2 | Nd | Nd | Nd | Nd | |
| 3 | Nd | Nd | Nd | Nd | |
| Brand 8 | 1 | Nd | Nd | Nd | Nd |
| 2 | Nd | Nd | Nd | Nd | |
| 3 | Nd | Nd | Nd | Nd | |
| Brand 9 | 1 | Nd | Nd | Nd | Nd |
| 2 | Nd | Nd | Nd | Nd | |
| 3 | Nd | Nd | Nd | Nd | |
| Brand 10 | 1 | Nd | Nd | Nd | Nd |
| 2 | Nd | Nd | Nd | Nd | |
| 3 | Nd | Nd | Nd | Nd | |
Nd= not detected; Data are expressed as Mean ± Standard Deviation
According to the US FDA and BSTI, the acceptable range for caffeine in soft drinks is 20mg and 14.5mg/100ml respectively.15 Brand-3 soft drinks contained almost five times higher caffeine than the standard limit set by FDA and BSTI (Table 3). There was a significantly higher concentration of caffeine (p<0.05) found in six soft drinks sample when compared to BSTI and FDA reference value except brand 2 sample which is not statistically significant (p>0.05).
Table 3: Concentration of Caffeine different Brand of Soft Drinks.
| Sample | Concentration of caffeine (mg/100ml) | Mean±SD (mg/100ml) |
BSTI (mg/100ml) |
FDA (mg/100ml) |
p-value | ||
| Sample 1 | Sample 2 | Sample 3 | |||||
| Brand 1 | 89.82 | 88.84 | 83.39 | 87.35±3.46 | 14.5 | 20 | Pa=0.000; Pb=0.000 |
| Brand 2 | 20.17 | 21.28 | 19.63 | 20.36±0.84 | Pa=0.000; Pb=0.500 | ||
| Brand 3 | 101.73 | 97.95 | 101.13 | 100.27±2.03 | Pa=0.000; Pb=0.000 | ||
| Brand 4 | 70.76 | 67.71 | 67.86 | 68.77±1.71 | Pa=0.000; Pb=0.000 | ||
| Brand 5 | 96.25 | 90.56 | 92.13 | 92.98±2.94 | Pa=0.000; Pb=0.000 | ||
| Brand 6 | 78.25 | 81.55 | 84.01 | 81.27±2.89 | Pa=0.000; Pb=0.000 | ||
| Brand 7 | Nd | Nd | Nd | Nd | |||
| Brand 8 | Nd | Nd | Nd | Nd | |||
| Brand 9 | Nd | Nd | Nd | Nd | |||
| Brand10 | Nd | Nd | Nd | Nd | |||
Nd= not detected; Data are expressed as Mean ± Standard Deviation; Pa value compared with BSTI; Pb value compared with FDA.
Determination of Caffeine in Energy Drinks Sample
Table 4 showed the concentration of caffeine (mg/100ml) in energy drinks sample. Identification of caffeine reveled that most of the branded sample contained caffeine higher that the recommended valued of BSTI and FDA. Highest concentration of caffeine found in brand 3 energy drink sample whereas lowest concentration of caffeine found in brand 1 sample while in brand 5 and brand 6 samples no concentration of caffeine was detected (Table 25). Brand-3 energy drinks sample recorded the highest concentration of caffeine, which is 295.86 mg/100ml followed by brand-4 and brand 2 which is 112 mg and 108.22 mg/100ml respectively. The caffeine concentration of the energy drink samples ranged from 101.74 mg/100ml to 295.86 mg/100ml which was below the concentration (969-3079 mg/100 ml) recorded by Nevena Grujic-Letic et al;22 and higher the concentration (39.48 mg/100mL) found by Nour, Trandafir and Ionică 21.
Table 4: Concentration of Caffeine different Brand of Energy Drinks.
| Sample | Concentration of Caffeine (mg/100ml) | Mean±SD (mg/100ml) |
|||
| Shop | Sample 1 | Sample 2 | Sample 3 | ||
| Brand 1 | 1 | 96.93 | 98.75 | 97.64 | 97.77±0.92 |
| 2 | 95.59 | 100.45 | 98.82 | 98.28±2.48 | |
| 3 | 108.96 | 107.83 | 110.74 | 109.18±1.47 | |
| Brand 2 | 1 | 105.48 | 106.98 | 110.21 | 107.56±2.42 |
| 2 | 102.66 | 101.58 | 99.75 | 101.33±1.47 | |
| 3 | 119.20 | 113.10 | 115.05 | 115.78±3.12 | |
| Brand 3 | 1 | 296.48 | 301.07 | 305.72 | 301.09±2.62 |
| 2 | 292.85 | 286.45 | 291.09 | 290.13±3.30 | |
| 3 | 300.94 | 295.19 | 293.01 | 296.38±4.10 | |
| Brand 4 | 1 | 109.07 | 111.97 | 110.82 | 110.62±1.46 |
| 2 | 111.57 | 112.00 | 110.64 | 111.40±0.70 | |
| 3 | 115.24 | 114.33 | 112.40 | 113.99±1.45 | |
| Brand 5 | 1 | Nd | Nd | Nd | Nd |
| 2 | Nd | Nd | Nd | Nd | |
| 3 | Nd | Nd | Nd | Nd | |
| Brand 6 | 1 | Nd | Nd | Nd | Nd |
| 2 | Nd | Nd | Nd | Nd | |
| 3 | Nd | Nd | Nd | Nd | |
Nd= not detected; Data are expressed as Mean ± Standard Deviation
Recommended value for caffeine in energy drinks according to FDA and BSTI is 20mg and 14.5mg/100ml respectively. Identification of caffeine in different brand energy drink sample reveled that, there was a significantly higher concentration of caffeine (p<0.05) found in four brand sample when compared to BSTI and FDA reference value. There was no caffeine was detected in other two brand sample (Table 5).
Table 5: Concentration of Caffeine different Brand of Energy Drinks.
| Sample | Concentration of Caffeine (mg/100ml) | Mean±SD (mg/100ml) |
FDA (mg/100ml) |
BSTI (mg/100ml) |
p-value | ||
| Sample 1 | Sample 2 | Sample 3 | |||||
| Brand 1 | 97.77 | 98.28 | 109.18 | 101.74±4.44 | 20 | 14.5 | Pa=0.000; Pb=0.000 |
| Brand 2 | 107.55 | 101.32 | 115.78 | 108.22±3.25 | Pa=0.000; Pb=0.000 | ||
| Brand 3 | 301.08 | 290.12 | 296.37 | 295.86±2.50 | Pa=0.000; Pb=0.000 | ||
| Brand 4 | 110.62 | 111.40 | 113.98 | 112.00±1.76 | Pa=0.000; Pb=0.000 | ||
| Brand 5 | Nd | Nd | Nd | Nd | |||
| Brand 6 | Nd | Nd | Nd | Nd | |||
Nd= not detected; Data are expressed as Mean ± Standard Deviation; Pa value compared with BSTI; Pb value compared with FDA.
Recovery Studies
The known amount of caffeine was added to Brand-1 soft drinks at three different levels of concentration considered as: low (2.0μg/ml), medium (4.0 μg/ml) and high (8.0μg/ml). Percentage of recovery of three concentrations was 97.08±1.18, 96.35±1.48 and 95.41±0.92.
Table 6: % Recovery of Caffeine from Spiked Sample.
| Sample | Concentration before Spike (mg/100ml) |
Spiked Level (µg/ml) |
% Recovery (Mean ± SD) |
| Brand-1 | 93.20 | 2.0 | 97.08±1.18 |
| 89.54 | 4.0 | 96.35±1.48 | |
| 86.72 | 6.0 | 95.41±0.92 |
Conclusion
The outcome of the present study revealed that, some brands of soft (six out of ten) and energy drinks (four out of six) contained caffeine exceed the permitted range that is set by international body FDA and national authority BSTI. So government authorized agency such as BSTI should take control and regular monitoring to check the level of caffeine in all brands of soft and energy drinks.
Acknowledgment
The authors would like to offer special gratitude and thanks to the Department of Food Technology and Nutritional Science, Mawlana Bhashani Science and Technology University, Santosh, Tangail-1902, Bangladesh for providing the laboratory facilities to complete this study present study.
Funding Source
The authors are highly thankful to the Research cell, Mawlana Bhashani Science and Technology University, Bangladesh for providing the financial support to complete this research work.
Conflict of Interest
Authors have declared that no competing interests exist.
References
- Amos-Tautua., Martin W. B., and Diepreye E. R. E. Ultra-violet Spectrophotometric Determination of Caffeine in Soft and Energy Drinks Available in Yenagoa, Nigeria. Advance Journal of Food Science and Technology. 2014; 6(2):155-158.
CrossRef - Andrews K., Schweitzer A., Zhao C., Holden J. M., Roseland J. M., Brandt, M. et al. The caffeine content of dietary supplements commonly purchased in the U.S.: Analysis of 53 products having caffeine-containing ingredients. Analytical and Bioanalytical Chemistry. 2007; 389(1): 231-239. DOI:10.1007/s00216-007-1437-2.
CrossRef - Mei A., Mawahib E., Mohammed I. T., Badawi A. Z. and Abdalla A. E. Determination of caffeine in some Sudanese beverages by high-performance liquid chromatography. Pak. J. Nutr. 2012; 11(4): 336-342. DOI: 10.3923/pjn.2012.336.342.
CrossRef - Grembecka M. and Szefer Simultaneous Determination of Caffeine and Aspartame in Diet Supplements and Non-Alcoholic Beverages Using Liquid-Chromatography Coupled to Corona CAD and UV-DAD Detectors. Food Anal. Methods. 2012; 5:1010-1017. DOI:10.1007/s12161-011-9334-x.
CrossRef - Bhawani A., Fong S. S., and Ibrahim M. N. M. Spectrophotometric Analysis of Caffeine. International journal of analytical chemistry. 2015; 1-7. DOI:10.1155/2015/170239.
CrossRef - Goldman D. Caffeinated energy drinks in children. Canadian Family Physician. 2013; 59(9): 947-948.
- M¨uller C., Vetter F., Richter E., and Bracher F. Determination of caffeine, myosmine, and nicotine in chocolate by headspace solid-phase microextraction coupled with gas chromatography tandem mass spectrometry. Journal of Food Science. 2014; 79(2): 251-255. DOI: 10.1111/1750-3841.12339.
CrossRef - Glade J. Caffeine-Not just a stimulant. Nutrition. 2010; 26: 932-938. DOI: 10.1016/j.nut.2010.08.004.
CrossRef - Khan K., Asif M., Arshad M. J., Naeem M. Extraction and chromatographic determination of caffeine contents in commercial beverages. Journal of Applied Sciences. 2006; 6(4): 831-834. DOI:3923/jas.2006.831.834.
CrossRef - Bispo M. S., Veloso M. C. C., Pinheiro H. L. C., Oliveira R. F. S, Reis J. O. N., De-Andrade J. B. Simultaneous determination of caffeine, theobromine, and theophylline by high-performance liquid chromatography. Journal of chromatographic science. 2002; 40(1): 45-48, doi:10.1093/chromsci/40.1.4.
CrossRef - Lang R., Bardelmeier I., Weiss C., Rubach M., Somoza V., Hofmann T. Quantitation of (beta) N-Alkanoyl-5-hydroxytryptamides in coffee by means of LC-MS/MS-SIDA and assessment of their gastric acid secretion potential using the HGT-1 cell assay. Journal of Agricultural and Food Chemistry. 2010; 1593-1602. DOI: 10.1021/jf903612h.
CrossRef - Wanyika H. N., Gatebe E. G, Gitu L. M. , Ngumba E. K. and Maritim CW. Determination of caffeine content of tea and instant coffee brands found in the Kenyan market. J. Food Sci. 2010; 4: 353-358.
- Chen Q., Zhao J., Liu M., Cai J., & Liu J. Determination of total polyphenols content in green tea using FT-NIR spectroscopy and different PLS algorithms. Journal of pharmaceutical and biomedical analysis. 2008; 46(30): 568-73. DOI:1016/j.jpba.2007.10.031.
CrossRef - Ashour, Hegazy M. A., Abdel-Kawy M., and ElZeiny M. B. Simultaneous spectrophotometric determination of overlapping spectra of paracetamol and caffeine in laboratory prepared mixtures and pharmaceutical preparations using continuous wavelet and derivative transform. Journal of Saudi Chemical Society. 2015; 19: 186-192. https://doi.org/10.1016/j.jscs.2012.02.004.
CrossRef - (2006). Food Additives Status List, Food and Drug Administration. Retrieved from. http://www. cfsan.fda.gov/dms/opa-appa.html.
- Shamoli A., Zubair M. A., Khan M. S. H., Bari L., Huq M. A. and Rashid M. A. Identification and quantification of sodium benzoate in different brands of mango juices available in Tangail region, Bangladesh. Bangladesh Pharmaceutical Journal. 2017; 20(1): 20-26.
CrossRef - Pylypiw H. M. J., Grether M. T. Rapid high-performance liquid chromatography method for the analysis of sodium benzoate and potassium sorbate in foods. J Chromatogr A. 2000; 883(1-2): 299-304. DOI:10.1016/s0021-9673(00)00404-0.
CrossRef - MacDougall D., Crummett W. B. Guidelines for data acquisition and data quality evaluation in environmental chemistry. Anal Chem. 1980; 52(4): 2242. https://doi.org/10.1021/ac50064a004.
CrossRef - (1996). Proceedings of the international conference on harmonization. In Harmonised tripartite guideline: validation of analytical procedures: methodology. Geneva.
- Hillary M., Anthoney S. T. and Kipngetich E. T. Determination of Caffeine and pH Levels of Selected Carbonated Soft Drinks and Ready to Drink Juices in Eldoret, Kenya. International Journal of Innovative Research in Eng. & Science. 2013; 2(5): 16-21.
- Nour V., Trandafir I., Ionică E. M. Chromatographic determination of Caffeine contents in soft and energy drinks Available on the Romanian market. Cerc. St. CICBIA. 2010; 11 (3): 351-358.
- Grujić-Letić N., Rakić B., Šefer E., Milanović M., Nikšić M., Ivana V. et al. Quantitative determination of caffeine in different matrices. Macedonian pharmaceutical bulletin. 2016; 62 (1): 77-84.
CrossRef
Accepted on: 07 Dec 2021
Second Review by: Pankaj Jha India
Final Approval by: Prof. Chunpeng Wan


Web of Science Coverage
Emerging Sources Citation Index (ESCI)
2024 Journal Impact Factor: 1.1
Scopus Journal Metrics
CiteScore 2025: 2.6
CiteScore Details
Sustainable Nutrition: Food Systems, Nutrient Retention, and Public Health Impact
![]()
This journal is a member of, and subscribes to the principles of, the Committee on Publication Ethics (COPE)


