

Introduction
Cardiovascular disease (CVD) caused by heart and blood vessel disorders is still the leading cause of death globally. An estimated 17.7 million people die from cardiovascular disease each year. This figure represents 31% of all deaths in the world.1 In developing countries, the risk of death from cardiovascular disease shows an increasing trend, including in Indonesia.2 The Association of Indonesian Cardiovascular Specialists (PERKI) in 2019 reported that cardiovascular disease is the main and first cause of all deaths, which amounted to 26.4%.3 This is in line with data from the Basic Health Research (Riskesdas) in 2018, the incidence of heart and blood vessel disease has increased from year to year. At least, 15 out of 1000 people, or about 2,784,064 individuals in Indonesia suffer from heart disease.4
Unhealthy lifestyle, particularly dietary habits, is believed to play an important role in the development of heart disease. Several epidemiological studies have found a correlation between high fat intake and an increased risk of cardiovascular disease.5-8 A high-fat diet tends to leads to hypercholesterolemia which is a risk factor associated with cardiovascular disease. This can be identified by increasing levels of total cholesterol, low density lipoprotein (LDL), and triglycerides.9 Based on data from the Makassar District Health Office, it can be concluded that there is an increase in the number of hypercholesterolemia and hypertriglyceridemia 2017-2018 period from 40.13% to 43.70%. In aggregate, in Tamalanrea District there are 237 men and 247 women who suffer from hypercholesterolemia, referring to the Integrated Health Post (Posbindu) data collected by Public Health Center of Antara.10
The lipid profile can be improved by changing diet that tends to be high in saturated fatty acids (SFA) to a diet based on mono- and polyunsaturated fatty acids (MUFA and PUFA).11 Olive oil (OO) is a source of oleic acid which has been shown to protect against the development of cardiovascular disease.12 Various studies have shown that OO consumption may improve lipid profiles by reducing blood lipid levels (cholesterol and triglycerides), binding oxidized LDL, and increasing HDL levels significantly.13-15
The use of olive oil (OO) in food is sometimes unsuccessful because the material could be degraded by heat so that it can reduce its biological function.16 Rice bran oil (RBO) actually shows better heat stability because it has a high smoke point reaching 254°C, which is higher than other vegetable oils including OO.17 In addition, RBO shows better thermal oxidation stability than other oils. The existence of γ-oryzanol and the synergistic effect of γ-oryzanol and tocopherol have a greater contribution in maintaining RBO stability under thermal oxidation.18-19 As a source of unsaturated fatty acids, RBO can be considered as a food substitute for OO. With better heat resistance, RBO can be processed into a wider range of food derivatives products. Moreover, rice bran as a raw material for making RBO is abundantly available in Indonesia at a relatively affordable price. Utilization of RBO is also expected to have the same effect on improving lipid profiles. Moreover, RBO contains high levels of gamma-oryzanol which has been shown to help reduce blood fat levels and oxidative stress.20 Gamma-oryzanol decreases blood lipid level by inducing the release of cholesterol 7-alpha-hydroxylase (CYP7A1), an enzyme that plays a role in maintaining cholesterol level. In addition, gamma-oryzanol can also reduce LDL concentration through the inhibition of HMGCoA reductase, a key enzyme involved in cholesterol synthesis in the liver.21 This study aims to determine the effect of RBO on lipid profiles, including total cholesterol, HDL, LDL, and triglycerides in hypercholesterolemia junior high school teachers.
Material and Methods
Research Location and Design
This research was conducted at state junior high schools in the Tamalanrea District of Makassar City. There are 3 state junior high schools in the area and all of them were used as research locations. This type of research is a quasi-experimental with non-randomized pre-test and post-test designs with control group. There were 2 groups in this study, including the intervention group who was given rice bran oil 30 ml/day for 30 days and the control group who was given 30 ml/day olive oil for 30 days. The dose is divided in half (15 ml) and applied to food at breakfast and the remainder given at dinner.22 OO was used as a control group in this study based on its widespread use in hypercholesterolemic patients.12, 23, 24 In addition, OO is also most commonly used as a comparison to assess the effect of other vegetable oils on lipid profiles.13, 25, 26, 27 The RBO and OO used in this study were obtained from supermarket in Makassar, Indonesia. This research was conducted in a single blind manner, where the researcher knew the group that was given rice bran oil and olive oil, while the study sample did not know whether the oil consumed was rice bran oil or olive oil.
Apart from giving RBO and OO, respondents also received dietary education at the beginning of the study explaining hypercholesterolemia and the benefits of rice bran oil and olive oil. This is expected to motivate respondents to comply with the interventions that will be given. To evaluate the compliance of respondents, RBO and OO were not given at the same time for 1 month’s needs, but only 1 bottle (210 ml) was given for 1 week’s needs. Every weekend, each respondent will be met again to receive the next 1 bottle of RBO and OO, while ensuring that the RBO and OO given previously have been consumed. Each respondent was also given a compliance record or control card and it was emphasized that it was only filled in when consuming RBO or OO within the specified amount and time. The control card will also be evaluated every weekend.
Study Population
The population in this study were all junior high school teachers in Tamalanrea District, Makassar City who were over 25 years of age, had total cholesterol levels of more than 200 mg / dL and were willing to consume rice bran oil (RBO) or olive oil (OO) for 30 days. The total population obtained was 116 people. Subjects who met the inclusion criteria were then examined for medical history, medication, physiological conditions, and certain habits that could lead to biased study results. Study subjects who were pregnant or breastfeeding, smoking, undergoing steroid therapy, taking lipid-lowering drugs, and having a history of nephropathy, cardiovascular disease, diabetes, and other chronic diseases were not included in this study. Other external variables such as physical activity were considered homogeneous considering the research subjects had the same profession and working hours, while other characteristics including gender, age, education, abdominal circumference, and BMI were included in this study.
Sampling
The sample in this study were junior high school teachers with hypercholesterolemia. The calculation of the sample size is based on the research regarding the effect of olive oil on the lipid profile levels of hyperlipidemic patients with the following formulations28:

After calculating the sample size, the number of samples needed in this study was 13 people for each group. To anticipate dropouts in the middle of the research, an additional 20% was made. Initially, a total of 32 people were involved in this study and were divided into 2 groups, including the intervention group and the control group. At the end of the study, 3 people were excluded because they did not consume rice bran oil or olive oil for 2 consecutive days or had accumulated 7 days during the study period. Meanwhile, in the data analysis, 1 person was identified as having a fairly extreme total cholesterol value and was considered an outlier so that he was not included in the data analysis. Thus there are 28 people who are the subjects in this study.
Data Collection
Initial data were obtained by measuring the cholesterol levels of junior high school teachers in Tamalanrea District, Makassar City to determine hypercholesterolemia status. Furthermore, the selected study subjects were assessed for their lipid profiles including total cholesterol, triglycerides, HDL, and LDL which were carried out at the beginning and end of the study. Blood specimen collection and lipid profile examination were carried out at the Clinical Health Laboratory, which is a clinical laboratory with the largest network in Indonesia that has quality certification and laboratory accreditation. In addition, a consumption survey was also conducted using the 24-hour food recall method as well as an assessment of nutritional status including anthropometric abdominal circumference and BMI. Respondent characteristic data were obtained through interviews, supplemented with secondary data from the profile of each school.
Ethical Consideration
This study has been approved and obtained permission by the Health Research Ethics Committee of the Faculty of Public Health of Hasanuddin University under protocol number 21019042143.
Data Analysis
Statistical analysis was performed univariate and bivariate using the STATA® programs. Univariate analysis was performed using the frequency distribution for each categorical variable. The frequency distribution aims to describe the characteristics of the respondents which include gender, age, education, abdominal circumference, and BMI. In addition, an intake level assessment was also carried out using the 24-hour food recall which included energy, protein, fat, carbohydrates, fiber, SFA, MUFA, and PUFA. The collected food ingredients were analyzed using the Nutrisurvey programs. To observe the differences in the characteristics and intake of respondents at the beginning of the study, the Fisher Exact and Independent t test were used. Bivariate analysis using paired t test was performed to see the effect of RBO treatment in the intervention group and OO in the control group on changes in lipid profiles. Furthermore, a different test using the Independent t-test was performed to describe the differences in lipid profiles between the RBO and OO groups at the end of the study.
Results
Respondents in this study were teachers of state junior high schools in the Tamalanrea District of Makassar City who had hypercholesterolemia. Characteristics of respondents including gender, age, education level, and nutritional status based on BMI at the start of the study in the two groups did not show any significant difference (p> 0.05). The significant difference was only indicated by the abdominal circumference variable, where the mean abdominal circumference in the RBO group was higher than the mean abdominal circumference in the OO group. This means that the overall distribution of study subjects in the RBO and OO groups is quite homogeneous (Table 1).
Table 1: Characteristics and Nutritional Status of Respondents.
| Variables | Study Group | Sig (p) | |
| RBO(n=15) | OO(n=13) | ||
| Gender (n, %)Male Female |
1 (6.7) 14 (93.3) |
2 (1.4) 11 (84.6) |
1.000a |
| Age (year)(mean ± SD) | 50.9±9.35) | 52.8±6.27 | 0.554b |
| Educational level (n, %)S1 S2 |
10 (66.7) 5 (33.3) |
9 (69.2) 4 (30.8) |
0.228a |
| Abdominal circumference (cm) (mean ± SD) | 90.4±8.14 | 83.2±9.19 | 0.037b |
| BMI (kg/m2) (mean ± SD) |
27.4±3.59 | 26±1.46 | 0.201b |
Notes: n = number of respondents, n (%) = number and percentage of respondents on study variable mean ± SD = mean value and standard deviation of respondents on research variables, Sig (p) = significance value p<0,05
- Fisher Exact analysis results between groups in the same column
- Independent t test analysis result between groups in the same column
A total of 28 teachers participated in this study which were dominated by women (89.3%) with an average age range of 50-52 years. There were 19 respondents who had completed undergraduate education and even 9 (32.1%) of them had taken their master’s degree. This is expected to support adherence to the education provided at the beginning of the study. Hypercholesterolemia status which became the inclusion criterion in this study was confirmed by the nutritional status of the respondents which was more viewed from the abdominal circumference parameters that had exceeded the 80 cm cut-off point for women and BMI with a mean of 26-27.
Respondents who participated in this study were assessed for their consumption description using a 24-hour food recall questionnaire. This assessment was carried out at the beginning and end of the study and the results are presented in Table 2.
Table 2: Food Intake of Junior High School Teachers with Hypercholesterolemia.
| Food Intake Categories | Study Group | Total | Sig (p)* | ||||
| RBO | OO | ||||||
| n (n=15) | % | n (n=13) | % | n | % | ||
| Energy (1800 kcal)Low (<80%) Adequate (80%-110%) High (>110%) |
76 2 |
46.7 40 13.3 |
9 4 0 |
69.2 30.8 0 |
16 10 2 |
57.1 35.7 7.1 |
1.000 |
| Protein (90 g)Low (<80%) Adequate (80%-110%) High (>110%) |
131 1 |
86.7 6.7 6.7 |
12 1 0 |
92.3 7.7 0 |
25 2 1 |
89.3 7.1 3.6 |
1.000 |
| Fat (50 g)Low (<80%) Adequate (80%-110%) High (>110%) |
31 11 |
206.7 73.3 |
63 4 |
46.223.1 30.8 |
94 15 |
32.114.3 53.6 |
0.538 |
| Carbohydrate (247.5 g)Low (<80%) Adequate (80%-110%) High (>110%) |
104 1 |
66.726.7 6.7 |
76 0 |
53.846.2 0 |
1710 1 |
60.735.7 3.6 |
0.755 |
| Fiber (25 g)Low (<25 g) Adequate (≥25 g) |
141 | 93.36.7 | 130 | 1000 | 271 | 96.43.6 | – |
| SFA (<7% x 1800 kkal)Adequate High |
105 | 66.733.3 | 85 | 61.538.5 | 1810 | 64.335.7 | 1.000 |
| PUFA (>10% x 1800 kkal)Low Adequate |
87 | 53.346.7 | 112 | 84.615.4 | 199 | 67.932.1 | 1.000 |
| MUFA (>20% x 1800 kkal)Low Adequate |
150 | 1000 | 130 | 1000 | 280 | 1000 | – |
Notes: SFA = Saturated Fatty Acid, PUFA = Polyunsaturated Fatty Acid, MUFA = Monounsaturated Fatty Acid, n(%) = number and percentage of intake of respondents on each category, Sig (p) = Significance value p<0,05
* Fisher Exact analysis results between groups in the same row
Table 2 shows no significant differences in consumption between the intervention and control groups. Most of the consumption of macronutrients is in the low category, except for fat consumption where half of the respondents consume more than 110% (53.6%). This tendency can be an early predictor of hypercholesterolemia conditions experienced by respondents. The low consumption of fiber can also strengthen this assumption, among the 28 research subjects involved in this study only 1 person consumed fiber according to the recommended adequacy rate (96.4%). In line with that, a saturated fat-based diet (SFA) that exceeds 10% of total calories is still shown by at least 35.7% of respondents. On the other hand, there is a tendency to consume a very limited amount of unsaturated fatty acid sources, even if none of the respondents meet the recommended sufficient amount for MUFAs.
At the end of the study, the survey was repeated to see differences in mean consumption before and after the intervention in the two groups. This can provide an overview of the trend in nutrient consumption that is directly associated with changes in lipid profiles, especially energy, carbohydrates, fiber, fat and fatty acids (SFA, PUFA, MUFA) as shown in Table 3.
Table 3: Difference in Average Consumption After Rice Bran Oil and Olive Oil Administration to Diet.
| Study Group | Intake | ∆ meana | Sig (p)b | |
| Beforemean±SD | Aftermean±SD | |||
| Energy (kcal)RBO | 1606.24±571.51 | 1668.4±94.28 | -62.16±549.50 | 0.067 |
| OO | 1382.46±221.41 | 1668.17±37.41 | -285.72±140.54 | 0.000 |
| Sig (p)c | 0.20 | 0.99 | 0.17 | |
| Protein (g)RBO | 57.05±20.10 | 51.41±9.15 | 5.63±23.30 | 0.365 |
| OO | 51.07±11.68 | 50.45±11.59 | 0.62±15.54 | 0.887 |
| Sig (p)c | 0.36 | 0.81 | 0.52 | |
| Fat (g)RBO | 65.01±25.42 | 69.26±15.52 | -4.25±26.04 | 0.537 |
| OO | 45.54±19.42 | 67.36±12.03 | -21.82±16.32 | 0.000 |
| Sig (p)c | 0.03 | 0.72 | 0.04 | |
| Carbohydrate (g)RBO | 194.6±94.19 | 207.58±37.7 | -12.98±80.43 | 0.542 |
| OO | 193.05±35.06 | 215.18±26.67 | -22.12±46.81 | 0.114 |
| Sig (p)c | 0.96 | 0.55 | 0.72 | |
| Fiber (g)RBO | 8.23±7.19 | 10.99±6.86 | -2.76±3.71 | 0.012 |
| OO | 8.2±3.05 | 10.69±2.50 | -2.49±4.66 | 0.078 |
| Sig (p)c | 0.99 | 0.88 | 0.87 | |
| SFA (g)RBO | 22.27±11.9 | 19.73±8.18 | 2.53±14.04 | 0.496 |
| OO | 18.69±7.91 | 19.77±7.22 | -1.08±6.6 | 0.567 |
| Sig (p)c | 0.37 | 0.99 | 0.38 | |
| PUFA (mg)RBO | 20.27±13.31 | 20.87±6.17 | -0.6±12.40 | 0.854 |
| OO | 11.31±8.94 | 10.08±4.17 | 1.23±10.26 | 0.673 |
| Sig (p)c | 0.02 | 0.00 | 0.68 | |
| MUFA (g)RBO | 14.53±5.96 | 22.67±3.74 | -8.13±6.81 | 0.000 |
| OO | 13.31±7.06 | 32.46±3.78 | -19.15±5.77 | 0.000 |
| Sig (p)c | 0.62 | 0.00 | 0.0001 | |
Notes: Values in the table represent mean values and standard deviation of consumption in the RBO and OO groups, significance value p<0,05 SFA = Saturated Fatty Acid, PUFA = Polyunsaturated Fatty Acid, MUFA = Monounsaturated Fatty Acid
- Difference between post-test and pre-test means
- Paired t-test analysis results between groups in the same row
- Independent t -test analysis results between groups in the same column
At the end of the study, the intervention in the form of RBO, OO and education gave positive results in improving the average consumption of several observed nutritional attributes. This can be seen by an increase of energy intake, carbohydrates, fiber and monounsaturated fat. However, statistical significance was only shown from the increase of mean energy intake in the OO group and mean MUFA intake in the OO and RBO groups. The existence of a significant difference in MUFA consumption when compared to the intake assessment at the start of the study suggests a direct contribution to the provision of RBO and OO. The increase in consumption of MUFA sources is also expected to reduce the negative effects arising from the consumption of total fat which has been indicated by the majority of respondents since the beginning of the study.
The recommended total fat consumption in this study is 50 g / day. At the start of the study, actually the excess fat consumption in the OO group only showed a percentage of about 30% with an average intake of 45.54 g. This is different from the RBO group, which since the beginning has shown an excess proportion of fat intake with an average of up to 65 g. However, consistent results were not obtained for the OO group’s fat intake, the intake assessment at the end of the study showed a mean increase of 21.8 g and had exceeded the mean fat intake in the RBO group. These results lead to differences in mean fat consumption in the two groups at the start of the study and the mean increase in consumption after the second intake assessment at the end of the study.
The difference in intake between the two groups was also shown in the consumption of fatty acids, including PUFA and MUFA. Since the beginning of the study, PUFA consumption in the RBO group showed a half higher mean intake than the OO group. Conversely, MUFA consumption showed a very good mean increase in the OO group after the intervention was carried out with increases reaching 19 mg. This average increase exceeds the increase in MUFA consumption in the RBO group which only reached 8.13 mg.
To assess the contribution of the increase in MUFA identified through the consumption assessment, a lipid profile was measured. Table 4 presents the differences in total cholesterol, HDL, LDL, and triglyceride levels after the addition of RBO and OO in the diet of respondents with controlled amounts and time periods.
Table 4: Comparison of Lipid Profiles Before and After Rice Bran Oil or Olive Oil Administration.
| Study Group | Lipid Profiles (mg/dL) | ∆ meana | Sig (p)b | |
| Before | After | |||
| mean±SD | mean±SD | |||
| Total CholesterolRBO | 253.73±46.83 | 242.07±36.85 | 11.67±20.85 | 0.047 |
| OO | 241.15±28.54 | 229±22.47 | 12.15±16.10 | 0.014 |
| Sig (p)c | 0.41 | 0.28 | 0.95 | |
| HDLRBO | 50.67±9.53 | 48.93±9.12 | 1.73±4.08 | 0.122 |
| OO | 51±10.33 | 51.23±8.31 | -0.23±6.49 | 0.900 |
| Sig (p)c | 0.93 | 0.49 | 0.34 | |
| LDLRBO | 183.47±43.42 | 174.53±35.58 | 8.93±26.17 | 0.207 |
| OO | 154.31±46.15 | 154.31±30.15 | 0±24.3 | 1.000 |
| Sig (p)c | 0.09 | 0.12 | 0.36 | |
| TriglyceridesRBO | 197.53±65.35 | 166.27±49.15 | 31.27±44.56 | 0.016 |
| OO | 232.77±167.9 | 167.08±72.23 | 65.69±108.04 | 0.049 |
| Sig (p)c | 0,46 | 0.97 | 0.27 | |
Notes: Values in the table represent mean values and standard deviation of consumption in the RBO and OO groups, significance value p<0,05, significance value p<0,05
- Difference between post-test and pre-test means
- Paired t-test analysis results between groups in the same row
- Independent t-test analysis results between groups in the same column
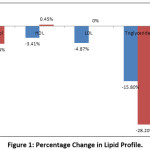 |
Figure 1: Percentage Change in Lipid Profile. |
By re-observing Tables 1 and 2, it can be seen that at the start of the study there were no statistical differences in characteristics, nutritional status, and nutrition intake between the RBO and OO groups, except in the parameters of the abdominal circumference. In almost the same conditions, OO showed a better percentage in lowering triglycerides and cholesterol and increasing HDL levels by 0.45%. On the other hand, the RBO group showed a better decrease in LDL levels, but at the same time it was also followed by a decrease in HDL levels reaching 3.4%.
Discussion
Functional food ingredients that can be used to control and lower blood cholesterol levels are rice bran oil and olive oil.29 The main components of both are monounsaturated fatty acids (MUFA) such as oleic acid and palmitoleic acid and also other functional bioactive ingredients including tocopherols , carotenoids, phospholipids and phenols.30-31 It is known that these contents are able to reduce cholesterol and triglycerides absorption in the intestines and excrete it into feces.32-33 This is in line with the results obtained that both RBO and OO show significant results in lowering cholesterol and triglyceride levels.
The effect of RBO and OO in reducing cholesterol and triglyceride levels can be observed from the results of the intake assessment. The mean amount of MUFA consumed increased significantly in both groups when compared to consumption at the start of the study. It’s just that the increase in MUFA consumption is not balanced with an increase in fiber intake and other sources of unsaturated fatty acids. This underlies the absence of significance found in HDL and LDL parameters. In fact, the two groups showed different patterns and trends in giving effect to HDL and LDL levels. In the group given RBO, there was a decrease in LDL, but at the same time it also decreased HDL. On the other hand, in the OO group, it can be observed that there is an increase in HDL levels in a small percentage, but it does not show a decrease in LDL levels. A study conducted on migrant workers in China proved a correlation between an increase in fiber intake (> 30 g/day) with an increase in HDL concentration up to 10% accompanied by a decrease in the total-LDL cholesterol ratio reaching 14% .34
In contrast to fiber, previous studies have shown that unsaturated fats have a neutral effect on LDL cholesterol concentrations.35 This means that to optimize the effect of reducing HDL and LDL levels, it must also be accompanied by adequate fiber consumption. The tight working hours are suspected to be the cause of the not optimal dietary education provided. Most of the responses are constrained in preparing breakfast at home, meanwhile school canteens do not provide a variety of foods with proper processing to maintain nutrient content. School canteens generally only sell snacks with soup and fried foods with a very low percentage of vegetables and fruit. This also indicates that the energy needs of 1800 kcal have not been fulfilled as recommended, on the other hand, the intake of fat has actually increased. At the start of the study, it was found that half of the respondents (53.6%) had fat consumption above 110%. These results were consistently found at the end of the study where the fat intake in both groups exceeded the recommended intake by the mean range of 67-69 g. Increased consumption of fat in the diet can be an indication of an increase in the amount of saturated and trans fat which can lead to an increase in total and LDL cholesterol.36 This can have an inhibitory effect on improving lipid profiles by administering RBO and OO.
Inadequate carbohydrate consumption also affects the inadequate improvement in the overall lipid profile. Even though there was an increase in carbohydrate intake in the intervention and control groups at the end of the study, the average consumption did not meet the recommended needs of 247.5 g. Carbohydrate diets are neutral to LDL cholesterol, so carbohydrate-rich foods are a good choice to replace a saturated fat diet. On the other hand, a diet rich in carbohydrates (<60% of total calories) is associated with increased HDL cholesterol concentrations and decreased triglyceride concentrations.35
The use of RBO and OO is not limited to proper diet modification, but also requires standard reference regarding the correct dosage. Rice bran oil applied in this study has a serving size of 15 ml with a frequency of 2 times a day (30 ml/day) with a MUFA content of 5.6 g per serving. In one study it was recommended to consume 50 g of RBO daily to achieve a beneficial effect in reducing the risk of chronic disease.37 In another study involving women with hypercholesterolemia conditions aged 19-55 years found that consuming 45 ml/day of RBO gave better results in improving lipid profile compared to consuming only RBO 15 ml/day.38 In this study, the determination of RBO dosage referred to the research conducted on hypercholesterolemia adults aged 25-65 years as much as 30 ml/day. While the dosage for OO is based on the research conducted against hypercholesterolemia patients aged 40-55 years with a dose of 30 ml/day.22, 28
The absence of consensus regarding the dosage of RBO and OO requires further research. This dosage is very important in diet therapy aimed at hypercholesterolemia individuals in the 46-55 years age group. The characteristics of respondents identified in this study indicate that most of the hypercholesterolemia condition is at the productive age in that age range. This is confirmed by a study in Poland which found more than half of the adult population suffering from hypercholesterolemia with the highest percentage found in the 46-55 years old group (91.9%).39
Another characteristic of respondents that is considered influencing the lipid profile parameters measured in this study is the anthropometric index. In order to assess the true effect of RBO and OO interventions, the BMI and abdominal circumference variables must be considered. The follow-up process and the short study duration had not found any improvement in BMI and abdominal circumference at the end of the study. While it is believed that BMI and abdominal circumference that exceed the normal threshold show a significant association with an increased risk of hypercholesterolemia, hypertriglyceridemia, and decreased HDL concentration.40 In line with these results, a study conducted on women aged 45-54 years in Plalangan Village, Indonesia showed a relationship between central obesity and cholesterol levels.41 In this study, respondents had more nutritional status referring to the BMI average which was 26-27 kg/m2, evenly distributed in the control and intervention groups. Meanwhile, based on abdominal circumference parameters, the OO group had a lower mean and was significantly different from the mean abdominal circumference in the RBO group. This could be one reason for the difference in effect found in the increase in HDL levels between the two groups, where the OO group showed a better percentage increase in HDL levels. Even so, the increase in HDL levels observed in the OO group did not meet any significance, the percentage increase only reached 0.45%. The short duration of the study has the potential to cause the observed intervention effect to be not optimal. Animal studies have shown that it will take at least 8 weeks to see significant results on lipid profiles after administration of RBO and OO.42
The final result obtained from this study is the comparison of RBO and OO in improving lipid profile. Statistically, there was no difference in the effect of the two groups on the measured lipid profile. However, if examined more deeply, OO showed a better percentage in lowering triglycerides and cholesterol and slightly raising HDL levels. In contrast, the RBO group showed a better decrease in LDL levels, but at the same time it was also followed by a decrease in HDL levels. The difference in the effects of RBO and OO is related to the differences in the content contained therein. Olive oil consists of the glycerol fraction (90-99%) and the non-glycerol fraction (0.4% -5%). The glycerol fraction consisted of 78% MUFA, 8% PUFA, and 12% SFA. Meanwhile, RBO contains 37% PUFA, 38% MUFA, and 25% SFA.43 This is confirmed by the results of the analysis in Table 2, in the same amount MUFA in OO shows a greater average increase reaching 19.15 mg compared to the mean RBO which is only 8.13 mg. The MUFA content in OO is especially oleic acid (70-80%).14 Oleic acid plays an important role in reducing activity, mRNA abundance and protein level of both acetyl-CoA carboxylase (ACC) and 3-hydroxy-3-methyl-glutaryl CoA reductase (HMGCR), the major regulatory enzymes of fatty acid biosynthesis and cholesterogenesis.44 Meanwhile, the unsaturated fatty acid content in RBO is 38-42% oleic acid and 32-35% linoleic acid. Linoleic acid is widely recognized as an essential fatty acid that can lower blood cholesterol, prevent atherosclerosis and other health effects.45
Although OO is considered as a good source of unsaturated fat, it has a disadvantage in its application in the diet due to its low smoke point. This weakness can be covered by RBO which has a very high smoke point of up to 254°C, which is the highest compared to other vegetable oils.17, 46, 47 From the results of this study, it was found that there was no significant difference between RBO and OO in improving lipid profile, this underlies the wider use of RBO. Rice bran oil can be processed into various derivative products such as cooking oil, supplement products, health, and cosmetics. In the health sector, current research seeks to strengthen the use of RBO as a safer alternative natural hypolipidemic agent than the drug atorvastatin which can cause side effects in some cases in statin-intolerant patients.48
Conclusion
Rice bran oil and olive oil administration to hypercholesterolemia junior high school teachers can significantly improve total cholesterol and triglycerides. Meanwhile, the effect on HDL and LDL improvement has not shown consistent results. Apart from the time duration and the number of doses to be administered, diet modification is also very necessary to optimize the effects of RBO and OO. The potential effects of RBO that are not much different from OO can be considered for the use of RBO into a broader derivative product. In Indonesia, easier access to RBO and a more economical price ensures certainty for its use as functional food.
Acknowledgements
The author gives extraordinary appreciation to the team who has worked hard to complete the research, as well as a special thank you to the respondents and the State Junior High Schools in Tamalanrea District who are willing to facilitate and be involved in this research. Our appreciation also goes to all parties from the Department of Nutrition, Faculty of Public Health, Hasanuddin University for their technical support and contribution of ideas during the research.
Funding Sources
The funds used to carry out this research were allocated independently from the research team and no external fund received.
Conflict of Interest
The authors declared that there is no conflict of interest.
References
- World Health Organization. Cardiovascular Diseases (CVDs). Geneva: World Health Organization; 2017. https://www.who.int/news-room/fact-sheets/detail/cardiovascular-diseases-(cvds). Published 17 May 2017. Accessed August 2020.
- Maharani A., Sujarwoto, Praveen D., Oceandy D., Tampubolon G., Patel A. Cardiovascular Disease Risk Factor Prevalence and Estimated 10-Year Cardiovascular Risk Scores in Indonesia: The SMARThealth Extend Study. PLoS ONE. 2019; 14(4): e0215219. https://doi.org/10.1371/ journal.pone.0215219.
CrossRef - Firdaus I. World Heart Day Press Release. Jakarta: PERKI; 2019. http://www.inaheart.org/news_and_events/news/2019/9/26/press_release_world
_heart_day_perki_2019. Published 26 September 2019. Accessed August 2020. - National Institute of Health Research and Development. Basic Health Research (RISKESDAS). Jakarta: Ministry of Health of the Republic of Indonesia; 2018.
- Zhu Y., Bo Y., Liu Y. Dietary Total Fat, Fatty Acids Intake, and Risk of Cardiovascular Disease: A Dose-Response Meta-Analysis of Cohort Studies. Lipids Health Dis. 2019; 18(1): https://doi.org/10.1186/s12944-019-1035-2.
CrossRef - Visioli F., Poli A. Review Fatty Acids and Cardiovascular Risk. Evidence, Lack of Evidence, and Diligence. Nutrients. 2020; 12(12): 3782. https://doi.org/10.3390/nu12123782.
CrossRef - Glassner D. L. The Association Between Type of Fat and the Risk of Developing Cardiovascular Diseases. The Science Journal of the Lander College of Arts and Sciences. 2018; 12(1):39-46.
- Nettleton J. A., Brouwer I. A., Geleijnse J. M., Hornstra G. Saturated Fat Consumption and Risk of Coronary Heart Disease and Ischemic Stroke: A Science Update. Ann Nutr Metab. 2017; 70(1):26–33. https://doi.org/10.1159/000455681.
CrossRef - Briggs M. A., Petersen K. S., Kris-Etherton P. M. Saturated Fatty Acids and Cardiovascular Disease: Replacements for Saturated Fat to Reduce Cardiovascular Risk. Healthcare (Basel). 2017; 5(2):29. DOI:10.3390/healthcare5020029.
CrossRef - District Health Office of Makassar. Disease Control and Eradication Division Reports 2017 and 2018. Makassar: Districh Health Office of Makassar; 2018.
- Harris C. P., von Berg A., Berdel D., Bauer C. P., Schikowski T., Koletzko S., Heinrich J., Schulz H., Standl M. Association of Dietary Fatty Acids with Blood Lipids is Modified by Physical Activity in Adolescents: Results from the GINIplus and LISA Birth Cohort Studies. Nutrients. 2018; 10(10):1372. https://doi.org/10.3390/nu10101372.
CrossRef - Mart´ın P. S., Covas M. I., Fito´ M., Kusˇar A., Pravst I. Health Effects of Olive Oil Polyphenols: Recent Advancesand Possibilities for The Use of Health Claims. Nutr. Food Res. 2013; 57:760–771. DOI 10.1002/mnfr.201200421.
CrossRef - Namayandeh S. M., Kaseb F., Lesan S. Olive and Sesame Oil Effect on Lipid Profile in Hypercholesterolemic Patients, Which Better?. Int J Prev Med. 2013; 4(9):1059‐1062.
- Raventos, Lamuela R. M., Gimeno E., Fitó M., Castellote A. I., Covas M., Torre-Boronat M. C. D. L., López-Sabater M. C. Interaction of Olive Oil Phenol Antioxidant Components with Low Density Lipoprotein. Biol Res. 2004; 37:247-52.
CrossRef - Neyaz H. S., Singh D., Siddiqui S. S., Kulshreshtha M., Aggarwal T. Effects of Olive Oil on Lipid Profile in Hyperlipidaemic Patients. Med. Res. 2013; 3(4).
- Giuffrè A. M., Zappia C., Capocasale M. Effects of High Temperatures and Duration of Heating on Olive Oil Properties for Food Use and Biodiesel Production. J Am Oil Chem Soc. 2017; 94:819–830. DOI 10.1007/s11746-017-2988-9.
CrossRef - Hadipernata, Mulyana. Processing Bran into Oil (Rice Bran Oil). Bogor: In the Agricultural Research and Development Newsletter. 2007; 29(4): 8–10.
- Rahmania H., Kato S., Sawada, Hayashi C., Hashimoto H., Nakajima S., Otoki Y., Ito J., Nakagawa K. Revealing the Thermal Oxidation Stability and Its Mechanism of Rice Bran Oil. Sci Rep. 2020; 10:14091. https://doi.org/10.1038/s41598-020-71020-y.
CrossRef - Zhao Z., Huang J., Jin Q., Wang X. Influence of Oryzanol and Tocopherols on Thermal Oxidation of Rice Bran Oil during the Heating Process at Chinese Cooking Temperatures. LWT. 2021; 142:111022. https://doi.org/10.1016/j.lwt.2021.111022.
CrossRef - Bumrungpert A., Chongsuwat R., Phosat C., Butacnum A. Rice Bran Oil Containing Gamma-Oryzanol Improves Lipid Profiles and Antioxidant Status in Hyperlipidemic Subjects: A Randomized Double-Blind Controlled Trial. J Altern Complement Med Title. 2019; 25(3). https://doi.org/10.1089/acm.2018.0212.
CrossRef - Bumrungpert A., Chongsuwat R., Phosat C., Butacnum A. Rice Bran Oil Containing Gamma-Oryzanol Improves Lipid Profiles and Antioxidant Status in Hyperlipidemic Subjects: A Randomized Double-Blind Controlled Trial. J Altern Complement Med. 2019; 25(3):353-358. doi: 10.1089/acm.2018.0212.
CrossRef - Zavoshy R., Noroozi M., Jahanihashemi H. Effect of Low Calorie Diet with Rice Bran Oil on Cardiovascular Risk Factors in Hyperlipidemic Patients. J Res Med Sci. 2012; 17(7):626-31. PMID: 23798921.
- Lammi C., Bellumori M., Cecchi L., Bartolomei M., Bollati C., Clodoveo M. L., Corbo F., Arnoldi A., Mulinacci N. Extra Virgin Olive Oil Phenol Extracts Exert Hypocholesterolemic Effects through the Modulation of the LDLR Pathway: In Vitro and Cellular Mechanism of Action Elucidation. Nutrients. 2020; 12:1723. doi:10.3390/nu12061723.
CrossRef - Violante B., Gerbaudo L., Borretta G., Tassone F. Effects of extra Virgin Olive Oil Supplementation at Two Different Low Doses on Lipid Profile in Mild Hypercholesterolemic Subjects: A Randomised Clinical Trial. J Endocrinol Invest. 2009; 32:794–796. https://doi.org/10.1007/BF03345747.
CrossRef - Maki K. C., Lawless A. L., Kelley K. M., Kaden V. N., Geiger C. J, Dicklin M. R. Corn Oil Improves the Plasma Lipoprotein Lipid Profile Compared with Extra-Virgin Olive Oil Consumption in Men and Women with Elevated Cholesterol: Results from A Randomized Controlled Feeding Trial. Clin. Lipidol. 2015; 9(1):49-57. https://doi.org/10.1016/j.jacl.2014.10.006.
CrossRef - Aguilera C. M., Mesa M. D., Ramirez-Tortosa M. C., Nestares M. T., Ros E., Gil A. Sunflower Oil Does Not Protect against LDL Oxidation as Virgin Olive Oil Does in Patients With Peripheral Vascular Disease. Clin Nutr. 2004; 23(4):673-681. https://doi.org/10.1016/j.clnu.2003.11.005.
CrossRef - Nydahl M., Gustafsson I. B., Ohrvall M., Vessby B. Similar Effects of Rapeseed Oil (Canola Oil) and Olive Oil in A Lipid-Lowering Diet for Patients with Hyperlipoproteinemia. J Am Coll Nutr. 1995; 14(6):643-51. doi: 10.1080/07315724.1995.10718554.
CrossRef - Hasan S. H., Singh D., Siddiqui S. S., Kulshreshtha M., Aggarwa T. Effects Of Olive Oil On Lipid Profile In Hyperlipidaemic Patients. Natl. J Med Res. 2013; 3(4):312-314. print ISSN: 2249 4995.
- Tuarita M. Z., Sadek F. N., Sukarno, Yuliana N. D., Budijanto S. Rice Bran Development as Functional Foods: The Opportunities, Obstacles, and Challenges. Bogor: Faculty of Agricultural Technology, IPB University; 2016.
- Ghanbari R., Anwar F., Alkharfy K. M., Gilani A. H., Saari N. Valuable Nutrients and Functional Bioactives in Different Parts of Olive (Olea europaea L.): A Review. Int. J. Mol. Sci. 2012; 13:3291-3340.
CrossRef - Yu F., Lin Q., Chen X., Wei X. High Resolution Gas Chromatography Analysis of Rice Bran Oil. Proc. of SPIE. 2013; 87621E. https://doi.org/10.1117/12.2019622.
CrossRef - Erlinawati N. D., Oetoro S., Gunarti D. R. Effect of Rice Bran Oil on the Lipid Profile of Mild-Moderate Hypercholesterolemic Male Age 19-55 Years Old. World Nutr J. 2017; 1(1):52-56. http://dx.doi.org/10.25220/WNJ.V01i1.0010.
CrossRef - Wilson T. A., Nicolosi R. J., Woolfrey B., Kritchevsky D. Rice Bran Oil and Oryzanol Reduce Plasma Lipid and Lipoprotein Cholesterol Ester Accumulation to a Greater Extent Than Ferulic Acid in Hypercholesterolemic Hamster. J Nutr Biochem. 2007; 18(2): 105–112. https://doi.org/10.1016/j.jnutbio.2006.03.006.
CrossRef - Zhou Q., Wu J., Tang J., Wang J. J., Lu C. H., Wang P. X. Beneficial Effect of Higher Dietary Fiber Intake on Plasma HDL-C and TC/HDL-C Ratio among Chinese Rural-to-Urban Migrant Workers. Int J Environ Res Public Health. 2015; 12(5):4726-38. doi: 10.3390/ijerph120504726.
CrossRef - Erwinanto, Santoso A., Putranto J. N. E., Tedjasukmana P., Sukmawan R., Suryawan R., Rifqi S., Kasiman S. Guidelines for the Management of Dyslipidaemia. Jakarta: PERKI; 2017. http://jki.or.id. Accessed August 2020.
- Houston D. K., Ding J., Lee J. S., Garcia M., Kanaya, A. M., Tylavsky F. A., Newman A. B., Visser M., Kritchevsky S. B. Dietary Fat and Cholesterol and Risk of Cardiovascular Disease in Older Adults: the Health ABC Study. Nutr Metab Cardiovasc Dis. 2011; 21(6):430‐437. doi:10.1016/j.numecd.2009.11.007.
CrossRef - Ali A., Devarajan S. Nutritional and Health Benefits of Rice Bran Oil. In: Manickavasagan A., Santhakumar C., Venkatachalapathy N. Brown Rice. Switzerland: Springer, Cham; 2017. 135-158. https://link.springer.com/book/10.1007/978-3-319-59011-0. Accessed August 2020.
CrossRef - Erlinawati N. D., Oetoro S., Gunarti D.R. Effect of Rice Bran Oil on the Lipid Profile of Mild-Moderate Hypercholesterolemic Male Aged 19-55 Year. World Nutr. J. 2017; 1(1). http://dx.doi.org/10.25220/WNJ.V01i1.0010.
CrossRef - Hoffmann K., Matyjaszczyk P., Zaporowska S. I., Kostrzewska M., Piorunek T., Minczykowskp A., Bryl W. Lipid Profile of Polish Primary Care Patients Aged 35-55 Years Living in the District of Pleszew. Acta Pol Pharm. 2016; 73(2):537-46. PMID: 27180447.
- Devi S., Choudhary A. K., Verma P., Jain N., Garg, N. Association of Lipid Profile, Body Mass Index, and Waist Circumference as Cardiovascular Risk Factors for Obese Male Adults of North India. Int. J. Sci. Study. 2017; 4(10):149-154. DOI: 10.17354/ijss/2017/30.
- Listiyana A. D., Mardiana, Prameswari G. N. Central Obesity and Total Blood Cholesterol Levels. KEMAS. 2013; 9(1):37-43. https://doi.org/10.15294/kemas.v9i1.2828.
- Ojah K., Gogoi G., Chaliha M., Borah A. Hypolipidaemic Effect of Rice Bran Oil and Olive Oil in Hypercholesterolemic Rats. Indian J Basic Appl Med Res. 2017; 7(1):98-108.
- Wijayanthie N., Gunarti D. R., Manikam N. R., Yulhasri. Effects of Extra Virgin Olive Oil Versus Rice Bran Oil on Glycemic Control in Patients with Type-2 Diabetes Mellitus. Int J App Pharm. 2019; 11(6). DOI: 10.22159/ijap.2019.v11s6.33540.
CrossRef - Gnoni G. V., Natali F., Geelen M. J. H., Siculella L. Oleic Acid as an Inhibitor of Fatty Acid and Cholesterol Synthesis. In: Preedy V. R., Watson, R. R. Olives and Olive Oil in Health and Disease Prevention. Massachusetts: Academic Press; 2010: 1365-1373. https://www.sciencedirect.com/book/9780123744203/olives-and-olive-oil-in-health-and-disease-prevention. Accessed 28 February 2021.
CrossRef - Wang Y., Jones P. J. Dietary Conjugated Linoleic Acid and Body Composition. Am J Clin Nutr. 2004; 79(6):1153S-1158S. doi: 10.1093/ajcn/79.6.1153S.
CrossRef - Garofalo S. F, Tommasi T., Fino D. A Short Review of Green Extraction Technologies for Rice Bran Oil. Biomass Conv. Bioref. 2020. https://doi.org/10.1007/s13399-020-00846-3.
CrossRef - Maurya N. K., Kushwaha R. Pharmacognosy of Rice Bran Oil – A Review. Int J Green Pharm. 2019; 12:784–789. https://doi.org/10.22377/ijgp.v12i04.2255.
CrossRef - Shakib M. C., Gabrial S., Gabrial G. Rice Bran Oil Compared to Atorvastatin for Treatment of Dyslipidemia in Patients with Type 2 Diabetes. OA Maced J Med Sci. 2014; 2(1):95-102. http://dx.doi.org/10.3889/oamjms.2104.017.
CrossRef

This work is licensed under a Creative Commons Attribution 4.0 International License.