A Network-based Analysis of Ingredients Lists in Nutrient Profile Systems
Ricky Flores and Kathryn M. Cooper*
College of Information Science and Technology, University of Nebraska at Omaha, Omaha, NE, USA.
Corresponding Author Email: kmcooper@unomaha.edu
DOI : http://dx.doi.org/10.12944/CRNFSJ.9.3.08
Download this article as:
![]()
It is well-established that diseases can be prevented or mitigated through dietary intervention, yet proper nutrition is one aspect consumers struggle to manage. Recent studies have shown that there are barriers to understanding the nutrition facts component of a food label which can be linked to dietary choices. In this work, we demonstrate reproducibility and replicability of a network-based method for automating the analysis of ingredients on a food product label en masse using the Open Food Facts Database and the USDA FoodData Central Branded Foods database in February 2020. Our results, which analyze the co-occurrence of 72,754 ingredients across show some consensus in labeling across FALCPA-regulated ingredients in food product labels across databases but highlight potential areas for discrepancy in consumer understanding and labeling practices for terms not subject to strict regulations. The key findings or contributions of this work include the provision of a reproducible method for quantifying the ingredients of packaged food in the United States across two nutritional profiling systems, and have identified 17 total ingredients that appear in the top 20 most co-occurring ingredients for both databases examined. We compare how of 8 FALCPA-regulated ingredients are represented in ingredients lists versus a common, but non-FALCPA regulated ingredient (corn), to demonstrate how one could examine differences between ingredient labeling between products. These findings suggest more research is needed in developing information systems to increase information available for consumers.
KEYWORDS:Consumer Health Informatics; Food Analysis; Food Composition; Food Database; Ingredient Network; Network Analysis; Nutrition Informatics
Introduction
It is estimated that diet-related illness and/or poor nutrition was a contributing factor in up to 26% of premature deaths in the United States from 1990 to 2010 1. According to a 2015 report from the National Research Council, the application of nutrition research has the potential to reduce rates of obesity, healthcare costs, and food waste 2, and nutrition research plays a vital role in human health and wellness. Current research into information systems for food composition and analysis suggest that consumer-documented data is driving a number of rising subdisciplines in the field3-6; for example, in the analysis of the evolution of culinary tastes and rules called “computational gastronomy” 7, and the impact of herbs used in food preparation on health 8-11. However, these new subdisciplines require collaborative team science approaches. A 2014 review of upcoming challenges in food and agriculture notes that many barriers to progress in nutrition science and agriculture are rooted in the diversity of disciplines needed to perform this research, and also the complexity of the challenges themselves12. In brief, a multidisciplinary, team science approach can help drive solutions to today’s challenges in nutrition and food science, including discerning how individuals can use nutrition to improve their health and reduce their likelihood of developing chronic diseases. Nutrition informatics has the opportunity to bring high-impact tools to health and agriculture.
One of the most immediate problems facing rising subfields of nutrition research is a lack of information systems to support the translation of user-documented nutrition and consumption behaviors (food logs, app-based data, etc.) to insights for disease prevention, diagnosis, and treatment. A study of grocery store purchases by consumers and health outcomes recommended a number of long-term strategies linking nutritional composition, technology, food science, and health 13. These strategies included promotion of health management through technology, improvement of ingredient quality, support from health insurance companies, and implementation of better prevention strategies through public health policy13. A 2016 study of 226 participants from Italy investigated the effectiveness of food labels for health prevention, finding that 95% of respondents report reading the label on the back of a food product (commonly known as the Nutrition Facts panel or NFP) 14. This research builds on existing knowledge of the link between health outcomes and nutrition literacy in consumers.
Food Label Use and Literacy in Consumers
A focus on food label literacy then has potential for a role in the prevention of disease via modification of one’s dietary behaviors, and studies demonstrate consumer interest in understanding the composition of their food. A 2011 retrospective study on the National Health and Nutrition Examination survey of the United States found that approximately 51% of participants looked at the ingredients list on the back of the product label15; depending on the study sample, this number has been estimated to be higher16. Usage of the food label has been associated with healthier dietary behaviors in adolescents 17 However, consumers do measurably fail to understand the provenance and production of ingredients on the food label14. A review of nutrition knowledge literature in 2015 found that only 3 of 34 studies analyzed include the ingredients list in their analysis of the food product label18 (the ingredients list is not technically part of the Nutrition Facts panel), despite acknowledgment that the ingredient list is key for consumer understanding of food composition and making healthy dietary choices19 Further, the current standards used to define a food label does not lend itself to consumer understanding. For example, a 2017 study of 100 older adults in Delaware found that less than half were able to correctly interpret the back of product food label despite the perception that they understood it 20. Combined, there is a demonstrated need for quantitative measures that can consistently represent the nutrients present in foods produced and/or distributed that reflect consumer knowledge. This need cannot be addressed without information systems in place to address the ambiguity of current food labeling standards in the United States.
Policy and the Food Label
As an example, the Food and Drug Administration (FDA) Code of Federal Regulations Title 21 Part 101, Subpart A 101.4 (a) describes regulations for food labeling, and states that foods should be labeled, in order of priority, using a name specified by law, a “common or usual name” of the food, or lastly, an “appropriately descriptive term, or when the nature of the food is obvious, a fanciful name commonly used by the public for such food.21 ” However, this flexibility in labeling can lead to difficulty in interpretation of the label, especially when ingredients have multiple names or do not come from a readily identifiable source (i.e. “dextrose” as a product made from corn). Examples of ingredient lists with ambiguous meanings can be readily identified on food products available in the United States.
Some of the most consistent FDA labeling regulations that can be observed include, for example, requirements for allergen labeling22 and prioritization on the label for ingredients with the most weight to the least in the product. A 2001 study found that 5.3% of adults in the United States had a diagnosed food allergy23. While the Food Allergen Labeling and Consumer Protection Act (FALCPA) covers the top 8 common allergens found, there are serious implications for ambiguous or unclear labeling of food allergies or intolerances that are less common. For example, corn is not listed as one of the FALCPA allergens but allergy to corn protein has been found to cause food protein-induced allergic proctocolitis (FPIAP) in breastfed infants and can be associated with the development of food allergies later in life24. While “corn” as a term is likely to be readily identifiable by the consumer on a food label, its derivatives may be less recognizable, including dextrose, maltodextrin, erythritol, and can even be found in items like powdered sugar to reduce clumping, but without annotation on the ingredient label. In short, for an individual with an allergy to corn, navigating the grocery store, social events, and a menu at one’s favorite restaurant can be tedious at best. For the consumer in pursuit of a healthy diet, unambiguous labeling of food is imperative to their health and wellness both from a short- and long-term perspective. A 2014 study in this area notes the importance of nutrition information systems for the provision of structure to the interdependence between products, ingredients, and flavors12. In this work, we present cursory reproducibility and replicability studies of a network-based method for automating the analysis of ingredients on a food label en masse using the Open Food Facts Database and the United States Department of Agriculture (USDA) FoodData Central database. Our results show some consensus in labeling across commonly occurring ingredients in food labels across databases using exact term matching, but highlight potential areas for the discrepancy in consumer understanding and labeling practice. These findings can inform best practices for identifying common terms that accurately reflect both consumer understanding and ingredient provenance.
Relevant Background
An ingredient co-occurrence network for packaged foods in the United States provides insight into the commonly used ingredients throughout the United States. Previous work by 25 presents a comprehensive co-occurrence network for ingredients found in packaged foods in the United States utilizing the Open Food Facts Database25. Results of this work indicated that there exist a small group of ingredients that commonly occur together in packaged foods stored in the Open Food Facts database and highlight the challenges of aggregating ingredients from food products. Using co-occurrence networks to identify ingredients that occur together appears to be a unique approach having no work done previously. Although several regulations concerning the nutrition label have long been in place, there continue to be significant changes to food labeling guidance even within the last 5 years26. An investigation into the public’s understanding of the nutrition label concluded that there continues to be a lack of research in its understanding 27. The objective of this analysis is to describe the necessity for readable ingredient information found on the nutrition labels of packaged foods for consumers. We describe this objective in our research roadmap, shown in Figure 1.
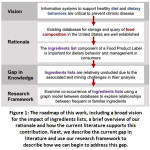 |
Figure 1: The roadmap of this work, including a broad vision for the impact of ingredients lists, a brief overview of our rationale and how the current literature supports this contribution. |
Materials and Methods
For a detailed walk-through of our network implementation and analysis, please visit our GitHub repository, shared at the following link: https://github.com/r-flores/Ingredient_CoOccurrence.
Data Download
From the Open Food Facts database, data was downloaded from https://world.openfoodfacts.org/data on February 15, 2020, as a CSV file. The Open Food Facts database is sourced by volunteer contributors as a food product and composition database and is updated on a daily basis. From the USDA FoodData Central database, data was downloaded from https://fdc.nal.usda.gov/download-datasets.html on February 15, 2020, as a CSV file. The USDA FoodData Central database was implemented in 2019 to centralize food composition databases under the guidance of the USDA 28. First, duplicate items were removed by barcode and only foods sold in the United States were identified to be kept from the Open Food Facts data (the USDA FoodData Central database contains only foods distributed in the US by design). We also removed products with empty ingredients lists or with only one ingredient in their list. All ingredients were then pre-processed to convert them to similar formatting and spelling (changed to lower case, special marks removed, linguistic formatting standardized, redundant and preparatory terms not affecting food composition removed). This process resulted in a list of unique barcodes for foods sold in the United States with at least 2 or more ingredients. After pre-processing, the total number of food products used from the Open Food Facts database was 173,957. Compared to our previous work25 this indicates the addition of 472 food products since March 2019. The USDA FoodData Central database contained 307,828 food products after pre-processing.
Ingredient Co-Occurrence Network Construction
Our ingredient co-occurrence networks were created as described previously by 25. In brief, after ingredient pre-processing, using each product barcode, each ingredient from its ingredient list was defined as a node. An edge is drawn between nodes if two ingredients co-occur in the same food product in their ingredients list. For example, a food with an ingredient list “salt, flour, egg” would result in three nodes (salt, flour, and egg) and three undirected edges (salt to the flour, salt to egg, and flour to egg). Edges have no direction but are weighted, where weights represent a simple count of the total number of times any two ingredients co-occur in a food product. After network construction, networks were analyzed for basic network descriptive measures using R, RStudio, and the igraph R package29, and Cytoscape version 3.4.0 was used to visualize our networks30. For a detailed walk-through of our network implementation and analysis, please visit our GitHub repository, shared above.
Results
Reproducibility of the Co-Occurrence Network
It is important that the original work from 25 is reproducible before continuing to draw insights from its analysis; therefore, we first reproduce this work to evaluate the preservation of this network over time (in this case, approx. 11 months). In the original paper, 25 describes a method for producing a co-occurrence network for ingredients lists; this work aims to reproduce that work with updated data from the Open Food Facts database as well as add a comparative analysis of the method using the USDA FoodData Central database. The goal of these contributions is to: confirm that the results of 25 are reproducible across time points, to provide evidence of the reproducibility of those findings, and to compare the findings of the original method using a database that is provided and curated by the United States Department of Agriculture. The original database used, the Open Food Facts Database, is volunteer-driven and is not limited to food products in the United States, but instead stores information about food composition from foods around the world.
Here we present the reproducibility of the original co-occurrence network by comparing results from data generated on 02-15-2020 at 9:22 pm Central Standard Time (CST) (Table 1) to the original work done by 25. There was a total of 72,754 ingredients included in our co-occurrence network (“2020-Feb”), with 2,219,817 co-occurrences in the more recent data. This represents an addition of 1,567 ingredients and with an additional 8,270 co-occurrences to the original work from March 2019 (“2019-Mar”). Both the 2020-Feb network and the 2019-Mar original network manifest the same top 20 co-occurring ingredients from their respective networks with salt, sugar, and water constituting the top 3 co-occurring ingredients (12.05% for the 2020-Feb network and 12.07% in the 2019-Mar network).
Table 1: The top 20 co-occurring ingredients from the co-occurrence network generated from the Open Food Facts Database on 2/15/2020. The rank indicates each ingredient as ranked by co-occurrence count, followed by the ingredient’s name. The count of co-occurrences measures the number of discrete times that a given ingredient has occurred together with another ingredient on the ingredients list of a nutrition label.
| Rank | Ingredient | 2020-Feb | Δ Count (from 2019-Mar to 2020-Feb) | 2020-Feb |
| Co-Occurrence Count | Co-Occurrence % total | |||
| 1 | Salt | 107,764 | +301 | 4.86% |
| 2 | Sugar | 80,505 | +177 | 3.63% |
| 3 | Water | 79,184 | +109 | 3.57% |
| 4 | Citric Acid | 35,296 | +71 | 1.59% |
| 5 | Wheat Flour | 35,206 | +65 | 1.59% |
| 6 | Flavor | 33,113 | +112 | 1.49% |
| 7 | Milk | 28,384 | +178 | 1.28% |
| 8 | Riboflavin | 22,544 | +94 | 1.02% |
| 9 | Folic Acid | 22,392 | +108 | 1.01% |
| 10 | Niacin | 22,084 | +67 | 1.00% |
| 11 | Corn Syrup | 20,424 | +37 | 0.92% |
| 12 | Artificial Flavor | 18,671 | +53 | 0.84% |
| 13 | Soybean Oil | 18,433 | +27 | 0.83% |
| 14 | Spices | 18,418 | +18 | 0.83% |
| 15 | Soy Lectin | 17,743 | +48 | 0.80% |
| 16 | Sea Salt | 16,046 | +38 | 0.72% |
| 17 | Vinegar | 15,641 | -11 | 0.70% |
| 18 | Enzymes | 15,148 | +79 | 0.68% |
| 19 | Corn Starch | 15,032 | +60 | 0.68% |
| 20 | Garlic | 14,980 | +24 | 0.68% |
Table 2: A list of descriptive statistics for both ingredient co-occurrence networks. The number of nodes and edges is the total count of nodes (ingredients) and edges (a discrete co-occurrence of two ingredients in a food label) present in a given network. Edge Density is the ratio of total edges found in the network to the total possible edges in the network; our networks are very sparse, with an edge density of less than 1% in both networks. Transitivity describes the clustering tendency or coefficient using three nodes sets within the network. The change in transitivity between networks is very small, meaning the clustering tendency between local nodes is similar.
| Network Descriptive | Open Food Facts 2020-Feb Network | Open Food Facts 2019-Mar Network | Δ Open Food Facts Networks, 2019-Mar to 2020-Feb | USDA FoodData Central Database2020-Feb Network |
| # of Nodes | 71,667 | 69,840 | +1,827 | 65,562 |
| # of Edges | 2,580,474 | 2,523,325 | +57,149 | 3,213,821 |
| Edge Density | 0.0502% | 0.1035% | -0.0533% | 0.0750% |
| Transitivity | 0.04098 | 0.04172 | -0.00074 | 0.0421 |
The raw dataset generated in Feb. 2020 contained 173,957 total foods for the United States (+472 from 2019-Mar), after pre-processing and network construction, 160,933 products were represented in our 2020-Feb co-occurrence network (+1,224 from 2019-Mar). Table 2 shows a comparison of network descriptions from both networks including size, density and transitivity. We see that in our more recent 2020-Feb network that there are more nodes and edges present in general. This can be explained by the fact that data by new users is added over time so naturally more nodes would be present with new foods being entered. We also observe negligible decreases in network density and network transitivity. These overall descriptions of both networks are nearly identical and suggest that despite the addition of new products into the Open Food Facts Database, these additions have not disrupted the overall structure of the co-occurrence network.
Like the original co-occurrence network, clustering revealed that most nodes still belonged to a single cluster by measuring the connectedness of core ingredients in the network. Since this is a relatively new application of clustering to this type of network, we have no gold standard or benchmark clustering analysis with which to compare this result. We examined this by measuring the density of the induced subgraph for the top k nodes by degree from the top 3 nodes and then from k = 50 to 5000 in increasing steps of 50, in accordance with the previous methodology 25. We observe that the induced subgraphs for the top 400 nodes by degree had an edge density of 91.63%, only slightly lower than the original work (91.71%). Much like the original work, increasing k results in further decreases to edge density; if we expand the search to k = 5000 the edge density drops to 7.86% again mirroring the original works 7.83% when expanded to k = 5000. This again suggests that there is a tightly connected core of ingredients that are commonly occurring in food products as found by 25. Figure 2 and Figure 3 show the induced subgraph for the top 20 nodes by degree for our 2020-Feb network made from the Open Food Facts database. We see that both networks share the same nodes with nearly identical edges showcasing the reproducibility of a co-occurrence network with Open Food Facts from 25
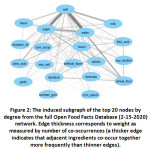 |
Figure 2: The induced subgraph of the top 20 nodes by degree from the full Open Food Facts Database (2-15-2020) network. |
Replicability in Publicly Available Food Databases
To examine the replicability of the work done in 25, the analysis above was performed on the USDA Central Food database which was implemented in 2019 to centralize food composition databases under the guidance of the USDA28 for the purpose of data sharing and enhancing consumer health in part through the provision of information31. Here we present the replicability of the co-occurrence network with data from the USDA Central Food database generated on 2-15-2020. First, we present the top 20 co-occurring ingredients found in the network (Table 4) with their co-occurrence count and the total percentage they represent. This dataset is larger than the Open Food Facts database with a total of 96,352 ingredients with 6,092,506 co-occurrences counted after processing and network creation. The top 3 co-occurring ingredients were once again found to be salt, sugar, and water (11.61% of co-occurrences).
Table 3: The Top 20 Co-Occurring Ingredients from the Co-Occurrence Network Generated from the USDA’s FoodData Central Database.
| USDA CF Rank | US Open Food Facts Rank | Ingredient | Co-Occurrence Count | Co-Occurrence % Total |
| 1 | 1 | Salt | 310,347 | 5.09% |
| 2 | 2 | Sugar | 200,382 | 3.29% |
| 3 | 3 | Water | 196,497 | 3.23% |
| 4 | 6 | Flavor | 104,431 | 1.71% |
| 5 | 4 | Citric Acid | 92,766 | 1.52% |
| 6 | 5 | Wheat Flour | 92,120 | 1.51% |
| 7 | 7 | Milk | 78,576 | 1.29% |
| 8 | not in the top 20 | Soy Lecithin | 64,800 | 1.06% |
| 9 | 8 | Riboflavin | 60,808 | 1.00% |
| 10 | 9 | Folic Acid | 60,552 | 1.00% |
| 11 | 12 | Artificial Flavor | 55,414 | 0.91% |
| 12 | 10 | Niacin | 54,674 | 0.90% |
| 13 | not in the top 20 | Enzyme | 54,322 | 0.89% |
| 14 | 13 | Soybean Oil | 51,418 | 0.84% |
| 15 | 11 | Corn Syrup | 51,124 | 0.84% |
| 16 | 14 | Spices | 49,809 | 0.82% |
| 17 | 19 | Corn Starch | 48,348 | 0.79% |
| 18 | not in the top 20 | Dextrose | 44,460 | 0.73% |
| 19 | 16 | Sea Salt | 41,177 | 0.68% |
| 20 | 17 | Vinegar | 38,660 | 0.63% |
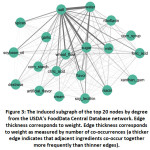 |
Figure 3: The induced subgraph of the top 20 nodes by degree from the USDA’s FoodData Central Database network. |
The raw dataset contained 331,272 total foods, and after pre-processing, 307,828 products are represented in the co-occurrence network. Table 2 contains a list of network descriptors for this network in comparison with the Open Food Facts database co-occurrence networks.
Clustering the USDA’s FoodData Central database revealed again that most nodes continue to center around a single cluster. To examine this, we measured the density of the induced subgraph for the top k nodes by degree beginning with the top 3 then moving from k = 50 to k = 5000 with incremental steps of 50. We observe that the induced subgraph for the top 400 nodes contains an edge density of 86.23% and drops significantly as we increase the number of nodes in the induced subgraphs. When we expand the “top k” to 5000 the subgraph has an edge density of only 9.54%. These observations further reinforce the idea that there is a tightly connected core of ingredients that are commonly occurring in packaged food products within the U.S. The induced subgraph (Figure 2) is nearly identical to the one generated from the Open Food Facts Database, similar edge weight can still be seen between the top 3 ingredients (salt, sugar, and water) as well as 19 of the 20 nodes being the same in both networks.
Ingredient Terminology
Here we present the many ways ingredients are being labeled on nutrition labels by counting the number of times a variation of the term is found on the nutrition labels after data processing. We examined this by looking at the top 8 FALCPA allergens and the ingredients they may be found in. A summary of each ingredient and a selection of terms that describe it follows, including the number of times that ingredient occurs as written exactly in the co-occurrence networks made from the Open Food Facts Database and the USDA FoodData Central Database. For example, “egg” is one of the top 8 FALCPA allergens and based on our research it appears 417 different ways in the Open Food Facts database and 745 different ways in the USDA FoodData Central. Egg-containing ingredients also appear in a few different ways throughout the network, like albumin, eggnog, and lysozyme. “Milk” is another of the top 8 FALCPA allergens and based on our research milk alone appears 1,948 different ways in the Open Food Facts network and 3,136 different ways in the USDA FoodData Central network.
The examples are shown in Figure 3 highlight only a fraction of the diversity of ingredient terms found in packaged foods in the United States, and the ambiguity in labeling ingredients containing these allergens is mitigated by the fact that elsewhere on the label, they are required to contain verbiage that clearly states the product contains a given allergen (i.e. food that contains the ingredient casein will also be labeled as containing milk, even though milk is not an ingredient). When looking at the number of ways these allergens are being represented in the network, it appears that there is a tendency for a term to be labeled with its “common usage”, i.e., wheat, milk, cheese, peanut(s), egg, and fish. However, without further development of tools to automatically standardize the presentation of these terms, this cannot be confirmed.
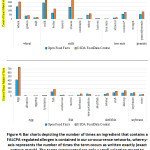 |
Figure 4: Bar charts depicting the number of times an ingredient that contains a FALCPA-regulated allergen is contained in our co-occurrence networks. |
Next, we examine a case study in the diversity and presence of an ingredient that is not FALCPA regulated, corn. We expect to find that term used for ingredients containing and derived from corn to be more evenly distributed, due to the fact that this term is not FALCPA regulated. Corn is relatively easy and cheap to grow and is commonly used as a feed grain, starch, sweetener, and fuel product32. The ingredients listed are certainly not the only corn-derived or corn-containing products, and some may not always contain corn. Further, it could be argued that the corn content in the ingredients listed in Figure 4 does not contain sufficient corn protein to warrant an allergic IgE-mediated response. However, it can be argued that if the purpose of the food label is to inform the consumer of the content of the food, knowing the provenance of the ingredient should and could play a role in the consumption of that product. Figure 4 lists the first count of ingredients with ‘corn’ contained in the ingredient, and then ingredients where the consumer may not know that corn is the parent ingredient because it is not explicitly contained in the name. Certainly, we observe in this specific example, that there is a diversity of terms that can be used to demonstrate a corn-derived product is present in the product.
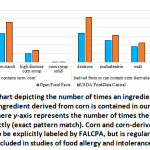 |
Figure 5: Bar chart depicting the number of times an ingredient that contains corn or an ingredient derived from corn is contained in our co-occurrence networks. |
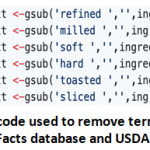 |
Figure 6: A sample of the code used to remove terms used in food processing from the Open Food Facts database and USDA Food Central system. |
Limitations and Other Considerations
Our analysis here removes any processing terms from our ingredients lists which is both abstraction and a bias in some regard. For example, terms such as bleached, enriched, grass-fed, corn-fed, defatted, fractionated, ground, crushed, pitted, and milled are removed from our dataset before network creation (see Figure 5). However, it is established that processing whole foods can affect the nutritional content of that food 34,35 and little evidence about how this processing may or may not be represented in the Nutrition Facts panel and ingredient list. It is reasonable then to question how ingredient labels represent processing, how this is perceived by consumers, and how quantitatively the ingredients list and Nutrition Facts panel can be automated for comparison against known instruments, such as the NOVA classification system36
Conclusions
This work contributes to the field of food label literacy and nutrition informatics by providing a reproducible method for quantifying the ingredients of packaged food in the United States across two nutritional profiling systems, the Open Food Facts Database and the USDA FoodData Central system. We demonstrate diversity in representation in ingredients that are strictly regulated and showcase how ingredients that are less tightly regulated in their labeling might be misunderstood by consumers. We expect that a larger systematic analysis of these terms will show that analysis of ingredients that are not labeled under strict federal guidance will have a broader diversity in semantic representation and plan to explore this in our future work. However, the implications of our current work show insights into the potential for discrepancies between current labeling practice and consumer literacy in the food label. Having an ingredient be represented in so many ways can make it difficult for the consumer to understand what they are eating and how it could impact consumer health.
A system that can identify the various terms used to represent an ingredient and match it to its common term or the nutrient it derives from would help the consumer make informed health decisions, and can also aid in labeling practice for ingredients that have more flexible or ambiguous definitions in labeling guidance. It can be difficult for a consumer with health concerns to know every way an ingredient may be represented on a nutrition label, therefore having the ability to search for any ingredient they may not be familiar with and have returned where it derives from and other common names would make it easier for the consumer to decide what they should or should not eat.
Specific implications of this work indicate that an information system for identifying and combining synonyms between terms is needed to perform accurate analysis of the data; i.e., counting ‘flavours’, ‘flavour’, ‘flavors’, and ‘artificial flavors’ as equal terms needs to be performed through a more sophisticated approach than a simple search and replace function as performed here. We propose this occur through a fuzzy string matching and NLP approach, which also allows for a combination of synonyms (i.e., ‘corn’ and ‘maize’) where the ingredient is not the same with regards to processing but originates from the same plant. In summary, these findings can inform future work and best practices for identifying common terms that accurately reflect both consumer understanding and ingredient provenance, and suggest more research is needed in developing information systems to harness increasing information available for the consumer in the field of nutritional literacy.
Acknowledgments
None.
Funding Sources
This research was supported by a Business, Informatics, and Gerontology BIG Idea award through the University of Nebraska at Omaha.
Conflict of Interest
The authors declare no conflict of interest.
References
- Murray, C. J., Abraham, J., Ali, M. K., Alvarado, M., Atkinson, C., Baddour, L. M., … & Lopez, A. D. (2013). The state of US health, 1990-2010: burden of diseases, injuries, and risk factors. Jama, 310(6), 591-606.
CrossRef - National Research Council. (2015). A framework for assessing the effects of the food system.
- Maringer, M., van’t Veer, P., Klepacz, N., Verain, M. C., Normann, A., Ekman, S., … & Geelen, A. (2018). User-documented food consumption data from publicly available apps: an analysis of opportunities and challenges for nutrition research. Nutrition Journal, 17(1), 1-13.
CrossRef - Samoggia, A., & Riedel, B. (2020). Assessment of nutrition-focused mobile apps’ influence on consumers’ healthy food behavior and nutrition knowledge. Food Research International, 128, 108766.
CrossRef - Boland, M., & Bronlund, J. (2019). nutrition-The next dimension for eHealth?. Trends in Food Science & Technology, 91, 634-639.
CrossRef - Eldridge, A. L., Piernas, C., Illner, A. K., Gibney, M. J., Gurinović, M. A., De Vries, J. H., & Cade, J. E. (2019). Evaluation of new technology-based tools for dietary intake assessment—An ilsi europe dietary intake and exposure task force evaluation. Nutrients, 11(1), 55.
CrossRef - Ahn, Y. Y., Ahnert, S. E., Bagrow, J. P., & Barabási, A. L. (2011). Flavor network and the principles of food pairing. Scientific reports, 1(1), 1-7.
CrossRef - Chandrababu, S., & Bastola, D. (2019). An integrated approach to recognize potential protective effects of culinary herbs against chronic diseases. Journal of Healthcare Informatics Research, 3(2), 184-199.
CrossRef - Chandrababu, S., & Bastola, D. (2019, May). Graph Model for the Identification of Multi-target Drug Information for Culinary Herbs. In International Work-Conference on Bioinformatics and Biomedical Engineering(pp. 498-512). Springer, Cham.
CrossRef - Chandrababu, S., & Bastola, D. R. (2018, June). Comparative analysis of graph and relational databases using herbmicrobeDB. In 2018 IEEE International Conference on Healthcare Informatics Workshop (ICHI-W)(pp. 19-28). IEEE.
CrossRef - Chandrababu, S., & Bastola, D. R. (2017, November). CuHerbDB-for pharmacogenomics and study of phytochemicals in culinary and medicinal herbs. In 2017 IEEE International Conference on Bioinformatics and Biomedicine (BIBM)(pp. 1787-1794). IEEE.
CrossRef - van Mil, H. G., Foegeding, E. A., Windhab, E. J., Perrot, N., & van der Linden, E. (2014). A complex system approach to address world challenges in food and agriculture. Trends in food science & technology, 40(1), 20-32.
CrossRef - Aiello, L. M., Schifanella, R., Quercia, D., & Del Prete, L. (2019). Large-scale and high-resolution analysis of food purchases and health outcomes. EPJ Data Science, 8(1), 14.
CrossRef - Viola, G. C. V., Bianchi, F., Croce, E., & Ceretti, E. (2016). Are food labels effective as a means of health prevention?. Journal of public health research, 5(3).
CrossRef - Ollberding, N. J., Wolf, R. L., & Contento, I. (2011). Food label use and its relation to dietary intake among US adults. Journal of the American Dietetic Association, 111(5), S47-S51.
CrossRef - Norazmir, M. N., Norazlanshah, H., Naqieyah, N., & Anuar, M. K. (2012). Understanding and use of food package nutrition label among educated young adults. Pakistan Journal of Nutrition, 11(10), 836.
CrossRef - Haidar, A., Carey, F. R., Ranjit, N., Archer, N., & Hoelscher, D. (2017). Self-reported use of nutrition labels to make food choices is associated with healthier dietary behaviors in adolescents. Public health nutrition, 20(13), 2329-2339.
CrossRef - Miller, L. M. S., & Cassady, D. L. (2015). The effects of nutrition knowledge on food label use. A review of the literature. Appetite, 92, 207-216.
CrossRef - Sylvetsky, A. C., & Dietz, W. H. (2014). Nutrient-content claims—guidance or cause for confusion. N Engl J Med, 371(3), 195-198.
CrossRef - Jackey, B. A., Cotugna, N., & Orsega-Smith, E. (2017). Food label knowledge, usage and attitudes of older adults. Journal of nutrition in gerontology and geriatrics, 36(1), 31-47.
CrossRef - 101.3 Identity labeling of food in packaged form. Revised as of April 1, 2019.
- Food Allergen Labeling and Consumer Protection Act of 2004 (FALCPA). 2004 August 2,.
- Vierk, K. A., Koehler, K. M., Fein, S. B., & Street, D. A. (2007). Prevalence of self-reported food allergy in American adults and use of food labels. Journal of allergy and clinical immunology, 119(6), 1504-1510.
CrossRef - Nowak-Węgrzyn, A. (2015, May). Food protein-induced enterocolitis syndrome and allergic proctocolitis. In Allergy and asthma proceedings(Vol. 36, No. 3, p. 172). OceanSide Publications.
CrossRef - Cooper, K. M. (2020). The ingredient co-occurrence network of packaged foods distributed in the United States. Journal of Food Composition and Analysis, 86, 103391.
CrossRef - Slavin, J. L. (2015). The challenges of nutrition policymaking. Nutrition Journal, 14(1), 1-7.
CrossRef - Malloy‐Weir, L., & Cooper, M. (2017). Health literacy, literacy, numeracy and nutrition label understanding and use: a scoping review of the literature. Journal of Human Nutrition and Dietetics, 30(3), 309-325.
CrossRef - US Department of Agriculture, Agricultural Research Service. FoodData Central. 2019.
- Csardi, G., & Nepusz, T. (2006). The igraph software package for complex network research. InterJournal, complex systems, 1695(5), 1-9.
- Shannon, P., Markiel, A., Ozier, O., Baliga, N. S., Wang, J. T., Ramage, D., … & Ideker, T. (2003). Cytoscape: a software environment for integrated models of biomolecular interaction networks. Genome Research, 13(11), 2498-2504.
CrossRef - Kretser, A., Murphy, D., & Starke-Reed, P. (2017). A partnership for public health: USDA branded food products database. Journal of Food Composition and Analysis, 64, 10-12.
CrossRef - Capehart T., Olsen D., Feedgrains Sector at a Glance. USDA 2020 February 26.
- Stevens, L. J., Kuczek, T., Burgess, J. R., Hurt, E., & Arnold, L. E. (2011). Dietary sensitivities and ADHD symptoms: thirty-five years of research. Clinical Pediatrics, 50(4), 279-293.
CrossRef - Dewanto, V., Wu, X., Adom, K. K., & Liu, R. H. (2002). Thermal processing enhances the nutritional value of tomatoes by increasing total antioxidant activity. Journal of agricultural and food chemistry, 50(10), 3010-3014.
CrossRef - Poti, J. M., Mendez, M. A., Ng, S. W., & Popkin, B. M. (2015). Is the degree of food processing and convenience linked with the nutritional quality of foods purchased by US households?. The American journal of clinical nutrition, 101(6), 1251-1262.
CrossRef - Monteiro, C. A., Cannon, G., Levy, R., Moubarac, J. C., Jaime, P., Martins, A. P., … & Parra, D. (2016). NOVA. The star shines bright. World Nutrition, 7(1-3), 28-38.
Accepted on: 17 Jul 2021
Second Review by: Reshma Nambiar India
Final Approval by: Dr. Krešimir Mastanjević


Web of Science Coverage
Emerging Sources Citation Index (ESCI)
2024 Journal Impact Factor: 1.1
Scopus Journal Metrics
CiteScore 2025: 2.6
CiteScore Details
Sustainable Nutrition: Food Systems, Nutrient Retention, and Public Health Impact
![]()
This journal is a member of, and subscribes to the principles of, the Committee on Publication Ethics (COPE)


