The Effect of Fortified Dadih (Fermented Buffalo Milk) with Vitamin D3 on Caecum Short Chain Fatty Acids (SCFA) Concentration and HOMA-IR of T2DM-Rats
Rita Arni1
and Kis Djamiatun1, 2* 1Department of Food and Nutrition, Faculty of Medicine, Diponegoro University, Semarang, Indonesia.
2Department of General Medicine, Faculty of Medicine, Diponegoro University, Semarang, Indonesia.
Corresponding Author Email: kisdjamiatun@gmail.com
DOI : http://dx.doi.org/10.12944/CRNFSJ.9.2.13
Download this article as:
![]()
The prevalence of T2DM continues to increase along the years. Probiotics and vitamin D have antidiabetic effects and a synergism between them is evident. Fermented milk such as dadih is a great source of probiotics, specifically lactic acid bacteria (LAB). Probiotics are involved in the formation of short-chain fatty acids (SCFA) which can increase insulin production and improve Homeostasis Model Assessment-Insulin Resistance (HOMA-IR). The objective of this study was to investigate the effect of vitamin D3-fortified dadih on caecum SCFA concentration and HOMA-IR of T2DM-induced Wistar rats. A total of thirty rats were randomly split into five-groups: four diabetic groups (C2, T1, T2, and T3) and one healthy control group (C1). Intervention groups were either given vitamin D3 (T1), unfortified dadih (T2), or vitamin D3-enriched dadih (T3). Concentration of SCFA, glucose, and insulin were measured by gas chromatography, GOD-POD, and ELISA, respectively. T3 group showed significantly lower fasting blood glucose and higher insulin than T1 or T2 at post-intervention. The HOMA-IR index at the end of intervention indicated that T3 was significantly different from T1. Total caecum SCFA and butyrate concentrations were significantly higher in T3 than T1 or T2. The HOMA-IR had an inverse correlation with total caecum SCFA (r=-0.600, p=0.001) and butyrate concentration (r= -0.692, p=0.000). The decreased insulin resistance might be partially attributed to total caecum SCFA and butyrate concentrations. In conclusion, vitamin D3-fortified dadih had better efficacy in improving glycemic status, insulin, and SCFA concentration, leading to improved insulin resistance in T2DM rats.
KEYWORDS:Dadih; HOMA-IR; SCFA; T2DM; Vitamin D3
Introduction
Type 2 Diabetes Mellitus (T2DM) occurs when the pancreas gland is unable to produce and use insulin effectively, thus disrupting the delivery of glucose to body cells and making blood sugar levels increased1. Worldwide prevalence of DM in 2017 was 8.8% and was expected to increase to 9.9% by 20232.The pathogenesis of T2DM might involve intestinal microbiota due to the its potential role in insulin signaling and systemic inflammation amelioration3,4. An imbalance in the number and diversity of microorganisms in the digestive tract are commonly found in people with obesity and T2DM5.
Modulation of intestinal microbiota with probiotics is one approach to achieve balanced intestinal microbiota in order to improve host health. Probiotics can protect humans from infection and disease as well as produce short-chain fatty acids (SCFA) and vitamin6. SCFA subsequently activates intestinal hormones, in particular peptide YY and glucagon-like-peptide-1, to stimulate insulin signaling and proliferation of pancreatic cells3,5. Probiotics are present in traditionally fermented milk such as dadih.
Furthermore, some LAB in dadih are also found in yogurt and curd such as Lactobacillus plantarum and Lactococcus lactis 8–11. Vitamin D and its receptors (VDR) regulate of the diversity and functions of intestinal microbiota, other than their role in energy metabolism balance, immunity, and inflammatory response 12–14. Several studies showed that vitamin D deficiency was associated with the pathogenesis of T2DM. Vitamin D3 in its active form (1α, 25-dihydroxyvitamin D3) affects pancreatic β cells and insulin secretion, and through other mechanisms can affect insulin sensitivity. Probiotics can also increase VDR activity as well as improve 25(OH)D circulation in the body. One study stated that Lactobacillus plantarum increased the expression and activity of VDR 13,15,16. Administration of fermented goat milk fortified with vitamin D3 to T2DM rats was reported to reduce glucose and leukocyte levels, which are both markers of low-grade inflammation17. Fortification of vitamin D3 in dadih is expected to increase vitamin D3 intake and improve the balance of intestinal microbiota so as to improve glycemic status through SCFA therefore making it a possible additional therapy for diabetic patients.
The study aimed to determine the effect of fortified dadih (fermented buffalo milk) with vitamin D3 on caecum Short Chain Fatty Acids (SCFA) concentration and HOMA-IR Of T2DM-Rats.
Materials and Methods
Dadih Preparation
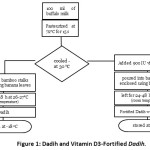 |
Figure 1: Dadih and Vitamin D3-Fortified Dadih. |
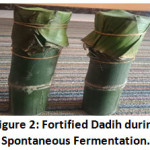 |
Figure 2: Fortified Dadih during Spontaneous Fermentation. |
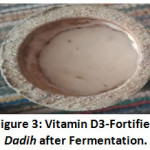 |
Figure 3: Vitamin D3-Fortified Dadih after Fermentation. |
Experimental Procedure
A total of thirty, 8-12 weeks old Wistar rats weighing 150-200 g were allocated to five groups, specifically healthy controls (C1), diabetic controls (C2), and three intervention groups (T1, T2, and T3). Rats were kept in individual cages and fed with standard diet (15 g/day) during the whole experiment, as well as provided ad libitum access to water. Laboratory animal care was performed according to the Guidelines of Laboratory Animal Management from the Central Laboratory of Food and Nutrition Studies, Gadjah Mada University, Yogyakarta.
High fat diet (HFD) was introduced for 14 days and followed by the injection of streptozotocin (STZ) to induce type 2 diabetes in rats. Afterwards, the intervention groups were given a dose of 36IU/200g body weight/day of vitamin D3 (T1), unfortified dadih of 4g/200g body weight/day (T2), and vitamin D3-fortified dadih of 4g/200g body weight/day (T3), respectively, for 28 days. Blood sample and caecum digesta were taken for analysis, with the former collected pre- and post-intervention while the latter only at post-intervention. The entire procedure involved in our study was precedingly ethically approved through certificate no. 140/EC/H/KEPK/FK-UNDIP/X1/2019 released by the Health Research Ethics Committee of Faculty of Medicine Diponegoro University Indonesia.
Serum Insulin Determination
Serum insulin determination was carried out through ELISA-Kit according to manufacturer instructions (Fine Test, Wuhan, China). Briefly, 100µl of standard and serum of each sample was transferred into a well plate, later the plate was sealed and incubated at 37oC for 90 minutes. Afterwards, the plate was rinsed 3 times using wash buffer where the buffer remained in the wells for at least 2 minutes every time. Every well was then filled with 100µl of SABC working solution, before getting sealed and incubated for half an hour at 37oC. Post-incubation rinse was done in a similar manner but for 5 times. TMB substrate at 90µl and 50µl of stop solution were added into each well, and the plate was sealed and incubated at 37oC for 20 minutes in the dark. The colour would immediately turn yellow. The absorbance of samples in well plates was read by ELISA Reader at 450 nm18.
Plasma Glucose Measurement
Plasma glucose levels were measured with GOD-PAP where glucose oxidase (GOD) enzymatically oxidize glucose into gluconic acid. Quinoneimine dye was the chosen colorimetric indicator. Briefly, 10 µl standart and serum of each sample were add into tube. Furthermore, 1000 µl reagen kit of GOD PAD was add into tube, which mixed with vortex and incubated at 20-25 °C for 20 minutes. The sample absorbance was futher read by spectrofotometer at 500 nm19.
HOMA-IR Measurement
The Homeostatic model assessment of insulin resistance (HOMA-IR) as calculated with the following formula:
![]()
where fasting insulin was expressed in IU/mL and fasting plasma glucose in mg/dL)20.
SCFA Analysis
SCFA levels were determined with gas chromatography (SHIMATZU). Approximately 0.05 g of caecal content was acidified with equal amounts of sulphuric acid, and then extraction of SCFA was done by adding 0.6 ml of diethyl ether and putting the sample in a centrifuge for 30 seconds at 14000 rpm. The capillary column (Nukol) of the gas chromatography was equipped with a flame ionization detector and injected with 1 µl of organic phase, with the initial temperature set at 80° C was maintained for 0,5 minutes, the raised to 180 ° C with ramping 8 ° C/minute to be constant for 1 minute. Furthermore, the temperature was increased to the final at 200° C (ramping 20 ° C/minute) and then sustained for 5 minutes. Nitrogen was the carrier gas and calibration curves were set for acetic acid, butyrate, and propionic acid in order to quantify the concentration of those fatty acids in the sample21.
Statistical Analysis
Normally distributed data were expressed as mean ± SD and analysed with One-Way ANOVA followed by Bonferroni post hoc test. Kruskal Wallis test followed by Mann-Whitney-U-test was used as the alternative. The relationship between variables were tested using Spearman’s correlation test. All statistical analyses were done with a statistical software (SPSS 16) with significant differences noted at p <0.05 (95% confidence interval).
Results
Rats’ Weight Changes
Figure 1 presents the weight changes of rats in all groups during the experiment. No significant difference was observed amongst groups at the inclusion (p> 0.05). The body weight of the rats changed during T2DM induction by HFD and STZ-NA. There was an increase of body weight (rat-BW) during HFD period in C2, T1, T2 and T3 (the groups had p = 0.000, ANOVA; Fig. 4). This significant difference was confirmed by the analysis of the changes (Δ) of rat-BW between C2, T1, T2 and T3 compared with C1 (p<0,05; Fig.4). Although HFD induced an increase of BW in T2DM groups, STZ-NA injection resulted in a significantly lower BW of T2DM groups (C2, T1, T2,T3) than C1 (p< 0.05). After the intervention, all intervention groups (T1, T2, T3) showed significantly higher BW than C2 and no differences in comparison to C1. Δ BW in C1 was not significantly different than any intervention groups (p>0,05; Fig.4). Vitamin D3, dadih, and vitamin D3-fortified dadih treatments significantly caused weight gain in T1, T2 and T3.
Fasting Blood Glucose, Serum Insulin, and HOMA-IR
T2DM induction resulted in elevated serum fasting blood glucose (FBG) (>250 mg/dL) in C2, T1, T2 and T3. No difference was found among those groups (p>0.05; Fig 5.A). After the treatment, the FBG levels of T1, T2 and T3 groups were significantly lower than C2, almost at the same level of those in C1 (p< 0.05; Fig 5.B). Post-intervention FBG levels of T3 were considerably lower in comparison to T1 (p=0.000; Fig 5.B). In addition, Δ FBG level of T3 was notably lower than other intervention groups (p =0.004 and p= 0.037; Fig 5.C).
All diabetic groups showed noticeably lower insulin levels than the healthy C1 group at pre-intervention period. In contrast, measurement at post-intervention revealed that all intervention groups had notably higher insulin levels than C2. T3 exhibited considerably higher insulin levels compared to both T1 and T2. All intervention groups showed significantly lower insulin levels than healthy C1 group at post-intervention. The findings of the Δ insulin level analysis were in line with the insulin level at post-intervention.
Before the intervention, HOMA-IR of all diabetic rat groups were found to be notably higher than the healthy controls. However, no difference was observed among C2, T1, T2, and T3 groups. At the end of the intervention, HOMA-IR of all intervention groups were significantly lower than C2. T1 group showed significantly higher post-intervention HOMA-IR in comparison to the other intervention groups, while no difference was found between the latter two intervention groups. Most of Δ HOMA-IR analysis supported the findings of the HOMA-IR at post-intervention.
The Effect of Fortified Dadih on Caecum SCFA
The post-intervention caecum total SCFA, acetate, propionate and butyrate concentrations were significantly different among groups (p=0.002, p=0.001, p=0.0001 and p=0.0001, respectively; Table 1). T3 group, in particular, had significantly higher concentrations in comparison to C2 and the other intervention groups. Additionally, no difference was observed between T3 and the healthy C1 group. Those of the T1 and T2 groups were also not considerably different than C2. T3 group showed noticeably higher levels of caecum acetate and propionate in contrast to C2, but no difference was observed with C1. On the other hand, those of T1 and T2 groups were difficult to interpret due to the lack of difference found in caecum acetate and propionate levels when compared to the C2 or C1 groups. Interestingly, all analyses of butyrate levels were in favour of the total SCFA levels.
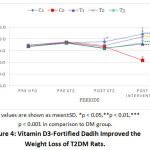 |
Figure 4: Vitamin D3-Fortified Dadih Improved the Weight Loss of T2DM Rats. |
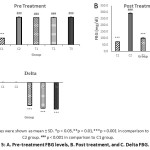 |
Figure 5: A. Pre-treatment FBG levels, B. Post treatment, and C. Delta FBG. |
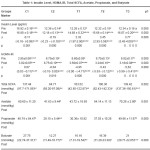 |
Table 1: Insulin Level, HOMA-IR, Total SCFA, Acetate, Propionate, and Butyrate. |
Post-intervention correlation test on all variables revealed a significantly inverse correlation (Table 2). Total SCFA appeared to be strongly correlated to HOMA-IR index (r=-0,600; p=0,001; Table 2). Likewise, a similar relationship was also observed between butyrate and HOMA-IR index (r=-0,692; p=0,000; Table 2).
Table 2: Correlation Between SCFA Concentration and HOMA-IR Levels after Vitamin D3-Fortified Dadih Intervention.
| HOMA-IR | ||
| r | p | |
| Total SCFA | -0,600 | 0,001* |
| Acetate | -0,477 | 0,008 |
| Propionat | -0,518 | 0,003 |
| Butyrate | -0,692 | 0,000* |
0.00-0.25 = very weakly correlated
0.25-0.50 = weakly correlated
0.50-0.75 = moderately correlated
0.75-0.99 = strongly correlated
Discussion
The interventions used in this present study were expected to influence the BW of T2DM rats, because their protective effects might target the mechanisms related to BW. The weight loss in diabetic rats induced with HFD-STZ experience was in fact countered by the interventions as giving vitamin D3-fortified dadih apparently caused an increase of BW in T2DM-rats (Figure 4). The same effect was also observed in groups given either dadih or vitamin D3. The weight gain occurred was not different among treatment groups and they all managed to return the BW of T2DM-rats to normal.
HFD and STZ were used in induce T2DM in rats. HFD increases weight and size of adipocytes22,23. It also increases oxidative stress which causes various conditions that result in T2DM, including compromised glucose tolerance, insulin resistance, pancreatic β-cell damage, and dyslipidemia24,25. Reactive oxygen species produced during oxidative stress causes insulin resistance in peripheral tissues due to decreased expression of GLUT4 transporters in cellular membranes26. HFD-induced weight gain is associated with intestinal colonization of gram-negative bacteria, causing lipopolysaccharide (LPS) levels to rise. High levels of LPS triggers the secretion of proinflammatory cytokines, further aggravating insulin resistance27. Weight loss in diabetic rats induced with HFD-STZ was attributed to lipolysis and proteolysis processes as a result of insulin resistance, leading to decreased muscle mass and adipose tissue volume28. Significant weight loss was also found in rats induced by STZ at 45 mg/ kg, as reported by Asiltas et al29. Three types of intervention were used in this study: vitamin D3, dadih, and vitamin D3-fortified dadih and no difference was found among the three in their effect towards BW of T2DM rats. All interventions proved to positively affect BW, possibly due to restored pancreatic β cells that consequently means improved insulin production. Increased insulin secretion inhibits the lipolysis and fatty acid oxidation thus resulting in weight gain30,31.
Vitamin D3-fortified dadih proved to have more prominent effects than the single interventions (either dadih or vitamin D3) as shown by the significantly higher insulin levels (Table 1) and improved glycemic status of T2DM-rats (Figure 5). Vitamin D in its form as 1,25 (OH)D2 has an important role in insulin secretion because it activates insulin gene transcription in humans. It also activates VDR in the pancreas gland and increases the expression of 1α-hydroxylase. Calcitriol or active vitamin D metabolites is known to stimulate insulin gene transcription in humans as well35. HOMA-IR in this present study was only partially in line with the findings of insulin and FBG. HOMA-IR is calculated based on both FBG and insulin levels, therefore the measurement of biomarkers in insulin signalling, including GLUT1 and GLUT4, needs to be performed to re-confirm the results in this study.
Furthermore, giving vitamin D3-fortified dadih appeared to be more effective in elevating concentrations of caecum total SCFA and butyrate in comparison to its single intervention. These findings are supported by a previous study where consumption of yoghurt fortified with 2000 IU of vitamin D for 12 weeks significantly increased fasting serum insulin in menopausal T2DM patients37. Increased insulin after the intervention was mediated by raised SCFA concentrations in the caecum. SCFA is an important energy source for de novo lipogenesis and ligands for FFAR2 and FFAR3 in intestinal enteroendocrine cells38. SCFA reduces insulin resistance and promotes proliferation and development of pancreatic cells by activating the receptors. SCFA produced by intestinal microbiota and other bacteria during food matrix fermentation has many beneficial effects. Production of SCFA in the large intestine inhibits the growth of pathogenic bacteria through lowering local pH. SCFA has several functions, namely regulating the metabolism of lipid and glucose, lessening risks of inflammatory diseases, and promoting antioxidant functions. In addition, SCFA positively influences host metabolism39. SCFA increases insulin production, lowers the production of pancreatic glucagon, and reduces liver gluconeogenesis through increased AMPK activity. AMPK is an enzyme that functions in energy metabolism. Activation of AMPK stimulates glucose transporter (GLUT4) on cell membrane so that it will raise glucose uptake by muscles and adipocytes40. Butyrate plays an essential part in the development of diabetes and obesity. It can stimulate pancreatic beta cells through incretin. Numerous studies have reported the beneficial impacts of butyrate for diabetic or obese subjects. A notable increase of plasma insulin was observed in mice orally fed with sodium butyrate. Another animal study reported improved insulin sensitivity and decreased adiposity in C57BL/6 mice after given butyrate supplementation, successfully preventing insulin resistance despite being previously treated with high-fat diet. A similar study with high-fat diet-fed mice found an association of increased butyric production by microbiota, lowered blood glucose, suppressed weight gain, and ameliorated insulin resistance with the administration of VSL probiotic #34. The inverse moderate correlation between SCFA concentration and HOMA-IR was found in this present study (Table 2), implying that somehow SCFA contributed in lowering HOMA-IR in T2DM subjects, also supported by the studies mentioned earlier. Although HOMA-IR index of vitamin D3-fortified dadih group was not significantly different than the dadih only group, it was still lower than the latter. Additionally, the average total SCFA, acetate, propionate and butyrate concentrations of vitamin D3-fortified dadih group was higher compared to other groups. It is concluded that vitamin D3-fortified dadih proved to significantly reduce the FGB and HOMA-IR index and increase insulin and SCFA.
Conclusion
This study concluds that vitamin D3 fortified dadih can improve glycemic status, increase insulin levels and improve insulin resistance in T2DM-induced Wistar rats through increasing concentrations of total SCFA and Butyrate. The strong inverse correlation between HOMA-IR and Total SCFA and butyrate indicated that increases in total SCFA and butyrate are associated with improved insulin sensitivity.
Acknowledgment
The author received a scholarship from the Human Resources Quality Improvement Agency of the Ministry of Health of the Republic of Indonesia.
Conflict of Interest
The authors declare no conflict of interest.
References
- World Health Organization. Global Report.; 2016.
- International Diabetic Federation Diabetes. Atlas. 7th ed.; 2015.
- Baothman OA, Zamzami MA, Taher I, Abubaker J, Abu-Farha M. The role of gut microbiota in the development of obesity and diabetes. Lipids Health Dis. 2016;15(1):108-116.
CrossRef - Yadav H, Lee J-H, Lloyd J, Walter P, Rane SG. Beneficial Metabolic Effects of a Probiotic via Butyrate-induced GLP-1 Hormone Secretion. J Biol Chem. 2013;288(35):25088-25097.
CrossRef - Purwanta MLA, Dewi NPAPA, Saraswati MR. Probiotics for type 2 diabetes mellitus: an anti-diabetic intervention to see beyond the gut. Indonesia Journal of Biomedical Science. 2017;11(2):11.
CrossRef - Umu ÖCO, Rudi K, Diep DB. Modulation of the gut microbiota by prebiotic fibres and bacteriocins. Microb Ecol Health Dis. 2017;28(1):1-12.
CrossRef - Wirawati CU, Sudarwanto MB, Lukman DW, Wientarsih I, Srihanto EA. Diversity of lactic acid bacteria in dadih produced by either back-slopping or spontaneous fermentation from two different regions of West Sumatra, Indonesia. Vet World. 2019;12(6):823-829.
CrossRef - Balamurugan R, Chandragunasekaran AS, Chellappan G, Rajaram K, Ramamoorthi G, Ramakrishna BS. Probiotic potential of lactic acid bacteria present in home made curd in southern India. Indian J Med Res. 2014;140(3):345-355.
- Song AA-L, In LLA, Lim SHE, Rahim RA. A review on Lactococcus lactis: from food to factory. Microb Cell Fact. 2017;16(1):55.
CrossRef - Sharma C, Singh BP, Thakur N, et al. Antibacterial effects of Lactobacillus isolates of curd and human milk origin against food-borne and human pathogens. 3 Biotech. 2017;7(1):31.
CrossRef - Jung J, Kim S, Lee JY, Yoon S, You S, Kim SH. Multifunctional properties of Lactobacillus plantarum strains WiKim83 and WiKim87 as a starter culture for fermented food. Food Sci Nutr. 2019;7(8):2505-2516.
CrossRef - Fondjo LA, Sakyi SA, Owiredu WKBA, et al. Evaluating Vitamin D Status in Pre- and Postmenopausal Type 2 Diabetics and Its Association with Glucose Homeostasis. BioMed Research International. 2018;2018:1-12.
CrossRef - Shang M, Sun J. Vitamin D/VDR, Probiotics, and Gastrointestinal Diseases. CMC. 2017;24(9):876-887.
CrossRef - Clark A, Mach N. Role of vitamin D in the hygiene hypothesis: the interplay between vitamin D, vitamin D receptors, gut microbiota, and immune response. Front Immunol. 2016;7:627-639.
CrossRef - Jones ML, Martoni CJ, Prakash S. Oral Supplementation With Probiotic reuteri NCIMB 30242 Increases Mean Circulating 25-Hydroxyvitamin D: A Post Hoc Analysis of a Randomized Controlled Trial. The Journal of Clinical Endocrinology & Metabolism. 2013;98(7):2944-2951.
CrossRef - Yoon S, Wu S, Zhang Y, et al. Probiotic Regulation of Vitamin D Receptor in Intestinal Inflammation. Gastroenterology. 2011;140(5):S-19.
CrossRef - Marlina R, Panunggal B, Anjani G. The effect of fermented goat milk (kefir) fortified with vitamin D 3 on total leukocyte levels in diabetic Rattus norvegicus NFS. 2019;50(2):324-332.
CrossRef - Fine Test. Mouse INS (Insulin) Elisa Kit.
- Diasys Diagnostic Systems Jermany. Glucose GOD FS*. Published online November 2015.
- Placzkowska S, Pawlik-Sobecka L, Kokot I, Piwowar A. Indirect insulin resistance detection: Current clinical trends and laboratory limitations. Biomed Pap Med Fac Univ Palacky Olomouc Czech Repub. 2019;163(3):187-199.
CrossRef - Huazano-Garcia A, G. M. Metabolism of Short Chain Fatty Acids in the Colon and Faeces of Mice After a Supplementation of Diets with Agave Fructans. In: Valenzuela Baez R, ed. Lipid Metabolism. ; 2013.
CrossRef - Ji S, Wang L, Li L. Effect of Metformin on Short-Term High-Fat Diet-Induced Weight Gain and Anxiety-Like Behavior and the Gut Microbiota. Front Endocrinol. 2019;10:704.
CrossRef - Guo X, Wang Y, Wang K, Ji B, Zhou F. Stability of a type 2 diabetes rat model induced by high-fat diet feeding with low-dose streptozotocin injection. J Zhejiang Univ Sci B. 2018;19(7):559-569.
CrossRef - Tangvarasittichai S. Oxidative stress, insulin resistance, dyslipidemia and type 2 diabetes mellitus. WJD. 2015;6(3):456.
CrossRef - Du Z, Yang Y, Hu Y, et al. A long-term high-fat diet increases oxidative stress, mitochondrial damage and apoptosis in the inner ear of d-galactose-induced aging rats. Hearing Research. 2012;287(1-2):15-24.
CrossRef - Hurrle S, Hsu WH. The etiology of oxidative stress in insulin resistance. Biomedical Journal. 2017;40(5):257-262.
CrossRef - Puddu A, Sanguineti R, Montecucco F, Viviani GL. Evidence for the Gut Microbiota Short-Chain Fatty Acids as Key Pathophysiological Molecules Improving Diabetes. Mediators of Inflammation. 2014;2014:1-9.
CrossRef - Magalhães DAD, Kume WT, Correia FS, et al. High-fat diet and streptozotocin in the induction of type 2 diabetes mellitus: a new proposal. An Acad Bras Ciênc. 2019;91(1):e20180314.
CrossRef - Mestry SN, Dhodi JB, Kumbhar SB, Juvekar AR. Attenuation of diabetic nephropathy in streptozotocin-induced diabetic rats by Punica granatum Linn. leaves extract. Journal of Traditional and Complementary Medicine. 2017;7(3):273-280.
CrossRef - Arner P, Andersson DP, Bäckdahl J, Dahlman I, Rydén M. Weight Gain and Impaired Glucose Metabolism in Women Are Predicted by Inefficient Subcutaneous Fat Cell Lipolysis. Cell Metabolism. 2018;28(1):45-54.e3.
CrossRef - Erion KA, Corkey BE. Hyperinsulinemia: a Cause of Obesity? Curr Obes Rep. 2017;6(2):178-186.
CrossRef - Zhang Q, Wu Y, Fei X. Effect of probiotics on glucose metabolism in patients with type 2 diabetes mellitus: A meta-analysis of randomized controlled trials. Medicina. 2016;52(1):28-34.
CrossRef - Khalili L, Department of Nutrition, Faculty of Nutrition and Food Sciences, Tabriz University of Medical Sciences, Tabriz, Iran, Alipour B, et al. The Effects of Lactobacillus casei on Glycemic Response, Serum Sirtuin1 and Fetuin-A Levels in Patients with Type 2 Diabetes Mellitus: A Randomized Controlled Trial. ibj. 2019;23(1):68-77.
CrossRef - Andreasen AS, Larsen N, Pedersen-Skovsgaard T, et al. Effects of Lactobacillus acidophilus NCFM on insulin sensitivity and the systemic inflammatory response in human subjects. Br J Nutr. 2010;104(12):1831-1838.
CrossRef - Al-Shoumer KA. Is there a relationship between vitamin D with insulin resistance and diabetes mellitus? WJD. 2015;6(8):1057.
CrossRef - Sung C-C, Liao M-T, Lu K-C, Wu C-C. Role of Vitamin D in Insulin Resistance. Journal of Biomedicine and Biotechnology. 2012;2012:1-11.
CrossRef - Jafari T, Faghihimani E, Feizi A, et al. Effects of vitamin D-fortified low fat yogurt on glycemic status, anthropometric indexes, inflammation, and bone turnover in diabetic postmenopausal women: A randomised controlled clinical trial. Clinical Nutrition. 2016;35(1):67-76.
CrossRef - Kobyliak N, Falalyeyeva T, Mykhalchyshyn G, Kyriienko D, Komissarenko I. Effect of alive probiotic on insulin resistance in type 2 diabetes patients: Randomized clinical trial. Diabetes & Metabolic Syndrome: Clinical Research & Reviews. 2018;12(5):617-624.
CrossRef - Carvalho NM de, Costa EM, Silva S, Pimentel L, Fernandes TH, Pintado ME. Fermented Foods and Beverages in Human Diet and Their Influence on Gut Microbiota and Health. Fermentation. 2018;4(4):90.
CrossRef - den Besten G, van Eunen K, Groen AK, Venema K, Reijngoud D-J, Bakker BM. The role of short-chain fatty acids in the interplay between diet, gut microbiota, and host energy metabolism. J Lipid Res. 2013;54(9):2325-2340.
CrossRef
Accepted on: 27 Feb 2021
Second Review by: Tanmay Hazra
Final Approval by: Dr. Pasquale Russo


Web of Science Coverage
Emerging Sources Citation Index (ESCI)
2024 Journal Impact Factor: 1.1
Scopus Journal Metrics
CiteScore 2025: 2.6
CiteScore Details
Sustainable Nutrition: Food Systems, Nutrient Retention, and Public Health Impact
![]()
This journal is a member of, and subscribes to the principles of, the Committee on Publication Ethics (COPE)


