Quality Improvement of Cakes with Buckwheat Flour, and its Comparison with Local Branded Cakes
Tasnim Farzana1*
, Fahiza Bisrat Hossain1, Sadia Afrin1 and Shaikh Shahinur Rahman2 1Institute of Food Science and Technology (IFST), Bangladesh Council of Scientific and Industrial Research (BCSIR), Dhaka, Bangladesh.
2Department of Applied Nutrition and Food Technology, Islamic University, Kushtia, Bangladesh.
Corresponding Author Email: triptiot@yahoo.com
DOI : http://dx.doi.org/10.12944/CRNFSJ.9.2.20
Download this article as:
![]()
Buckwheat is one of the potential food ingredients for the functional food industry. A growing trend for consumer demand highlights the need for the development of composite flour-based bakery products like cookies and cakes. The aim of this study was to analysis the nutrient composition, and microbiological safety examination of buckwheat fortified cakes (BFC), as well as comparative evaluation with locally available branded cakes (LBC). BFC was prepared with the incorporation of 10, 20, 30, and 40% buckwheat flour in wheat flour to measure the quality and acceptability of cakes. As the concentration of buckwheat flour was increased up to 30%, BFC got the best quality, and high sensorial acceptability score evaluated by skilled panelists. BFC had the highest protein, fat, fiber, and micronutrients than all other LBC. No significant (P<0.05) changes were found in sensory tests of the tested cakes. On the basis of microbiological point of view, BFC was found acceptable up to 09 days. Therefore, cake prepared with the incorporation of 30% buckwheat in wheat flour is nutritionally more acceptable than other cakes available in Bangladesh.
KEYWORDS:Buckwheat; Cake; Microbial; Nutritional; Sensory Analysis
Introduction
Buckwheat (Fagopyrum esculentum Moench) is traditionally used in Asia and Europe. It can be a major part of our daily diet due to its potential food ingredient, especially for the functional and clinical food industry1. Buckwheat flour is abundant in some nutrients (per 100 g) such as protein (12.0 g), non-fibrous carbohydrate (69.6 g), dietary fiber (4.3 g), vitamins and minerals, as compared with other cereals such rice and wheat. It also contains relatively less amount of lipid (3.1 g).2 The protein of buckwheat flour consists of albumin (18.2%), globulin (43.3%), prolamin (0.8%), glutelin (22.7%), and very little or no gluten.3 Therefore, buckwheat may have a beneficial effect on various metabolic disorders like diabetes, coeliac disease, and so on that are closely associated with the gluten-free diet.4 Traditionally, the use of buckwheat through incorporating with wheat flour has increased due to its nutritional and physiological excellence. But, ingestion of insufficiently cooked buckwheat products can lead to diarrhea.5 Nowadays the consumer demand is increasing for ready-to-eat snacks, cookies, and the development of other composite flour bakery products. Previous study have focused on the incorporation of buckwheat into biscuits,6 bread,7 noodles,8 spaghetti,9 and the development of multi-functional products to improve food quality. Therefore, the objectives of this study were to formulate a cake with the incorporation of different percentage of buckwheat flour in wheat flour and evaluate their physicochemical, microbial, and sensory properties with the cakes locally available in Bangladesh.
Methods and Materials
Sample Collection
Cakes and raw materials such buckwheat flour, wheat flour, sugar, salt, dry yeast, egg, etc. were collected from the groceries of Bangladesh. Pure cultures of the test organisms and culture media were obtained from Bangladesh Council of Scientific & Industrial Research (BCSIR), Bangladesh. All the chemicals and reagents were of analytical grade (Sigma Aldrich).
Product Development
The experimental cakes were formulated by slightly modifying the AACC method No. 10-91.10 The control and experimental cakes were made by adding wheat flour as well as the incorporation of buckwheat flour (BWF) at different concentrations viz. 0% (B0), 10% (B10), 20% (B20), 30% (B30), and 40% (B40). Sugar, fat, and other ingredients were constant for all cakes per 100 g flour basis. The shortening, sugar, and other dry ingredients were gently mixed with water through a mixer bowl, followed by the dough was poured into a round cake pan (2 cm height x 2 cm diameter) and baked at 170-180°C for 20-30 min. All experiments were carried out in triplicates, and cakes were allowed to cool at room temperature (20°C to 25°C) for 8-10 min.
Proximate Macro Nutrient Analysis of Buckwheat Cakes, and Locally Available Cakes
The macronutrient contents (i.e., moisture, carbohydrate, protein, fat, fiber, ash) of the experimental and branded cakes were analyzed by following the AOAC (2005) method.11 The total energy value was estimated by taking the sum of their respective energy values of carbohydrate, protein, and fat.12
Minerals Analysis of Buckwheat Cake
Sodium, potassium and calcium contents were determined using flame photometer.13,14 The standard solutions were prepared by dilution of the appropriate amounts of each mineral (0.5 ppm, 1 ppm, 2 ppm, 4 ppm, 6ppm, 8 ppm and 10 ppm) from the stock solutions (1000 ppm). In this method, about 2g of sample was taken in a crucible for drying followed by burning in a muffle furnace at 550-600°C to obtain greyish ash. After cooling, the ashes were dissolved in conc. HCL (3 ml) and were evaporated to dryness at a low temperature on the water bath. The remaining contents of crucible were further washed with de ionized water several times to evaporate until the liquid turns colorless. The solution was then filtered with ashless filter paper and was made up to 100 ml by de ionized water. Aliquots of this solution were used as working solution to determine Sodium, potassium and calcium. (Fe) was determined by AOAC method15 using Flame Atomic Absorption Spectrometer.
Sensory Analysis
The standard method for sensory analysis is a nine-point hedonic-scale scorecard (9= like extremely, 8= like very much, 7= like moderately, 6= like slightly, 5= neither like or dislike, 4= dislike slightly, 3= dislike moderately, 2= dislike very much, 1= dislike extremely).16 An expert panel, consisted of 10 trained members (aged between 33-45 years old from Bangladesh Council of Scientific & Industrial Research (BCSIR), Bangladesh) participated to evaluate the sensory attributes of the cakes like appearance, color, texture, flavor, taste, mouthfeel, and overall acceptability.
Microbial Quality Analysis
Microbial quality analysis of this ready–eat cake was performed following the procedure of the Bacteriological Analytical Manual.17,18 Sample (25 g) was aseptically weighed and properly enriched with 250 ml of sterile Buffer Peptone Water (Hi-Media, India). For total viable count (TVC) an aliquot (1 ml) of the sample was diluted in 9 ml buffered peptone water, thus placed on plate count agar (Hi-Media, India) and incubate at 37°C for 24 h. After the incubation period, the number of colonies was observed and reported as log CFU/g. For Coliforms and E. coli most probable number (MPN) test was carried out with Lauryl sulfate tryptose broth (Hi-Media, India), EC broth, and Brilliant green lactose bile broth (Hi-Media, India) on a screw cap tube. The most probable number of coliforms per milliliter or gram of sample was calculated from the number of tubes showing gas formation. A table for the determination of most probable numbers was used according to Feng et al., (2013).19 Yeast and Mold counts were determined by spreading the plating method with Dichloran Rose Bengal Chloramphenicol (DRBC) and Dichloran 18% Glycerol (DG18) agar media. The plates were incubated at 37°C for 5-7 days. Numbers of CFU were counted and reported as log CFU/g. Prevalence of Bacillus sp. in cake sample were determined by following Maroua et al., (2018).20 Determination of Salmonella sp. was carried out according to Saila et al., (2017).21 All the analyses were conducted in triplicates.
Statistical Analysis
Data analysis was done using SPSS software (version 15.0, SPSS Inc. Chicago, Illinois, USA), and values were presented as a percentage and mean ± standard deviation. Significance tests were done by following the one-way ANOVA method. Means were separated using a t-test. Triplicate data were used to analyze these results.
Results and Discussion
Nutrient Analysis of Buckwheat Fortified Cake (BFC)
The proximate nutrient composition of cakes in the control group (without buckwheat flour) and the cakes prepared with different percentages of buckwheat flour (B10, B20, B30, and B40) is shown in Table 1. The moisture content of the cakes fortified with buckwheat (BFC) was reduced (11.5% to 7.3%) with the increment of buckwheat flour (BF). Puwani et al. (2006) reported lower moisture content (6.3–10.9%) enhances the product’s shelf-life during storage by inhibiting the microbial growth and chemical reactions in foods.22 The amount of carbohydrate was lower in BFC than the cake without buckwheat (B0). Non-digestible starch like resistant starch, β-glucans, oligosaccharides, and chitin present in the buckwheat might reduce the carbohydrate content.23 Addition of BF to cake also significantly (p<0.05) increased the nutritive values of fiber, protein, fat, ash, calcium, and iron. Amounts of protein, fat, and fiber in BFC ranged from 11.9-15.3%, 36.4-41.2%, and 0.3-0.4%, respectively. According to Maeda et al. (2004), buckwheat protein is an excellent supplement for cereal grains due to having a high biological value of amino acids.24 Energy values among the cakes did not differ significantly. However, minerals contents were simultaneously increased (P < 0.05) with the augmentation of BF in the cake (Table 1). These trends were also proposed by other studies for the buckwheat flour products like bread,25 biscuit,26 and noodles.6 Data in Table 1 showed that BFC prepared with 30% (B30), and 40% (B40) buckwheat flour was nutritionally better (P < 0.001) than the cake made with only wheat flour (B0).
Table 1: Nutritive Value of Buckwheat Fortified Cakes (per 100 g).
| Nutrients | B0 | B10 | B20 | B30 | B40 |
| Moisture (%) | 11.53±0.55 | 10.40a±0.72 | 9.42a**±0.45 | 8.33a**±0.69 | 7.26a**±0.39 |
| Carbohydrate (g) |
41.9±0.88 | 40.06a±1.17 | 38.12a*±0.96 | 36.63a**±0.45 | 34.67a**±0.72 |
| Protein (g) | 10.62±0.75 | 11.92b±0.61 | 13.12b*±0.51 | 14.06b**±0.68 | 15.26b**±0.51 |
| Fat (g) | 34.85±0.57 | 36.35b±0.58 | 37.95b*±1.07 | 39.45b**±0.77 | 41.15b**±0.59 |
| Fiber (g) | 0.27±0.01 | 0.32b*±0.02 | 0.35b**±0.01 | 0.38b**±0.01 | 0.41b**±0.02 |
| Ash (g) | 0.83±0.02 | 0.95b±0.03 | 1.04b*±0.04 | 1.15b**±0.06 | 1.25b**±0.07 |
| Sucrose (g) | 21.16±0.52 | 21.52b*±0.49 | 21.43b±0.57 | 21.34b±0.23 | 21.28b±0.27 |
| Energy (kcal) | 523.73±1.67 | 535.07b±1.68 | 546.51b±0.76 | 557.81b±0.85 | 570.07b*±1.18 |
| Sodium (mg) | 120.1±0.61 | 121.5b±0.51 | 122.9b±0.69 | 124.42b*±0.54 | 125.92b*±0.58 |
| Potassium (mg) | 200.03±1.37 | 224.20b±1.34 | 247.17b±1.68 | 271.13b*±0.94 | 295.79b*±0.78 |
| Calcium (mg) | 25.21±0.65 | 26.56b±0.75 | 27.62b±0.45 | 28.77b*±0.66 | 29.82b*±0.69 |
| Iron (mg) | 3.61±0.01 | 4.09b±0.11 | 4.59b*±0.04 | 5.09b**±0.04 | 5.59b**±0.05 |
Here, B0, B10, B20, B30, B40 indicates 0, 10, 20, 30, and 40% buckwheat mixed with wheat flour respectively. Values are means of triplicates ± standard deviation.
Superscript ‘a’ and ‘b’ in a row indicates lower & higher values respectively and were compared with that of B0 (control).
* indicates significantly different (P <0.05) and **indicates highly significant (P <0.001) as determined by Duncan’s multiple range test.
Sensory Evaluation of BFC
Sensory evaluation is one of the best tools among consumers to judge the product final acceptance. Sensory attributes of BFC are shown in Table 2. The color and appearance of the product make the first impression in the consumer’s mind to select ones. The mean score for color and for BFC ranged from 8.82 to 8.13. The control cake (B0) showed the highest score, and the lowest score was found in B40. The mean score of BFC was reduced with the increment of BF which contains dark color.27
Table 2: Sensory Properties of BFCs.
| B0 | B10 | B20 | B30 | B40 | |
| Color and appearance | 8.82a±0.02 | 8.69a±0.04 | 8.62a±0.02 | 8.47a±0.01 | 8.13a±0.02 |
| Texture | 8.81a±0.01 | 8.64a±0.03 | 8.38a±0.01 | 8.32a±0.01 | 7.78b±0.01 |
| Flavor | 7.82a±0.01 | 7.93a±0.01 | 8.07a±0.02 | 8.18b±0.02 | 8.29b±0.03 |
| Taste | 8.05a±0.02 | 8.18a±0.03 | 8.86b±0.03 | 8.47b±0.02 | 7.9a±0.02 |
| Overall acceptance | 8.40a±0.01 | 8.02b±0.03 | 8.13a±0.03 | 8.36a±0.01 | 7.92b±0.04 |
Values are means of six panelist’s ± standard deviation. Values with the same superscript in a row are not significantly different (P <0.05).
The texture is another important sensory attribute that indicates the feel of an interior part as softness or hardness of the product. In our study, the textural properties of improved with the increasing amount of BF. The mean score of B0, B10, B20, B30, and B40 were found 8.81, 8.64, 8.38, 8.32, and 7.78 respectively. The texture of BFC up to 30% addition of BF was not significantly (P <0.05) different from the cake made without BF.
Flavor and taste determine the acceptability and market success of the product. This study showed that flavor and taste had the lowest score for the control cake (B0), and gradually increased with the addition of an increasing amount of BF. The symmetry and evenness of the cake depend on the strength of gluten that forms a network and retains homogeneous vapor production during baking.25 As BF contains lower gluten content, BFC developed a lower innermost network and uniformity than B0 .
The overall acceptability for B0 (8.40), and B30 (8.36) did not differ significantly and showed a higher mean score as compared to B10 (8.02), B20 (8.13), and B40 (7.92). Based on all the sensory attributes, BFC formulated with 30% buckwheat flour (B30) was the best, and above this level, the sensory score was lower, as shown in Table 2.
Microbial Analysis
According to WHO s (1994) the maximum permissible limits in baked products (cake, bread, biscuit and others) for total aerobic bacteria count are 2.0×10⁵ cfu/g, coliform bacteria <200 MPN/g, E. coli absent, yeast and mold is <1.0×10³ cfu/g.28 Furthermore, good manufacturing practice (GMP) guidelines also comply with the WHO guideline.29 However, the microbial load of the experimental cake was assessed up to 10 days. The findings demonstrated that the total aerobic bacteria count was within the acceptable limit up to 09 days. Moreover yeast and mold counts were found to be within WHO limits, whereas Coliform, E. coli, Bacillus sp. and Salmonella sp. were absent in the tested cake sample (Table 3 and Fig. 1). After 09 days, the microorganisms were , and the product quality became deteriorating.
Table 3: Microbiological Quality Evaluation of Buckwheat Cake.
| Microorganisms | 0 days | 3 days | 5 days | 7 days | 9 days | 10 days |
| Total aerobic bacteria, cfu/g | 2.9×10² | 3.4×10² | 3.9×10² | 4.7×10³ | 6. 2×10⁴ | 9. 4×10⁵ |
| Total Coliforms, MPN/g | <0.3** | <0.3** | <0.3** | <0.3** | <0.3** | <0.3** |
| Escherichia coli, MPN/g | <0.3** | <0.3** | <0.3** | <0.3** | <0.3** | <0.3** |
| Yeasts and Molds, cfu/g | <10* | <10* | <10* | <10* | 3.0×10² | 5.0×10³ |
| Bacillus cereus,/g | Absent | Absent | Absent | Absent | Absent | Absent |
| Salmonella sp. /25g | Absent | Absent | Absent | Absent | Absent | Absent |
* <10 indicate absence of test organisms in 1g of sample.
** As per MPN (most probable number) chart, MPN <0.3 indicates absence of test organism in 1g.
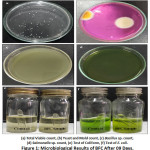 |
Figure 1: Microbiological Results of BFC After 09 Days. |
Comparison of Buckwheat Fortified Cake (B30) with Locally Available Branded Cakes in Bangladesh.
This study also compared the experimental BFC (B30) with the cakes (made with wheat flour) available in the market, as shown in Table 4. The moisture content of the local branded cakes (LBC) was found 13.66 to 20.14%, whereas B30 showed the lowest one (8.33%). The high percentage of moisture inspire microbial growth and also declines food quality.22 This may be explained as a better shelf-life of B30. The lowest carbohydrate content was also found in B30 (36.63%) which indicates a good choice for diabetic, and obese persons.
Table 4: Comparative Macronutrient Analysis of BFC (B30) with Locally Available Branded Cakes in Bangladesh (per 100 g).
| Nutrients | C1 | C2 | C3 | C4 | C5 | C6 | C7 | C8 | B30 |
| Moisture | 13.66h | 20.14a | 18.88b | 17.29e | 17.50d | 18.10c | 14.00g | 15.95f | 8.33i |
| Carbohydrate | 50.02b | 43.49g | 49.16e | 49.78d | 49.90c | 45.63f | 52.81a | 49.78d | 36.63h |
| Sucrose | 17.71i | 17.75h | 19.97g | 22.81b | 20.81d | 20.65e | 23.93a | 20.03f | 21.34c |
| Protein | 6.38i | 6.40h | 7.52f | 7.34g | 7.97e | 9.41b | 8.54c | 8.05d | 14.06a |
| Fat | 29.28c | 29.38b | 22.02i | 24.88f | 23.89h | 26.27d | 23.93g | 26.08e | 39.45a |
| Ash | 0.64f | 0.57g | 0.70c | 0.68d | 0.72b | 0.54h | 0.65e | 0.07i | 1.15a |
| Fiber | 0.02f | 0.02f | 0.04d | 0.03e | 0.02f | 0.05c | 0.07b | 0.07b | 0.38a |
| Energy (kcal) | 489b | 464d | 425i | 452g | 446h | 457f | 461e | 466c | 557.81a |
Values are means of three replicates. Superscript ‘a’ to ‘i’ in a row indicates higher to lower values respectively and the same superscript were not significantly different (p>0.05).
Protein, fat, fiber and ash contents were found significantly higher in B30 i.e. 14.06%, 39.45%, 0.38%, and 1.15% respectively. In case of LBC, these nutrients ranged from 6.38 to 9.41% (protein), 22.02 to 29.38% (fat), 0.02 to 0.07% (fiber), and 0.07 to 0.72% (ash). These results corroborated the findings of the previous studies, where the potentiality of buckwheat flour has been mentioned as a higher level of protein, fat, fiber, and ash.30 This study also depicted that the highest energy value of cake was found in BFC (557.81 Kcal/100 g), and in the case of LBC, the energy value was ranged from 425 to 489 Kcal/100 g (Table 4).
Conclusions
Buckwheat flour incorporation into wheat flour significantly improved the physicochemical and sensory properties of cake. BFC showed higher protein, fat, and fiber contents than cakes formulated with only wheat flour. Panelists rated the BFC as the best, whereas the cake prepared from wheat flour was found to have lowest sensorial scores. It is also important to note that the BFC cake developed during this study is microbiologically acceptable for up to 09 days. It can, therefore, be concluded that a good quality cake can be prepared by incorporating 30% buckwheat flour. Thus, the present study will encourage the local food industries to develop various traditional and the buckwheat-based food products.
Authors’ Contributions
Conceptualization, TF and SSR; Methodology, TF and SA; Formal Analysis, SSR; Investigation and Data Curation, TF, JF, FBH; Writing-Original Draft Preparation, SSR; Writing-Review and Editing, TF, and SSR. Final manuscript was read and approved by all authors.
Conflict of Interest
Authors declare no conflict of interest in this manuscript.
Acknowledgment
The authors are thankful to Bangladesh Council of Scientific & Industrial Research (BCSIR).
Funding Source
The author(s) received no financial support for the authorship, and/or publication of this article.
References
- H. Wijngaard, E.K. Arendt, Buckwheat, Cereal chemistry, 83(4) (2006) 391-401.
CrossRef - Ikeda, Kiyokazu, Buckwheat composition, chemistry, and processing, Advances in Food and Nutrition Research, 44 (2002) 395-434.
CrossRef - Javornik, I. Kreft, Characterization of buckwheat protiens, Fagopyrum, 4 (1984) 30-38.
- Kreft, V. Skrabanja, S. Ikeda, K. Ikeda, G. Bonafaccia, Buckwheat-nutritional value and technological properties. In “Alternative Getreiderohstoffe-Technologie und Ernahrungische Bedeutung” (Institute fur Lebensmitteltechnologie, ed.), Universitat fur Bodenkultur, Wien. (1998) 44-51.
- Ookubo, Nutrition and functionality of soybean. In “Daizu no Kagaku (Science of Soybean)” (F. Yamauchi and K. Ookubo, eds), Asakura-Shoten Press, Tokyo, (1992) 57-75.
- M. Kaur, K.S. Sandhu, A.P. Arora, A. Sharma, Gluten free biscuits prepared from buckwheat flour by incorporation of various gums: physicochemical and sensory properties, LWT- Food Science and Technology, 62(1) (2015) 628-32.
CrossRef - V. Skrabanja, H.G.M. Liljeberg Elmstahl, I. Kreft, I.M.E. Bjorck, Nutritional properties of starch in buckwheat products: studies in vitro and in vivo, J Agric Food Chem. 49 (2000) 490–496.
CrossRef - Kreft, V. Skrabanj, Nutritional properties of starch in buckwheat noodles, J Nutr Sci Vitaminol, 48 (2002), 47-50.
CrossRef - F.A. Manthey, S.R. Yalla, T.J. Dick, M. Badaruddin, Extrusion properties and cooking quality of spaghetti containing buckwheat bran flour, Cereal Chem, 81 (2004) 232–236.
CrossRef - AACC, Approved methods of American Association of Cereal Chemists, 10th ed. American Association of Cereal Chemists, St. Paul, MN, USA (2000).
- AOAC, Official methods of analysis of association of official analytical chemistry International, 18th Ed. Association of Analytical Communities, Gaithersburg, Maryland, USA, (2005).
- E.H. Eneche, Biscuit-making potential of millet/pigeon pea flour blends, Plant Foods Hum. Nutr. 54 (1999) 21-27.
CrossRef - S. Jahan, T. Gosh, M. Begum, B.K. Saha, Nutritional profile of some tropical fruits in Bangladesh: specially anti-oxidant vitamins and minerals, Bangl. J. Med. Sci. 10 (2011) 95-103.
CrossRef - K. Mutalik, J.G. Baragi, S.B. Mekali, C.V. Gouda, N.B. Vardhaman, Determination of estimation of potassium ion in dry fruits by flame photometry and their proximate analysis, J Chem Pharm Res. 3 (2011) 1097-1102.
- Arunkumar, N.G. Avinash, H. Rao, K.B. Robin, S. Samshuddin, Estimation of calcium, potassium and sodium contents in commonly consumed food of Karnataka coastal belt region, India, Der Chem. Sin. 6 (2015) 100-103.
- R. Parvin, T. Farzana, S. Mohajan, H. Rahman, S.S. Rahman, Quality improvement of noodles with mushroom fortified and its comparison with local branded noodles, NFS Journal, 20 (2020) 37-42.
CrossRef - Maturin, J.P.Peeler, Aerobic Plate Count. In Bacteriological Analytical (Ed.), Manual, 8th ed. United States: AOAC International (2001).
- Tournas, M.E.Stack, P.B. Mislivec, H.A. Koch, R. Bandler,Yeasts, Molds and Mycotoxins. In Bacteriological Analytical (Ed.), Manual, 8th ed. United States: AOAC International (2001).
- Feng, S.D. Weagant, M.A. Grant, W. Burkhardt,Enumeration of Escherichia coli and the Coliform Bacteria. In U.S. Food and Drug Administration (Ed.), Bacteriological Analytical Manual, 8th ed. United States: AOAC International (2013).
- M. Gdoura-Ben Amor, M. Siala, M. Zayani, N. Grosset, S. Smaoui, F. Messadi-Akrout, F. Baron, S. Jan, M. Gautier, R. Gdoura, Isolation, identification, prevalence, and genetic diversity of Bacillus cereus group bacteria from different foodstuffs in Tunisia, Frontiers in microbiology, 9 (2018) 447.
CrossRef - M. Siala, A. Barbana, S. Smaoui, S. Hachicha, C. Marouane, S. Kammoun, R. Gdoura, F. Messadi-Akrout, Screening and detecting Salmonella in different food matrices in Southern Tunisia using a combined enrichment/real-time PCR method: correlation with conventional culture method, Frontiers in microbiology, 8 (2017) 2416.
CrossRef - Y. Puwani, R. Widaningrum, R. Thahir, K. Muslich, Effect of heat moisture treatment of sago starch on its noodle quality, Int. J. Agric. Sci. 6 (2006) 23-30.
- P. Manzi, A. Aguzzi, L. Pizzoferrato, Nutritional value of mushrooms widely consumed in Italy, Food Chem. 73 (2001) 321-325.
CrossRef - Maeda, K. Miyake, M. Tahara, N. Morita, Substitution of buckwheat for wheat flours on processing pasta and cookie, Fagopyrum, 21 (2004), 99-103.
- S. Mohajan, M. Munna, T. Orchy, M. Hoque, T. Farzana, Buckwheat flour fortified bread. Bangladesh Journal of Scientific and Industrial Research, 54(4) (2019) 347-356.
CrossRef
- Y. Baljeet, B.Y. Ritika, L.Y. Roshan, Studies on functional properties and incorporation of buckwheat flour for biscuit making, Int. Food Res J. 17 (2010):1067-1076.
- Y. Gokcen, B. Nermin, Effects of Whole Buckwheat Flour on Physical, Chemical, and Sensory Properties of Flat Bread, Lavaş, Czech J Food Sci. 30 (2012) 534-540.
CrossRef - WHO, Guideline value for food and drinking water, World Health Organization, Geneva, (1994) 3-4.
- B. Carl, Confectionery products-Cakes and pastries. In: Encyclopedia of Food Microbiology (ed C.A. Batt), Academic Press, Massachusetts, (2014) 500-502.
- L. Alvarez-Jubete, E.K. Arendt, E. Gallagher, Nutritive value and chemical composition of pseudocereals as gluten-free ingredients, Int J. Food Sci Nutr. 60 (2009) 240-257.
CrossRef
Accepted on: 17 Jun 2021
Second Review by: Alexandrina Sirbu
Final Approval by: Prof. Jiwan S. Sidhu


Web of Science Coverage
Emerging Sources Citation Index (ESCI)
2024 Journal Impact Factor: 1.1
Scopus Journal Metrics
CiteScore 2025: 2.6
CiteScore Details
Sustainable Nutrition: Food Systems, Nutrient Retention, and Public Health Impact
![]()
This journal is a member of, and subscribes to the principles of, the Committee on Publication Ethics (COPE)


